
Studies of Mutation Accumulation in Three Codon Positions using Monte
Carlo Simulations and Metropolis-Hastings Algorithm
Małgorzata Grabi
´
nska, Paweł Bła
˙
zej and Paweł Mackiewicz
Department of Genomics, Faculty of Biotechnology, University of Wrocław, Wrocław, Poland
Keywords:
Codon, Evolution, Metropolis-Hastings Algorithm, Monte Carlo Simulations, Mutation, Nucleotide Compo-
sition, Protein Coding Sequence, Rate Matrix, Selection, Substitution, Transition, Transversion.
Abstract:
Protein coding sequences are characterized by specific nucleotide composition in three codon positions as
a result of mutational and selection pressures. To analyse the impact of mutations and different transi-
tion/transversion ratio on three codon position in protein coding sequences, we elaborated a model of genome
evolution based Monte Carlo simulation. Selection was applied against stop translation codons and modi-
fied Metropolis-Hastings algorithm to maintain typical nucleotide composition of particular codon positions.
The simulations were performed on genomes consisting of bacterial gene sequences. We used a series of
nucleotide substitution matrices assuming different transition/transversion ratio and nucleotide stationary dis-
tribution characteristic of the real mutational pressure. The simulations showed exponential decrease in the
number of eliminated genomes with the growth of the transition/transversion ratio. The same trend was also
observed both for accepted and to lesser extent for rejected mutations. The third codon positions much more
mutations accepted than rejected because of very similar composition to the mutational stationary distribution,
whereas the first positions accumulated the smallest number of mutations and rejected the most as a result of
strong selection on its nucleotide composition. The obtained results showed different response of three codon
positions on mutational pressure related with their characteristic nucleotide composition.
1 INTRODUCTION
One of characteristic features of protein coding se-
quences resulting from their coding and functional re-
quirements is their triplet (codon) structure, which is
related to a specific nucleotide composition of three
codon positions (Wong and Cedergren, 1986; An-
derson and Kurland, 1990; Zhang and Zhang, 1991;
Gutierrez et al., 1996; Cebrat et al., 1997a; Cebrat
et al., 1998; Wang, 1998). There are two forces, mu-
tation pressure and selection constraints, which can
change or maintain this composition (Frank and Lo-
bry, 1999).
The first two codon positions are usually sub-
jected to strong selective constraints although some
influence of replication-associated mutational pres-
sure was also observed (McLean et al., 1998; Ce-
brat et al., 1999; Mackiewicz et al., 1999a; Tillier
and Collins, 2000; Kowalczuk et al., 2001b). Gen-
erally, the first codon positions of protein coding se-
quences are rich in purines, guanine (G) and adenine
(A), whereas the second positions are poor in guanine
and contain more cytosine (C) and adenine. The dom-
inance of purines, and particularly guanine in the first
codon position and their deficiency in the second po-
sition can ensure the correct reading frame of tran-
scripts during translation by interaction of nucleotides
in the first codon positions of mRNA with also period-
ically distributed cytosines in rRNA (Trifonov, 1987;
Lagunez-Otero and Trifonov, 1992; Trifonov, 1992).
In support of this, highly expressed genes are char-
acterized by increased usage of codons starting from
guanine and to lesser extent from adenine, which does
not depend on the overall G+C content in the genome
(Gutierrez et al., 1996; Pan et al., 1998; Akashi,
2003; Das et al., 2005). This composition reflects
also the frequent usage of acidic amino acids coded
by GAN codons (Karlin and Mrazek, 1996) as well as
glycine, alanine and valine in coded proteins (Karlin
et al., 1992). It was found that these amino acids are
very common in products of highly transcribed genes
(Jansen and Gerstein 2000, Akashi 2003, Marin et al.
2003). The excess of purines in the coding sequences
(Shepherd, 1981; Smithies et al., 1981; Karlin and
Burge, 1995; Cebrat et al., 1997b; Freeman et al.,
1998) was also explained by their less susceptibility to
245
Grabi
´
nska M., Blazej P. and Mackiewicz P..
Studies of Mutation Accumulation in Three Codon Positions using Monte Carlo Simulations and Metropolis-Hastings Algorithm.
DOI: 10.5220/0004911502450252
In Proceedings of the International Conference on Bioinformatics Models, Methods and Algorithms (BIOINFORMATICS-2014), pages 245-252
ISBN: 978-989-758-012-3
Copyright
c
2014 SCITEPRESS (Science and Technology Publications, Lda.)

mutations than pyrimidines (Hutchinson, 1996). Dur-
ing transcription process, the sense strand of genes
stays longer in the single-stranded state. Therefore,
it is more exposed than the antisense strand, which
is preferably repaired and protected by proteins (Mel-
lon and Hanawalt, 1989; Hanawalt, 1991). Changes
in the second position in codons are generally more
conserved than in the first one because mutations in
the former more often lead to changes in hydropho-
bicity and polarity of coded amino acid residues.
On the other hand, the third codon positions are
most of all subjected to accumulations of mutations
because most nucleotide substitutions in these sites
usually do not change coded amino acid residues or
their properties. However, not all substitutions are
necessarily neutral. Some preferences in usage of
synonymous codons (i.e. coded the same amino acid)
were observed in highly expressed genes, which is
positively correlated with tRNA content in cells and
the rate of translation (Ikemura, 1981; Ikemura, 1985;
Bennetzen and Hall, 1982; Sharp and Cowe, 1991;
Kanaya et al., 1999). The third codon position are
usually rich in pyrimidines, particulary in thymine
(T), probably as a result of the most frequent point
mutation, deamination of cytosine and its homologue
5-methylcytosine to uracile, which finally leads to
substitution C to T (Echols and Goodman, 1991; Lin-
dahl, 1993; Kreutzer and Essigmann, 1998).
There are two types of point mutations happening
in protein coding sequences: transitions (substitution
between the same chemical types of nucleotides, be-
tween purines and between pyrimidines) and transver-
sions (substitution between the different types of nu-
cleotides, between purines and pyrimidines). Transi-
tions are usually several times more often observed
in real sequences than transversions although the ex-
pected ratio is 1:2 if all substitutions are equally likely
(Wakeley, 1996). This bias results from higher rate of
chemical changes between nucleotides with the sim-
ilar structure and more common transition substitu-
tions introduced during replication of genetic mate-
rial. Moreover, transitions more rarely cause changes
in coded amino acids or their properties, therefore are
more often accepted than transversions.
To study the influence of mutations and differ-
ent transition/transversion rate on accumulation of
substitutions in three codon position of protein cod-
ing sequences, we elaborated Monte Carlo simulation
model of genome evolution. As a selection module,
we applied selection against occurrence of stop trans-
lation codons and a modified Metropolis-Hastings al-
gorithm to keep nucleotide composition characteristic
of a given codon position by acceptance or rejection
of introduced mutations.
2 MATERIALS AND METHODS
The simulations were carried out for two million steps
on the population of 72 individuals that represented
protein coding sequences from bacterial genome of
Borrelia burgdorferi. This genome is very suitable for
mutation simulation studies (Kowalczuk et al., 1999;
Bła
˙
zej et al., 2012) because shows very strong com-
positional bias related to differently replicated lead-
ing/lagging DNA strands (McInerney, 1998; Mack-
iewicz et al., 1999b). Moreover, it has the de-
termined mutational pressure associated with DNA
replication (Kowalczuk et al., 2001a). In our sim-
ulation, each individual consisted of 333 gene se-
quences, with the total length of 353, 035 bp, ly-
ing on the leading strand. The sequences and their
annotations were downloaded from NCBI database
(http://www.ncbi.nlm.nih.gov).
Table 1: The substitution rate matrix P corresponding to
HKY85 model, used in simulations. A nucleotide in the
column is substituted by a nucleotide in the row. π
x
is the
stationary frequency of a given nucleotide, whereas α cor-
responds to the transition rate.
A C G T
A - π
C
απ
G
π
T
C π
A
- π
G
απ
T
G απ
A
π
C
- π
T
T π
A
απ
C
π
G
-
The applied Monte Carlo simulations consisted of
two stages: mutation of gene sequences and selec-
tion of individuals in population. The mutations were
introduced into the sequences according to the Pois-
son process with average equal to one mutation per
genome. Nucleotide substitutions (mutations) were
generated by a probability matrix P (Table 1) de-
scribed by the HKY85 model (Hasegawa et al., 1985).
This model distinguished transversion and transition
rates as well as assumed that a given substitution was
proportional to the stationary frequency of nucleotide
π
x
that was created by this substitution. The station-
ary distribution of nucleotides was the same as for the
empirical matrix describing mutational pressure for
the leading strand in B. burgdoferi genome (Table 2),
which was also used in these simulation for compari-
son.
We decided to use the modified model of nu-
cleotide substitution because it enabled easy imple-
mentation of various transition rates α and, simulta-
neously, inclusion of the assumed stationary distribu-
tion. We tested different values of α from 0.1 to 10
with the step of 0.1. For all cases, transversion rate
was fixed to 1 and defined only from frequencies of
nucleotides under the stationary distribution π.
BIOINFORMATICS2014-InternationalConferenceonBioinformaticsModels,MethodsandAlgorithms
246
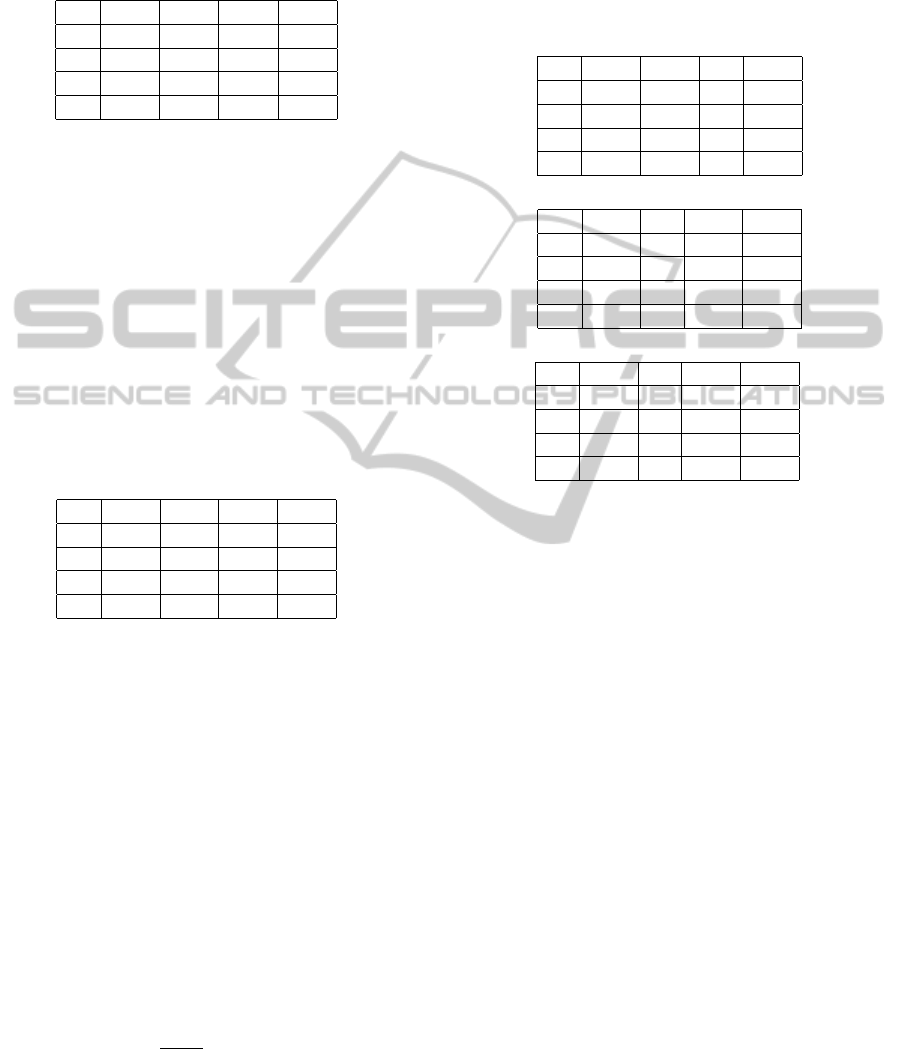
Table 2: The uniformized substitution matrix describing
real mutational pressure for the leading DNA strand in the
B. burgdorferi genome (Kowalczuk et al., 2001a). A nu-
cleotide in the column changes to a nucleotide in the row
with the given probability.
A C G T
A 0.81 0.02 0.07 0.10
C 0.07 0.62 0.05 0.26
G 0.16 0.01 0.71 0.12
T 0.07 0.03 0.03 0.87
Every substitution rate matrix was transformed
to jump probability matrix using uniformization
method (Tijms, 2003), see Table 3 as an example.
This approach is generally used to change the original
continuous in time Markov process with non-identical
leaving rates into an equivalent of stochastic process
where transition between each states are generated by
Poisson process with the same fixed rate. This method
is very useful in the simulation of multidimensional
Markov processes.
Table 3: The uniformized substitution matrix for the
HKY85 model assuming the transition/transversion ratio
α=1.1 as for the real mutational matrix. A nucleotide in the
column changes to a nucleotide in the row with the given
probability.
A C G T
A 0.79 0.02 0.07 0.12
C 0.07 0.64 0.03 0.26
G 0.17 0.01 0.70 0.12
T 0.08 0.03 0.03 0.86
Two types of selection were applied. One was
against occurrence of termination translation codons.
If one of three possible stop codons occurred inside
a given protein coding sequence then the individual
was removed from the population and replaced by an-
other. The second type of selection was for main-
tenance of characteristic nucleotide composition in
each of three positions in codon. To do so, we ap-
plied for every codon position a modified acceptance-
rejection method based on Metropolis-Hastings (MH)
algorithm (Chib and Greenberg, 1995). In contrast
to the original MH algorithm that generates a se-
quence of random samples from a stationary distribu-
tion π, we computed acceptance probability for each
nucleotide substitution a
xy
using proposal transition
probabilities and the assumed stationary distribution
of nucleotides in three codon positions, separately:
a
xy
= min(
π
y
q
yx
π
x
q
xy
, 1), π
x
q
xy
> 0,
where π
x
, x ∈ {A,C, T,G} is frequency of nucleotides
in particular codon positions of protein coding se-
quences, whereas q
xy
are transition probabilities from
matrix P which generates mutation process (see Ta-
ble 4 as an example).
Table 4: The acceptance-rejection matrices for three codon
positions based on the HKY85 matrix assuming the transi-
tion/transversion ratio α=1.1.
the first codon position
A C G T
A 1 1 1 0.39
C 0.62 1 1 0.25
G 0.52 0.84 1 0.21
T 1 1 1 1
the second codon position
A C G T
A 1 1 0.91 0.64
C 0.39 1 0.36 0.25
G 1 1 1 0.70
T 1 1 1 1
the third codon position
A C G T
A 1 1 1 1
C 0.84 1 0.88 0.85
G 0.96 1 1 0.96
T 0.99 1 1 1
Additionally, the acceptance of substitution was
determined by a random variable U with uniform dis-
tribution with the range [0, 1]. If U > a
xy
, the substitu-
tion of x by y was rejected, otherwise it was accepted.
It allowed to keep characteristic nucleotide composi-
tion in three codon position during simulations. For
instance, if π
y
q
yx
> π
x
q
xy
, it indicated that changes
from nucleotide y to x were too often than from nu-
cleotide x to y, then the move from nucleotide x to
new state y was accepted. An individual in which the
substitution was rejected, was ’killed’ and replaced by
another from the population.
3 RESULTS AND DISCUSSION
3.1 Nucleotide Composition in Three
Codon Positions
Analysed protein coding sequences show character-
istic nucleotide composition in three codon positions
(Table 5). The first position is significantly rich in
purines, adenine and guanine. However, it should be
noticed that guanine is two times more frequent in
this position than in others. The second position has
generally more adenine and thymine with compara-
ble frequencies although cytosine reaches the highest
StudiesofMutationAccumulationinThreeCodonPositionsusingMonteCarloSimulationsandMetropolis-Hastings
Algorithm
247
usage just in this position. The third position is also
AT-rich but thymine significantly dominates. Inter-
estingly, the composition of the third position is strik-
ingly similar to the stationary distribution of empiri-
cal mutational matrix, whereas the composition of the
first position significantly differs. It strongly prefers
purines. It indicates that the third codon position is
subjected to the weakest selection pressure then freely
accumulates nucleotide substitutions resulting from
mutations. On the other hand, the global composi-
tion of the first position is the least susceptible to the
mutational pressure and is under the strongest selec-
tion.
Table 5: Nucleotide frequency for three positions in codon
and stationary distribution for empirical mutational matrix.
A C G T
stationary 0.32 0.06 0.14 0.48
1st position 0.37 0.11 0.30 0.22
2nd position 0.35 0.17 0.14 0.34
3rd position 0.31 0.07 0.14 0.48
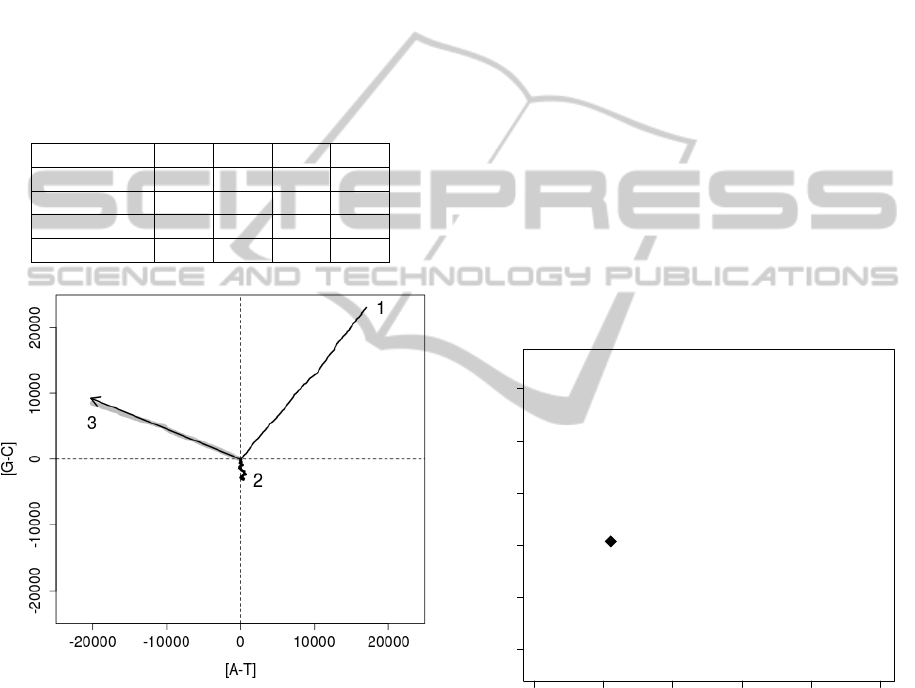
Figure 1: DNA walks, a graphical representation of nu-
cleotide composition in three codon position of protein cod-
ing sequence from B. burgdorferi. The walk starts at the first
nucleotide in the fixed codon position and jumps every third
nucleotide to the last one. Every jump begins at the origin of
a Cartesian plane and is associated with a unit shift, which
depends on the nucleotide visited during the walk. The shift
is (0; 1) for guanine, (1; 0) for adenine, (0;-1) for cytosine,
and (-1; 0) for thymine. The vector indicates the stationary
distribution of empirical mutational matrix.
The compositional trends are very well visualised
by DNA walks (Figure 1), which are graphical repre-
sentation of nucleotide composition in an analysed se-
quence (Cebrat and Dudek, 1998; Cebrat et al., 1998).
The longest walk is clearly visible in the first codon
position, which indicates the strongest compositional
trend, i.e. strong preference of some nucleotides (here
purines) than other. The clear trend is also in the third
position, which very well matches the stationary com-
position generated by the empirical mutational ma-
trix and shows excess of guanine over cytosine and
thymine over adenine. On the other hand, the weak-
est trend is in the second position, which indicates
that there are no special preferences in nucleotide oc-
currence in this position. It means that this position
has more balanced frequency of complementary nu-
cleotides, adenine vs. thymine and guanine vs. cyto-
sine.
3.2 Simulations of Mutation and
Selection Processes
Simulations for different transition/transversion ratios
(calculated from elements of uniformised probability
matrices) showed that the mean number of individuals
eliminated from populations decreased in exponential
manner with the increase of the ratio (Figure 2). It
indicates a positive effect of the excess of transitions
over transversions on genome survival.
●
●
●
●
●
●
●
●
●
●
●
●
●
●
●
●
●
●
●
●
●
●
●
●
●
●
●
●
●
●
●
●
●
●
●
●
●
●
●
●
●
●
●
●
●
●
●
●
●
●
●
●
●
●
●
●
●
●
●
●
●
●
●
●
●
●
●
●
●
●
●
●
●
●
●
●
●
●
●
●
●
●
●
●
●
●
●
●
●
●
●
●
●
●
●
●
●
●
●
●
0 1 2 3 4 5
115000 125000 135000
transition/transversion ratio
mean number of killed individuals
Figure 2: Mean number of eliminated individuals from pop-
ulation in the relationship to transition/transversion ratio.
The black diamond indicates the empirical mutational ma-
trix.
It is in agreement with the fact that transversions
are more harmful by changing of coded amino acid
than transition in protein coding sequences. The em-
pirical matrix appeared very similar in the number of
eliminated genomes to the HKY85 matrix assuming
the same transition/transversion ratio 1.1. It seems
that the applied HKY85 model is very good approxi-
mation of the real mutational matrix (please compare
BIOINFORMATICS2014-InternationalConferenceonBioinformaticsModels,MethodsandAlgorithms
248

Table 3 and Table 2).
The mean number of accepted mutations in all
codon positions was more than two times higher
than the rejected ones (Figure 3). The number of
both mutation types decreased with growth of tran-
sition/transversion ratio although the fall was larger
for the accepted mutations. However, in both cases,
the decrease became weaker and finally stabilized for
higher transition/transversion ratios. It indicates that
the increase in the ratio is not necessary to signifi-
cantly diminish the rejected mutations. Interestingly,
the values obtained for empirical matrix were very
similar to the HKY85 model with the similar transi-
tion/transversion ratio. Genomes in the simulations
with the real matrix accepted only slightly less muta-
tions than in the case of the HKY85 model.
●
●
●
●
●
●
●
●
●
●
●
●
●
●
●
●
●
●
●
●
●
●
●
●
●
●
●
●
●
●
●
●
●
●
●
●
●
●
●
●
●
●
●
●
●
●
●
●
●
●
●
●
●
●
●
●
●
●
●
●
●
●
●
●
●
●
●
●
●
●
●
●
●
●
●
●
●
●
●
●
●
●
●
●
●
●
●
●
●
●
●
●
●
●
●
●
●
●
●
●
●
0 1 2 3 4 5
100000 150000 200000 250000 300000 350000
transition/transversion ratio
mean number of mutations
●
●
rejected
accepted
Figure 3: Mean number of rejected and accepted mutations
in the relationship to transition/transversion ratio. The black
circle and diamond indicate the empirical mutational ma-
trix.
The mean of accepted mutations exceeded the
number of rejected ones in three codon positions
for tested values of transition/transversion ratio (Fig-
ure 4). The greatest difference between these num-
bers was for the third codon positions. The muta-
tions were most frequently accepted and most rarely
rejected in these positions. It results from very high
similarity between nucleotide composition of these
positions with the stationary distribution of the ap-
plied mutational matrix (Table 5, Figure 1). It indi-
cates that the third codon positions are subjected to
the weakest selection for the nucleotide composition
and can quite freely accumulated mutations. Actually,
they very well reflect mutational pressure associated
with replication (McLean et al., 1998; Cebrat et al.,
1999). On the other hand, the first codon positions
accumulated the smallest number of mutations and re-
jected the most in comparison to other positions. In-
terestingly, the number of accepted and rejected mu-
tations in the first codon positions became very simi-
lar when transition/transversion ratio declined. These
strong restrictions on mutation accumulation in the
first positions in our simulations result from the sub-
stantial compositional trend in these positions (Fig-
ure 1), which significantly deviates from the compo-
sition generated by the applied mutational pressure.
As it was reviewed in the Introduction, this spe-
cific composition is strongly related with various se-
lection constraints on coding function of protein gene
sequences. The number of mutations for the second
positions had intermediate values between the first
and third positions. In real sequences the second po-
sition usually is more conserved than the first one be-
cause substitutions in it always change coded amino
acid and very often its physicochemical properties.
However, our simulation considered only the effect
of selection on nucleotide compositions but not re-
strictions on amino acid substitution. Thus our results
suggest that the selection on nucleotide composition
is weaker in the second codon position than the first
one.
The relationship between the mean number
of accepted or rejected mutations and transi-
tion/transversion ratio appeared different for three
codon positions (Figure 4). Similarly to the case
of mutations calculated for all positions (Figure 3),
the number of accepted mutations for third and sec-
ond codon positions declined rapidly with transi-
tion/transversion ratio and then begun stabilised for
large values of ratio. However, the number of ac-
cepted mutations for first positions was stable and did
not depend on the ratio. On the other hand, the ex-
ponential decrease was observed for the number of
rejected mutations in these positions. In the remain-
ing cases, the number of rejected mutations did not
seem to depend from the transition/transversion ratio.
Only a small increase in the number of rejected muta-
tions was observed for the second and third codon po-
sitions. All the results about the number of accepted
and rejected mutations suggest that excess of transi-
tions over transversions has positive effect on mainte-
nance of nucleotide composition characteristic of the
first codon position, whereas negative in the case of
other codon positions.
The differences between numbers of accepted and
rejected mutations for the empirical matrix and the
corresponding HKY85 model were generally very
small (Table 6). The largest deviations were observed
for the third codon positions especially for the number
of rejected mutations. The empirical matrix rejected
StudiesofMutationAccumulationinThreeCodonPositionsusingMonteCarloSimulationsandMetropolis-Hastings
Algorithm
249
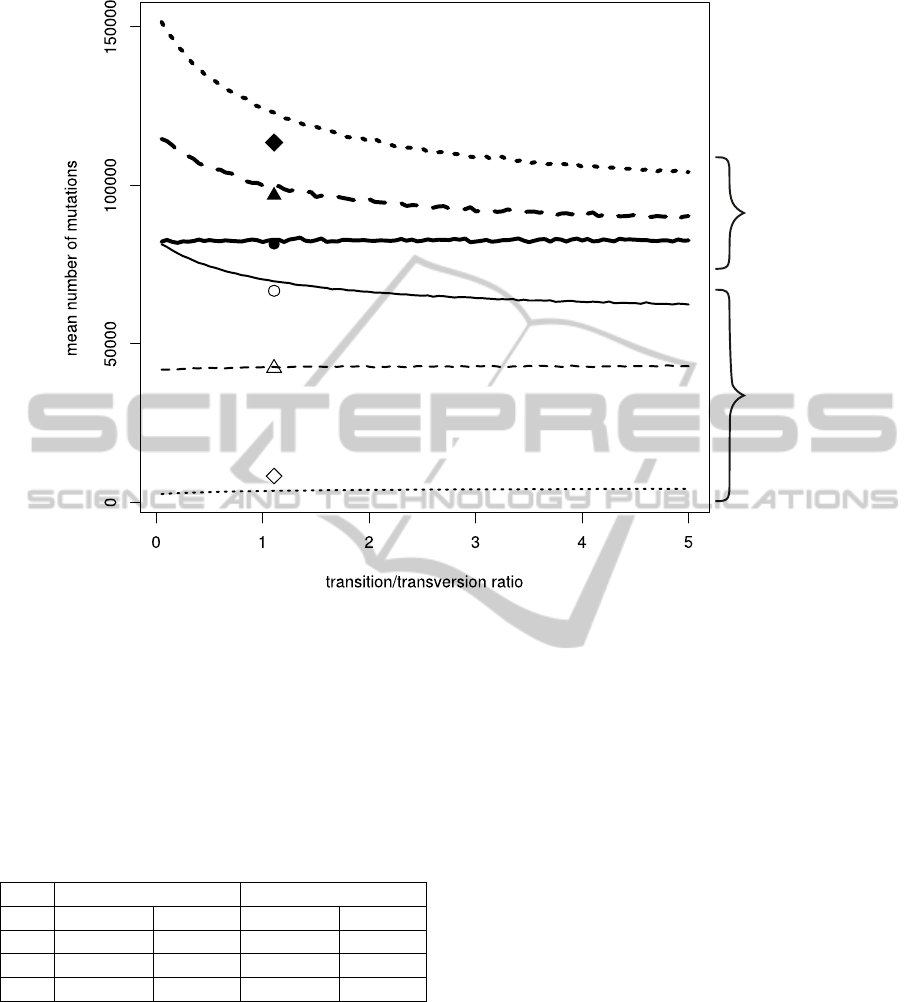
accepted
mutations
rejected
mutations
1st codon position
1st codon position
2nd codon position
2nd codon position
3rd codon position
3rd codon position
Figure 4: Mean number of rejected and accepted mutations in the relationship to transition/transversion ratio for three codon
positions. The diamond, triangle and circle symbols indicate the empirical mutational matrix.
two times more mutations than the HKY85. Never-
theless, the number of these mutations for the third
codon positions were much smaller (five to almost
twenty times) in comparison to other positions.
Table 6: The number of accepted and rejected mutations
in three codon positions for the empirical matrix and the
HKY85 matrix assuming the transition/transversion ratio
α=1.1.
accepted rejected
empirical HKY85 empirical HKY85
1st 81398 82757 66631 69663
2nd 96715 99078 42260 42627
3rd 113363 122957 8238 3580
3.3 CONCLUSIONS
The obtained results showed that excess of transi-
tion over transversion in mutational pressure is gener-
ally profitable for the studied genome because mean
number of eliminated individuals decreased exponen-
tially with the growth of transition/transversion ra-
tio (Figure 2). It is well-known that transversions
are more harmful than transitions because they more
frequently change coded amino acid. However, the
presented results are not trivial because the simula-
tions did not consider any selection on coded amino
acids. Instead of that, we applied independent selec-
tion on nucleotide composition in three codon posi-
tions. The results indicate that not only genetic code
and amino acid composition but also nucleotide com-
position typical of the first codon positions are op-
timized for high transition/transversion ratio. More-
over, these codon positions appeared most conserved
because accepted the least and rejected the largest
number of mutations. Interestingly, the second codon
positions usually considered conserved according to
the effect on amino acid substitution were more tol-
erant on mutation accumulation in our simulations.
Because the applied model considered selection on
nucleotide composition, it seems that maintenance of
this composition by selection is more important for
the first codon positions than for the second ones. It
would be interesting to check if these conclusions are
universal and valid for other genomes.
BIOINFORMATICS2014-InternationalConferenceonBioinformaticsModels,MethodsandAlgorithms
250

REFERENCES
Akashi, H. (2003). Translational selection and yeast pro-
teome evolution. Genetics, 164:1291–1303.
Anderson, S. G. E. and Kurland, C. G. (1990). Codon
preferences in free-living microorganisms. Microbiol.
Rev., 54:198–210.
Bennetzen, J. L. and Hall, B. D. (1982). Codon selection in
yeast. J Biol Chem, 257(6):3026–3031.
Bła
˙
zej, P., Mackiewicz, P., and Cebrat, S. (2012). Simula-
tion of bacterial genome evolution under replicational
mutational pressures. In Proceedings of the BIOSTEC
2012, 5th International Joint Conference on Biomedi-
cal Engineering Systems and Technologies Bioinfor-
matics 2012, International Conference on Bioinfor-
matics Models, Methods and Algorithms, Vilamoura,
Algarve, Portugal, 1-4 February, pages 51–57.
Cebrat, S. and Dudek, M. (1998). The effect of DNA
phase structure on DNA walks. The European Phys-
ical Journal B-Condensed Matter and Complex Sys-
tems, 3(2):271–276.
Cebrat, S., Dudek, M. R., Gierlik, A., Kowalczuk, M., and
Mackiewicz, P. (1999). Effect of replication on the
third base of codons. Physica A, 265:78–84.
Cebrat, S., Dudek, M. R., and Mackiewicz, P. (1998). Se-
quence asymmetry as a parameter indicating coding
sequence in Saccharomyces cerevisiae genome. The-
ory in Biosciences, 117:78–89.
Cebrat, S., Dudek, M. R., Mackiewicz, P., Kowalczuk, M.,
and Fita, M. (1997a). Asymmetry of coding ver-
sus non-coding strands in coding sequences of differ-
ent genomes. Microbial & Comparative Genomics,
2:259–268.
Cebrat, S., Dudek, M. R., and Rogowska, A. (1997b).
Asymmetry in nucleotide composition of sense and
antisense strands as a parameter for discriminating
open reading frames as protein coding sequences. J.
Appl. Genet., 38:1–9.
Chib, S. and Greenberg, E. (1995). Understanding the
Metropolis-Hastings Algorithm. The American Statis-
tician, 49(4):327–335.
Das, S., Ghosh, S., Pan, A., and Dutta, C. (2005). Compo-
sitional variation in bacterial genes and proteins with
potential expression level. FEBS Letters, 579:5205–
5210.
Echols, H. and Goodman, M. F. (1991). Fidelity mech-
anisms in DNA replication. Annu Rev Biochem,
60:477–511.
Frank, A. and Lobry, J. (1999). Asymmetric substitution
patterns: a review of possible underlying mutational
or selective mechanisms. Gene, 238:65–77.
Freeman, J., Plasterer, T., Smith, T., and Mohr, S. (1998).
Patterns of genome organization in bacteria. Science,
279:1827.
Gutierrez, G., Marquez, L., and Martin, A. (1996). Pref-
erence for guanosine at first codon position in highly
expressed Escherichia coli genes. a relationship with
translation efficiency. Nucleic Acids Res., 24:2525–
2528.
Hanawalt, P. C. (1991). Heterogeneity of dna repair at
the gene level. Mutation Research/Fundamental and
Molecular Mechanisms of Mutagenesis, 247(2):203–
211.
Hasegawa, M., Kishino, H., and Yano, T. (1985). Dating of
the human-ape splitting by a molecular clock of mito-
chondrial dna. J Mol Evol, 22(2):160–174.
Hutchinson, F. (1996). Mutagenesis. In Neidhardt,
F. C., editor, Escherichia coli and Salmonella. Cel-
lular and molecular biology, pages 749–763. Asm.
Press, Washington D.C.
Ikemura, T. (1981). Correlation between the abundance of
Escherichia coli transfer RNAs and the occurrence of
the respective codons in its protein genes. J Mol Biol,
146(1):1–21.
Ikemura, T. (1985). Codon usage and tRNA content in uni-
cellular and multicellular organisms. Mol. Biol. Evol.,
2:1334.
Kanaya, S., Yamada, Y., Kudo, Y., and Ikemura, T. (1999).
Studies of codon usage and trna genes of 18 unicel-
lular organisms and quantification of Bacillus subtilis
trnas: gene expression level and species-specific di-
versity of codon usage based on multivariate analysis.
Gene, 238(1):143–155.
Karlin, S., Blaisdell, B. E., and Bucher, P. (1992). Quantile
distributions of amino acid usage in protein classes.
Protein Eng, 5(8):729–738.
Karlin, S. and Burge, C. (1995). Dinucleotide relative abun-
dance extremes: a genomic signature. Trends Genet,
11(7):283–290.
Karlin, S. and Mrazek, J. (1996). What drives codon choices
in human genes? J Mol Biol, 262(4):459–472.
Kowalczuk, M., Gierlik, A., Mackiewicz, P., Cebrat, S.,
and Dudek, M. (1999). Optimization of gene se-
quences under constant mutational pressure and selec-
tion. Physica A: Statistical Mechanics and its Appli-
cations, 273(1):116–131.
Kowalczuk, M., Mackiewicz, P., Mackiewicz, D., Now-
icka, A., Dudkiewicz, M., Dudek, M., and Cebrat,
S. (2001a). High correlation between the turnover of
nucleotides under mutational pressure and the DNA
composition. BMC Evol. Biol., 1:13.
Kowalczuk, M., Mackiewicz, P., Mackiewicz, D., Nowicka,
A., Dudkiewicz, M., Dudek, M. R., and Cebrat, S.
(2001b). DNA asymmetry and the replicational muta-
tional pressure. J. Appl. Genet., 42(4):553–577.
Kreutzer, D. A. and Essigmann, J. M. (1998). Oxidized,
deaminated cytosines are a source of C → T transi-
tions in vivo. Proc Natl Acad Sci U S A, 95(7):3578–
3582.
Lagunez-Otero, J. and Trifonov, E. N. (1992). mRNA pe-
riodocal infrastructure complementary to the proof-
reading site in the ribosome. J. Biomol. Struct. Dyn.,
10:455–464.
Lindahl, T. (1993). Instability and decay of the primary
structure of DNA. Nature, 362(6422):709–715.
Mackiewicz, P., Gierlik, A., Kowalczuk, M., Dudek, M.,
and Cebrat, S. (1999a). Asymmetry of nucleotide
composition of prokaryotic chromosomes. J. Appl.
Genet., 40:1–14.
Mackiewicz, P., Gierlik, A., Kowalczuk, M., Szczepanik,
D., Dudek, M., and Cebrat, S. (1999b). Mechanisms
StudiesofMutationAccumulationinThreeCodonPositionsusingMonteCarloSimulationsandMetropolis-Hastings
Algorithm
251

generating long-range correlation in nucleotide com-
position of the Borrelia burgdorferi genome. Physica
A, 273:103–115.
McInerney, J. (1998). Replicational and transcriptional se-
lection on codon usage in Borrelia burgdorferi. Proc.
Natl. Acad. Sci. U.S.A., 95:10698–10703.
McLean, M., Wolfe, K., and Devine, K. (1998). Base com-
position skews, replication orientation, and gene ori-
entation in 12 prokaryote genomes. J. Mol. Evol.,
47:691–696.
Mellon, I. and Hanawalt, P. C. (1989). Induction of
the Escherichia coli lactose operon selectively in-
creases repair of its transcribed DNA strand. Nature,
342(6245):95–98.
Pan, A., Dutta, C., and Das, J. (1998). Codon usage in
highly expressed genes of Haemophillus influenzae
and Mycobacterium tuberculosis: translational selec-
tion versus mutational bias. Gene, 215:405–413.
Sharp, P. M. and Cowe, E. (1991). Synonymous codon
usage in Saccharomyces cerevisiae. Yeast, 7(7):657–
678.
Shepherd, J. C. (1981). Method to determine the reading
frame of a protein from the purine/pyrimidine genome
sequence and its possible evolutionary justification.
Proc. Natl. Acad. Sci. USA, 78:1596–1600.
Smithies, O., Engels, W. R., Devereux, J. R., Slightom,
J. L., and Shen, S. (1981). Base substitutions, length
differences and DNA strand asymmetries in the hu-
man g gamma and a gamma fetal globin gene region.
Cell, 26:345–353.
Tijms, H. (2003). A first course in stochastic processes.
John Wiley & Sons LTD.
Tillier, E. and Collins, R. (2000). The contributions of
replication orientation, gene direction, and signal se-
quences to base composition asymmetries in bacterial
genomes. J. Mol. Evol., 50:249–257.
Trifonov, E. N. (1987). Translation framing code and frame-
monitoring mechanism as suggested by the analysis of
mRNA and 16S rRNA nucleotide sequences. J. Mol.
Biol., 194:643–652.
Trifonov, E. N. (1992). Recognition of correct reading
frame by the ribosome. Biochimie, 74:357–362.
Wakeley, J. (1996). The excess of transitions among nu-
cleotide substitutions: new methods of estimating
transition bias underscore its significance. Trends in
Ecology and Evolution, 11:158–163.
Wang, J. (1998). The base contents of A, C, G, or U for
three codon positions and the total coding sequences
show positive correlation. J. Biomol. Struct. Dyn.,
16:51–57.
Wong, J. T. and Cedergren, R. (1986). Natural selection ver-
sus primitive gene structure as determinant of codon
usage. Eur. J. Biochem., 159:175–180.
Zhang, C. T. and Zhang, R. (1991). Analysis of distribution
of bases in codon in the coding sequences by a dia-
grammatic technique. Nucleic Acids Res., 19:6313–
6317.
BIOINFORMATICS2014-InternationalConferenceonBioinformaticsModels,MethodsandAlgorithms
252
