
Grammatical Evolution Association Rule Mining
to Detect Gene-Gene Interaction
Aicha Boutorh and Ahmed Guessoum
Laboratory for research in Artificial Intelligence (LRIA), University of Science and Technology Houari Boumedienne,
Algiers, Algeria
Keywords:
Association Rule Mining, Gene-Gene Interaction, Epistasis, Grammatical Evolution, SNP.
Abstract:
An important goal of human genetics is to identify DNA sequence variations that increase or decrease specific
disease susceptibility. Complex interactions among genes and environmental factors are known to play a
role in common human disease etiology. Methods for association rule mining (ARM) are highly successful;
especially that they produce rules which are easily interpretable. This has made them widely used in various
domains. During the different stages of the knowledge discovery process, several problems are faced. It turns
out that, the search characteristics of Evolutionary Algorithms make them suited to solve this kind of problems.
In this study, we introduce GEARM, a novel approach for discovering association rules using Grammatical
Evolution. We present the approach and evaluate it on simulated data that represents epistasis models. We
show that this method improves the performance of gene-gene interaction detection.
1 INTRODUCTION
One of the greatest challenges in the field of human
genetics is the identification of genetic and environ-
mental factors which cause susceptibility to common,
complex diseases. Epistasis (Moore, 2005), or gene-
gene interaction, is a well-known challenge that has
given rise to the development of different statistical
techniques. (Steen, 2011).
The biggest disadvantage of these techniques is
that, due to the complexity of the problem, they are
not well suited to detect gene-gene interaction. A key
reason for this decrease in performance of the statisti-
cal techniques in solving this problem is the high di-
mensionality of the data. This is due to either the large
number of SNPs that get generated for these problems
or the interactions that occur between more than two
polymorphisms. To overcome the limitations of tra-
ditional approaches, data mining and machine learn-
ing techniques have widely been explored (McKinney
et al., 2006) (Koo et al., 2013).
Several methods are currently available for the
analysis of gene-gene and gene-environment interac-
tions, e.g. random forests (Winham et al., 2012) , lo-
gistic regression, Multifactor Dimensionality Reduc-
tion (He et al., 2009), Support Vector Machines, Neu-
ral Networks(NN) (Koo et al., 2013) and Decision
Trees(DT).
Evolutionary Computation(EC) algorithms have
previously had success in Genetic Association Stud-
ies (GWAS) (Motsinger et al., 2007). Genetic Al-
gorithms(GA) and Genetic Programming(GP) have
been the most widely used techniques to optimize
a range of classifiers like Neural Networks, Naive
Bayes classifiers, Decision Trees, etc. As a new
EC technique, Grammatical Evolution(GE), a tech-
nique based on the definition and evolution of a
”grammar of SNPs”, has been used coupled with
other machine learning techniques to detect complex
genotype-phenotype associations.
The results produced through Grammatical Evo-
lution Neural Networks (GENN) (Holzinger et al.,
2010) has given better result than Genetic Pro-
gramming Neural Networks (GPNN) (Motsinger-Reif
et al., 2008). Moreover the analysis of Grammatical
Evolution Decision Trees (GEDT) (Motsinger-Reif
et al., 2010) has shown promising results in identi-
fying interactions on simulated data.
An important unsupervised learning technique of
data mining is the discovery of association rules in
large data sets (Creighton and Hanash, 2003). Asso-
ciation rule mining allows the discovery of interesting
relations which can be represented as rules of the form
A =⇒ B. The approach is mainly based on the Apriori
algorithm suggested by Agrawal et al (Agrawal and
Srikant, 1994). This algorithm works in two phases,
253
Boutorh A. and Guessoum A..
Grammatical Evolution Association Rule Mining to Detect Gene-Gene Interaction.
DOI: 10.5220/0004913702530258
In Proceedings of the International Conference on Bioinformatics Models, Methods and Algorithms (BIOINFORMATICS-2014), pages 253-258
ISBN: 978-989-758-012-3
Copyright
c
2014 SCITEPRESS (Science and Technology Publications, Lda.)

which makes its computational cost very high. This is
considered as serious limitation of the algorithm.
To solve this problem, various optimization tech-
niques have been used. GA and GP are the ones most
frequently used to extract association rules (Quant-
Miner (Salleb-Aouissi et al., 2007), GENAR (Mata
et al., 2001),.. ). The G3PARM (Grammar Guided
Genetic Programming) algorithm (Luna et al., 2010)
produces valid Association Rules through the use of
a context-free grammar. Despite the fact that GP (Es-
pejo et al., 2010) has been successfully used to gener-
ate ARs in different data sets, there are still limitations
to evolving ARs using this type of machine learning
algorithms. GE differs from GP in several ways. First,
GE uses linear genome like GA rather than tree struc-
tures. Second, the mapping from genotype to phe-
notype uses the rules of grammar in Backus Naur
Form (BNF). Finally all evolutionary processes do
not happen at the phenotypic level (binary expression
trees) they rather take place at the chromosomal level
(strings).
Motivated by the success of the use of GE with
NNs and DTs, and by the fact that Association Rules
(ARs) represent a promising technique for finding
hidden patterns in a large data set (Lehr et al., 2011)
we present in this work the use of GE to discover
ARs. This combination yields the technique we have
named GEARM for Grammatical Evolution Associa-
tion Rule Mining.
This paper is organized as follows. In Section 2,
we explain the details of our GEARM process. The
results are shown and discussed in Section 3. Finally,
in Section 4, a conclusion is drawn and future work is
laid out.
2 GRAMMATICAL EVOLUTION
ASSOCIATION RULE MINING
The GEARM algorithm is a proposal to obtain asso-
ciation rules independently of any domain or prob-
lem. This algorithm makes use of GE to define in-
terpretable individuals. These individuals are de-
fined through the use of a Context Free Grammar
(CFG). The technical details that explain the coupling
of Grammatical Evolution with association rules us-
ing a BNF grammar are provided. The power of the
approach is evaluated by analyzing the use of the
GEARM process with genetic datasets to solve the
problem of epistasis detection.
In order to combine GE with association rule min-
ing, we adapt the GE process to allow the automatic
generation of valid rules. To this end, a suitable BNF
description of the association rules must be generated.
This grammar must specify the antecedents and the
consequent of each rule be consistent with the data it
operates upon, and be geared towards the problem at
hand.
2.1 Grammar
A grammar is defined by a set of production rules
where each rule is of the form A =⇒ B. The right-
hand side (B) is a combination of terminals and/or
non-terminals, whereas the left hand side contains
only non-terminals. By applying the corresponding
sequence of association rules, the non-terminals are
eventually substituted by terminals, which are the fi-
nal (atomic) elements that appear in the language.
More formally, a Context-Free Grammar is de-
fined as a quadruple (S,N,T, P), where S is the start
symbol, N is the set of non-terminal symbols, T is the
set of terminal symbols, and P is the set of production
rules.
For genetic association data, the antecedents of
a rule represent genotypes at specific loci, where a
genotype can take one of three genotype values for a
bi-allelic SNP (AA, Aa, aa), encoded as 0, 1, and 2,
respectively. The set of variables and their values rep-
resent the antecedent part of the association rule. The
consequent of the rule (class variable) can take one of
two values, either positive ’1’ (for case) or negative
’0’ (for control) states. Each individual is associated
with case/control. All the elements that have a static
form meaning that they will not be substituted, are
identified as terminals. Thus a grammar for genetic
association data contains production rules of the form
A =⇒ B where A ∈ N and B ∈ {N ∩ T }.
G = {S, N, T, P}
S = {Rule}
N = {Rule, Antecedent,Consequent, SNP,VAL}
T = {SNP1, SNP2, ..., SNPn, 0, 1}
P = {< Rule >::=< Antecedent >< Consequent >
< Antecedent >::=< SNP >< VAL > | < SNP ><
VAL >< Antecedent >
< Consequent >::= 0|1
< SNP >::= SNP1|SNP2|...|SNPn
< VAL >::= 0|1|2}
Each problem solution has two distinct components:
- a genotype, represented by a string in GE,and
- a phenotype, that represents the complete rule
consisting of an antecedent and a consequent.
The following rule illustrates the general structure of
an association rule that is used in the GEARM process
If SNP1 = 2 and SNP4 = 0 then class = 1
Let us illustrate here through an example, the
mapping process from a genotype (represented as
a vector of integer values) to the phenotype (as-
BIOINFORMATICS2014-InternationalConferenceonBioinformaticsModels,MethodsandAlgorithms
254

sociation rules) using the above grammar. Con-
sider the (input) vector 25,12,17,32,75,3,7. The start
symbol < Rule > produces the two non-terminals
< Antecedent >< Consequent >. The first non-
terminal < Antecedent > has two different alterna-
tives, < SNP >< VAL > and < SNP >< VAL ><
Antecedent >. Using the first value of the input vector
and by applying the MOD operation on the number of
alternatives we obtain 25 MOD 2 = 1. The result of
the MOD operation represents the number of alter-
natives which will replace the current non-terminal.
Since the < SNP >< VAL > is numbered as alterna-
tive number 0, the non-terminal < Antecedent > will
be replaced by < SNP >< VAL >< Antecedent >
(alternative number 1 which is 25 MOD 2). The next
non-terminal is < SNP > (with 4 alternatives), the
next value in our vector is 12 and the process goes
on until no non-terminal is left. The full example is
presented in the following steps:
• < Antecedent >< Consequent >=⇒
25, 12, 17, 32, 75, 3, 7 =⇒ 25 MOD 2= 1
• < SNP >< VAL >< Antecedent ><
Consequent >=⇒ 12,17, 32, 75, 3, 7 =⇒ 12
MOD 4 =0
• SNP1< VAL >< Ant >< Consq >=⇒
17, 32, 75, 3, 7 =⇒ 17MOD3= 2
• SNP1 = 2 < Antecedent >< Consequent >=⇒
32, 75, 3, 7 =⇒ 32 MOD 2=0
• SNP1 = 2 < SNP >< VAL >< Consequent >=⇒
75, 3, 7 =⇒75 MOD 4=3
• SNP1 = 2, SNP4 < VAL >< Consequent >=⇒
3, 7 =⇒3 MOD 3=0
• SNP1 = 2, SNP4 = 0 < Consequent >=⇒ 7 =⇒7
MOD 2=1
• SNP1=2,SNP4=0,1=⇒If SNP1=2 and SNP4=0
then class=1 (case)
2.2 Evaluation
The process of evaluating each individual is per-
formed by calculating the value of the fitness function
The rule evaluation function must not only consider
the instances that are correctly classified but also the
ones left to be classified and those incorrectly classi-
fied. Thus four possible concepts relevant: True Pos-
itives (TP), False Positive (FP), True Negative (TN)
and False Negative (FN). The fitness function is de-
fined as :
F =
T P
T P + FN
∗
T N
T N + FP
(1)
Figure 1: Different steps of the GEARM process.
2.3 The GEARM Process
A detailed description of every structural block of the
GE process can be found in (O’Neill and Ryan, 2003).
The different steps of the GEARM process that we
introduce here are as follows:
• GEARM has a set of parameters that must be ini-
tialized. Once this is done, the data gets divided
into 10 equal parts for a 10-fold cross-validation.
9/10 of the data is used for training, and the re-
maining 1/10 of the data is later used to evaluate
the predictive ability of the model. (see Fig. 1)
• The training step of the GEARM process begins
by generating an initial population of N random
individuals, where each individual is represented
as a vector of integer values. The genotype-to-
phenotype mapping process uses the above gram-
mar and always begins with the Start symbol. If
the end of the genome is reached and the map-
ping process is still incomplete, then the genome
is wrapped over and the integers are read again
from the start of the vector. The wrapping pro-
cess continues T times, where T is a predefined
upper limit. If this limit is reached or if all the
non-terminals are replaced, then the mapping pro-
cess terminates.
• The resulting output string then determines the set
of N association rules where each individual in the
initial population (genotype) is mapped onto an
association rule (phenotype). Each association R
is evaluated on the training set and its fitness gets
recorded.
• The best N-rule solutions are selected for
crossover and reproduction. The crossover and
mutation operations are performed at the chromo-
somal level (the vector of integer values), not at
GrammaticalEvolutionAssociationRuleMiningtoDetectGene-GeneInteraction
255
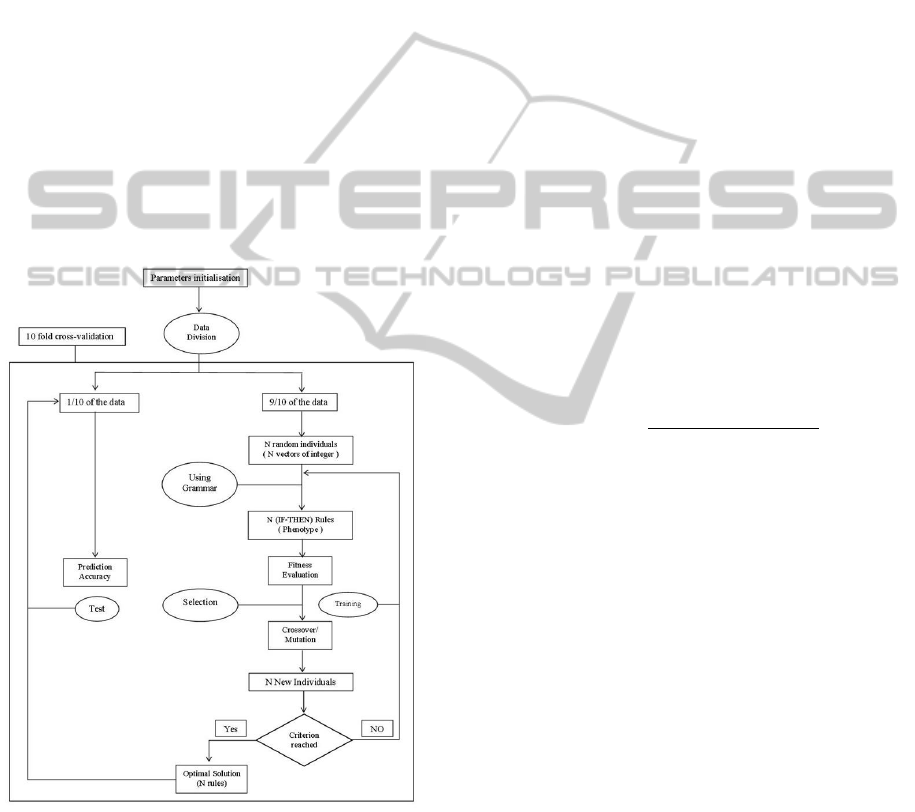
the level of the association rules. The new gener-
ation that gets generated, containing the best rules
and equal in size to the original population, is used
in the cycle time and again until some criterion is
met, after which GEARM stops. This criterion is
either a classification error of zero or a limit on
the number of generations.
• The best solution is identified after each genera-
tion. At the end of the GEARM evolution, the
overall best solution is selected as the optimal AR
set. This best GEARM set is tested on the 1/10th
of the data left out to estimate the prediction error.
• The above steps are performed 10 times using a
different 9/10th of the data for training and the
remaining 1/10th of the data for testing with the
same parameter settings, in order to obtain the
best set of association rules.
Figure 2 represents a flowchart of the GEARM
process that highlights the main operations of the pro-
posed algorithm.
Figure 2: Flowchart of the GEARM .
Each generated rule indicates a possible interac-
tion among SNPs, and the final output is a list of inter-
actions. In order to determine the variables that have
a strong influence on the epistasis, we propose two
different methods to detect the functional SNPs:
• Equal Weights. in this first method we count the
number of times each SNP is present in the set of
association rules that get generated for each 10-
fold cross validation data split while giving the
same weight to all the variables. The SNP that
exists in the ten sets of data has a signal equal to
10. The SNP that does not exist in any set of the
data has a signal of 0.
• Weight of Appearance. In this method, we count
the number of appearances of each SNP in each
split of data, and we calculate the weight of the
SNP as the number of its appearances divided by
the number of SNPs in this set of rules. At the
end, for each SNP we obtain 10 different values
of weights for each 10-fold cross validation data
split. The functional SNPs are those that have the
highest sum of weights.
3 EXPERIMENTAL STUDY
To verify the performance of the approach we present,
we have tested it on the simulated data which was
used for the GENN (Motsinger-Reif et al., 2008) and
GEDT studies (Motsinger-Reif et al., 2010). We have
used 10-fold cross-validation as explained above. The
predictive accuracy of the classifier measures the pro-
portion of correctly classified instances:
Accuracy =
T P + T N
T P + T N + FP + FN
(2)
The data sets are stored in rows, where each row rep-
resents an individual and each individual is formed
of 100 different SNPs and the class it belongs to.
Two of the SNPs are associated with the outcome.
The parameters of the algorithm were set as follows:
population size= 250 individuals (125 cases and 125
controls); generation size= 250; number of generated
rules= 150; crossover rate= 0.9; mutation rate= 0.1;
wrap count= 2; minimum chromosome size= 10 and
maximum chromosome size= 100. Three simulated
genetic models (GM) have been used(XOR, BOX,
and MOD) with different Heritability(He) and Mi-
nor Allele Frequencies(MAF). The XOR function ex-
hibits interaction effects in the absence of any main
effects. For the BOX and the MOD models, main and
interaction effects are both observed (Motsinger-Reif
et al., 2010).
Table 1 summarizes the average fitness (Avr-F)
which is obtained on the training set of 10-fold cross-
validation, and the average accuracy (Avr-A) is ob-
tained on the remaining test set (1/10th of the data)
for each model GM and that according to the differ-
ent He and MAF. The fitness function takes into con-
sideration all the instances that are correctly and in-
correctly classified, and the ones left to be classified,
BIOINFORMATICS2014-InternationalConferenceonBioinformaticsModels,MethodsandAlgorithms
256

which makes it always smaller than the accuracy that
gives an estimate of the correctly classified rules. Ex-
ecution time is given in hours. Through experimen-
tation, we can confirm that the increase in generation
size leads to an increase in predictive accuracy and
gives a better result in terms of quality of the gener-
ated rules.
Table 1: Evaluation results for simulated models.
G.M HE M.A.F Avr-F Avr-A Time
XOR 2.5 0.25 0.25 0.44 0.26
XOR 2.5 0.5 0.26 0.45 0.25
XOR 7.5 0.25 0.26 0.4 0.26
XOR 7.5 0.5 0.25 0.29 0.24
XOR 10 0.5 0.24 0.4 0.13
BOX 2.5 0.25 0.29 0.38 0.13
BOX 2.5 0.5 0.3 0.44 0.13
BOX 7.5 0.25 0.3 0.55 0.25
BOX 7.5 0.5 0.32 0.6 0.13
BOX 10 0.5 0.24 0.5 0.14
MOD 2.5 0.25 0.29 0.38 0.26
MOD 2.5 0.5 0.3 0.4 0.24
MOD 7.5 0.25 0.27 0.51 0.26
MOD 7.5 0.5 0.3 0.5 0.23
MOD 10 0.5 0.27 0.42 0.25
For our power studies, we have tested our algo-
rithm on several datasets for each genetic model and
effect size combination. We have compared our re-
sults with those obtained by the Grammatical Evo-
lution Decision Tree (GEDT) approach (Motsinger-
Reif et al., 2010). Table 2 and Table 3 present
the percentage of the power of GEARM using both
”Equal Weight” (AREW) and ”Weights of Appear-
ance” (ARWA).
Table 2: Power 1 results for simulated modess.
G.M HE MAF AREW ARWA GEDT
XOR 2.5 0.25 1 2 0
XOR 2.5 0.5 5 4 0
XOR 7.5 0.25 7 10 3
XOR 7.5 0.5 5 5 2
XOR 10 0.5 3 5 4
BOX 2.5 0.25 20 40 13
BOX 2.5 0.5 40 30 16
BOX 7.5 0.25 70 90 72
BOX 7.5 0.5 80 70 53
BOX 10 0.5 90 80 69
MOD 2.5 0.25 30 20 7
MOD 2.5 0.5 10 15 6
MOD 7.5 0.25 30 40 79
MOD 7.5 0.5 50 50 47
MOD 10 0.5 60 80 60
Table 3: Power 2 results for simulated modess.
G.M HE MAF AREW ARWA GEDT
XOR 2.5 0.25 3 4 1
XOR 2.5 0.5 5 5 2
XOR 7.5 0.25 7 10 4
XOR 7.5 0.5 10 14 6
XOR 10 0.5 10 10 7
BOX 2.5 0.25 40 50 59
BOX 2.5 0.5 60 60 69
BOX 7.5 0.25 100 96 95
BOX 7.5 0.5 90 100 93
BOX 10 0.5 90 97 95
MOD 2.5 0.25 40 50 49
MOD 2.5 0.5 10 30 2
MOD 7.5 0.25 90 70 96
MOD 7.5 0.5 60 74 65
MOD 10 0.5 67 80 48
”Power 1” (P1) is the number of times the algo-
rithm correctly identified both functional loci in the
data sets (Table 2). ”Power 2” (P2) is the number
of times the algorithm identified at least one of the
two functional loci ( Table 3). Analyzing the re-
sults, we can clearly see that (P2) is always higher
than (P1). This can be explained since (P1) is con-
sidered as a subset of (P2). We base our discus-
sion on the power of the two methods. Tables 2
and 3, show that the powers increase as the He and
the MAF increase, and this is observed for the two
techniques. For the challenged model XOR (purely
epistatic model) we can see that GEARM performs
a little better compared with GEADT even if both
have a weak power. This can be explained by the fact
that decision trees can miss rules found by associa-
tion rule mining. For example, in the case where He
= 2.5, even if GEARM has shown a weak power (be-
tween 1% and 5%), GEADT could not even detect
the two functional SNPs. The best results are seen
for the BOX model and especially with a He=7.5 for
both cases where MAF equals 0.25 and 0.5. In these
cases, GEARM generates the best set of rules with
the highest prediction accuracy in a reasonable time
(Table I). This shows that the increase in predictive
accuracy gives a better set of rules and leads to the
increase in the power of the technique.
In decision trees, the path from the root to the
leaf determines all the antecedents; the consequent is
determined by the leaf. Given a rule in the decision
tree, it is likely that an equivalent association rule ex-
ists. However, the opposite is not true: given an asso-
ciation rule, it may not be possible to find an equiva-
lent rule in the decision tree. Furthermore, the deci-
sion trees do not allow the extraction of rules from in-
ternal nodes, as the rule starts from the root to the leaf,
This leads to longer and more complex rules whereas,
GrammaticalEvolutionAssociationRuleMiningtoDetectGene-GeneInteraction
257

association rules can find all the less complex pre-
dictive rules from a data set given a proper setting
of the parameters. These results indicate that while
GEARM and GEADT can both detect gene-gene in-
teractions. GEARM can do it more efficiently and has
higher power to detect two-locus interactions under
either definition of power.
In spite of the good results GEARM has yielded,
the approach is still under study to improve its perfor-
mance. More tests will be performed with different
parameter sizes. We are also assessing an approach
for rule pruning to generate better results. As such,
we aim, on the one hand, to achieve an even better
prediction accuracy and more power in the detection
of epistasis and, on the other hand, compare our re-
sults with other successful approaches in genetic epi-
demiology for simulated and real data.
4 CONCLUSIONS
In this paper we have presented a new approach that
uses Grammatical Evolution to discover a set of asso-
ciation rules. GEARM provides an efficient mecha-
nism for the classification of individuals and the de-
tection of gene-gene interactions in the presence or
absence of main effects. It has been tested on simu-
lated data set with different models. Our proposal has
yielded a reduced set of association rules. Also, with
this small association rule set, we have managed to
cover all the SNPs in the dataset.
In spite of the good results we have obtained,
the approach is still under study and our work is
in progress to improve its performance. We aim to
achieve more power in the detection of epistasis, ap-
ply it on real data and compare the results it yields
with other successful approaches in genetic epidemi-
ology. We expect that GEARM can do so more effi-
ciently than other techniques. We thus see GEARM
as a promising new approach for human genetics.
REFERENCES
Agrawal, R. and Srikant, R. (1994). Fast algorithms for
mining association rules in large databases. 20th Inter-
national Conference on Very Large Data Bases, Santi-
ago, Chile.Morgan Kaufmann ISBN 1-55860-153-8.
Creighton, C. and Hanash, S. (2003). Mining gene expres-
sion databases for association rules. Bioinformatics
19(1): 79-86.
Espejo, P., Ventura, S., and Herrera, F. (2010). A survey
on the application of genetic programming to classi-
fication. IEEE Transactions on Systems, Man, and
Cybernetics, vol. 40, no. 2, pp. 121-144.
He, H., Oetting, W., Brott, M., and Basu, S. (2009). Power
of multifactor dimensionality reduction and penalized
logistic regression for detecting gene-gene interaction
in a case-control study. BMC Med Genet, 10:127.
Holzinger, E., Buchanan, C., Dudek, S., Torstenson, E.,
Turner, S., and Ritchie, M. (2010). Initialization pa-
rameter sweep in athena: Optimizing neural networks
for detecting gene interactions in the presence of small
main effects. Genetic and Evolutionary Computation
Conference, 12:203-210.
Koo, C., Liew, M., Mohamad, M., and Salleh, A. (2013).
A review for detecting gene-gene interactions using
machine learning methods in genetic epidemiology.
BioMed Research International, Article ID 432375,
13 pages, 2013. doi:10.1155/2013/432375.
Lehr, T., Yuan, J., Zeumer, D., Jayadev, S., and Ritchie, M.
(2011). Rule-based classifier for the analysis of gene-
gene and gene-environment interactions in genetic as-
sociation studies. Bio Data Mining, 4:4 .
Luna, J., Romero, J., and S., S. V. (2010). A gram-
mar guided genetic programming algorithm for min-
ing association rules. IEEE Congresso in Evolutionary
Computation (CEC). pp. 1-8.
Mata, J., Alvarez, J., and Riquelme, J. (2001). Mining nu-
meric association rules via evolutionary algorithms.
the 5th International Conference on Artificial Neural
Networks and Genetic Algorithms, Prague, Czech Re-
public, pp. 264-267.
McKinney, B., Reif, D., Ritchie, M., and Moore, J. (2006).
Machine learning for detecting gene-gene interac-
tions: a review. Appl. Bioinformatics, 5, 7788.
Moore, J. H. (2005). A global view of epistasis. Nat Genet.
37(1):13-4.
Motsinger, A., Ritchie, M., and Reif, D. (2007). Novel
methods for detecting epistasis in pharmacogenomics
studies. Pharmacogenomics, 8:1229-1241.
Motsinger-Reif, A., Deohdar, S., Winham, S., and Hardi-
son, N. (2010). Grammatical evolution decision trees
for detecting gene-gene interactions. BMC Bio Data
Mining.
Motsinger-Reif, A., Dudek, S., Hahn, L., and Ritchie,
M. (2008). Comparison of approaches for machine-
learning optimization of neural networks for detecting
gene-gene interaction in genetic epidemiology. Ge-
netic Epidemiol, 32:325-340.
O’Neill, M. and Ryan, C. (2003). Grammatical evolution:
Evolutionary automatic programming in an arbitrary
language. Boston: Kluwer Academic Publishers.
Salleb-Aouissi, A., Vrain, C., and Nortet, C. (2007). Quant-
miner: A genetic algorithm for mining quantitative as-
sociation rules. the 20th International Joint Confer-
ence on Artificial Intelligence, Hyberadad, India.
Steen, K. V. (2011). Travelling the world of gene-gene in-
teractions. Brief Bioinform 1-19.
Winham, S., Colby, C., Freimuth, R., Wang, X., de An-
drade, M., and Biernacka, J. (2012). Snp interaction
detection with random forests in high-dimensional
genetic data. BMC Bioinformatics, 13:164. doi:
10.1186/1471-2105-13-164.
BIOINFORMATICS2014-InternationalConferenceonBioinformaticsModels,MethodsandAlgorithms
258
