
Rational Identification of Prognostic Markers of Breast Cancer
Maysson Al-Haj Ibrahim
1,2
, Joanne L Selway
2
, Kian Chin
3
, Sabah Jassim
1
,
Michael A. Cawthorne
2
and Kenneth Langlands
2
1
Department of Applied Computing, Buckingham University, Buckingham, U.K.
2
Buckingham Institute for Translational Medicine, Buckingham University, Buckingham, U.K.
3
Department of Surgery, Milton Keynes Hospital NHS Foundation Trust, Milton Keynes, U.K.
Keywords: Disease Classification, Breast Cancer, Prognosis, Biomarkers, Metabolic Networks and Pathways, Gene
Regulatory Networks, Microarray Analysis.
Abstract: Accurate prognostication is central to the management of breast cancer, and traditional clinical and
histochemical-based assessments are increasingly augmented by genetic tests. In particular, the use of
microarray data has allowed the creation of molecular disease signatures for the early identification of
individuals at elevated risk of relapse. However, tailoring therapy on the basis of a molecular assay is only
recommended in certain cases, and the identification of a minimal set of genes whose expression allows
informed decision-making in a broader spectrum of disease remains challenging. Finding an optimal
solution is, however, an intractable computational task (i.e. retrieving the smallest group of genes with the
greatest prognostic power). Our solution was to reduce the genetic search-space by using two filtering steps
that enriched by biological function those genes whose expression discriminated disease states. In this way,
we were able to identify a new molecular signature, the expression characteristics of which facilitated the
classification of intermediate risk disease. We went on to create a statistical test that confirmed the
relevance of our approach by comparing the performance of our signature to that of 1000 random
signatures.
1 INTRODUCTION
Assessment of a number of clinical features is made
at presentation in order to identify women at
elevated risk of an aggressive disease course, and so
inform disease management. These include estrogen
receptor (ER) status, size of the primary lesion and
lymph node involvement. Adjuvant hormone
therapy is very effective in preventing recurrence of
disease, but side effects are such that sparing
individuals at low risk of relapse from intensive
therapy has significant quality of life implications.
However, there is a considerable margin of error,
and as many as 80% of women may be over-treated
and improving outcomes by identifying a more
informative list of biomarkers remains a challenging
task (Van’t Veer et al., 2002). Genome-wide
transcriptional profiling methods (such as
microarrays) provide a snap-shot of gene activity in
a cell, and by correlating patterns of gene expression
in the primary lesion with outcomes, a number of
investigators have sought to identify molecular
signatures characteristic of different tumour sub-
types (Wesolowski, 2011).
Diagnostic tests informed by molecular
signatures of high risk disease are available for use
in clinical practice, and recently use of the Oncotype
DX Breast Cancer assay (Paik et al., 2004) was
approved by the UK’s National Institute for Clinical
Excellence (NICE) for use in the management of a
sub-group of patients with an intermediate risk of
tumour recurrence (guidance.nice.org.uk/DT/4).
Specifically, inclusion criteria are a Nottingham
Prognostic Index (NPI)>3.4 (calculated from
primary lesion size, lymph node involvement and
tumour grade (Galea et al., 1992)), ER positivity,
and negativity for both lymph node involvement and
HER2 status.
We feel that there is value in investigating means
to identify a prognostic fingerprint of wider
applicability. From a computational perspective,
biomarker discovery can be modelled as a feature
265
Al-Haj Ibrahim M., L Selway J., Chin K., Jassim S., A. Cawthorne M. and Langlands K..
Rational Identification of Prognostic Markers of Breast Cancer.
DOI: 10.5220/0004915202650270
In Proceedings of the International Conference on Bioinformatics Models, Methods and Algorithms (BIOINFORMATICS-2014), pages 265-270
ISBN: 978-989-758-012-3
Copyright
c
2014 SCITEPRESS (Science and Technology Publications, Lda.)
selection problem that aims to classify disease into
high and low risk groups according to the expression
characteristics of a minimal set of discriminating
genes assayed at presentation. However, most
traditional feature selection methods, such as gene-
based techniques that use fold-change, t-test or
relative entropy criteria, or group-based methods
(including sequential forward/ backward selection),
tend to ignore the rich biological data created by
gene expression studies. Functional enrichment (i.e.
the selection of genes with a known disease
association) rather than simple statistical filtering
methods have been used to inform cancer
stratification. (Guo et al., 2005; Khunlertgit and
Yoon, 2013; Wang and Chen, 2011) made use of
knowledge curated in biological pathway databases
(particularly the Kyoto Encyclopedia of Genes and
Genomes, KEGG; www.genome.jp/kegg) or a
structured biological language (notably gene
ontologies described by the GO consortium;
www.geneontology.org) to reduce the
dimensionality of the genetic search space and
increase the biological relevance of potential
biomarkers identified. Previously, we described an
enhancement to this pipeline, in which an initial step
to identify pathways perturbed in a disease state was
followed by a round of gene network analysis to
further enrich for genes whose expression correlated
with disease outcome (Ibrahim et al., 2012). We
found that this improved disease stratification in a
series of publicly-available retrospective datasets.
However, other work has cautioned that great
care must be taken when data from prognostic
signatures are used in clinical decision-making
(Venet et al., 2011). Therefore, we sought to test the
performance of a signature created using our
approach to other biomarker selection methods, and
to the prognostic power of the genes constituting
Oncotype DX in a population of intermediate risk
disease for whom additional prognostic information
is particularly valuable (specifically ER positive,
lymph node negative disease). Moreover, we went
on to confirm the informative power of our signature
relative to those of random signatures.
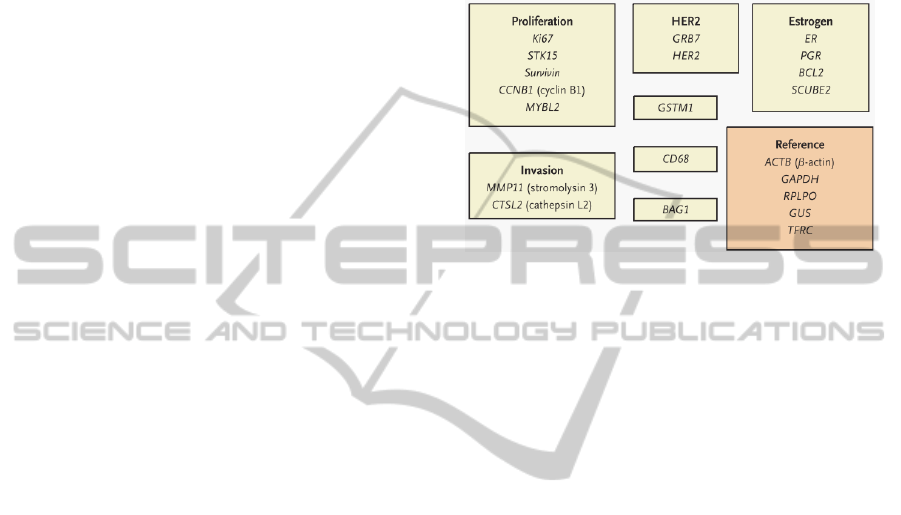
2 ONCOTYPE DX BREAST
CANCER GENE SET
Oncotype DX is an RT-PCR based assay that
measures the expression of 16 cancer-associated
genes (as well as a panel of five internal controls) in
a sample of RNA prepared from a primary tumour
biopsy, returning a Recurrence Score ranging from 0
(low risk) to 100 (high risk; (Paik et al., 2004). The
constituent genes are grouped by function (Figure
1), and were selected using a rational heuristic. We
used the expression profiles of these genes in the
various datasets to estimate the prognostic power of
Oncotype DX.
Figure 1: Constituent genes of the Oncotype DX breast
cancer assay (adapted from Paik et al., 2004).
3 UNSUPERVISED BIOMARKER
SELECTION
3.1 Datasets
Van Vliet et al, (Van Vliet et al., 2008) described a
group of primary breast cancer microarray datasets
that were all created using an Affymetrix U133A
array platform, useful in the systematic interrogation
of genetic information for prognostic insights. These
data are freely available from the Gene Expression
Omnibus (GEO, www.ncbi.nlm.nih.gov/geo/), with
accessions GSE7390 (Desmedt et al., 2007) and
GSE2990 (Loi et al., 2007), and from Array Express
(www.ebi.ac.uk/arrayexpress) with the accession E-
TABM-158 (Chin et al., 2006). Relevant patient data
(including tumour size and time of follow up) are
also available from these sources. Gene expression
data were normalised across all datasets using
Relative Log Expression (RLE) and the Normalized
Unscaled Standard Errors (NUSE) methods. In total,
we were able to identify 154 samples from
individuals who received no adjuvant therapy.
Samples were split in to two classes according to
disease outcome: class 1 (disease recurrence, 71
samples in total) and class 2 (no recurrence, 83
samples in total). Transcripts were included in
biological enrichment analysis if they were
differentially expressed between classes according to
the following criteria: fold change>=1.5 and p-
BIOINFORMATICS2014-InternationalConferenceonBioinformaticsModels,MethodsandAlgorithms
266

value<0.05 (by t-test). We used median rather than
mean expression values to mitigate the contribution
of outliers.
3.2 Biomarker Selection
i. Data from individual microarrays were randomly
split into training and testing sets, each set with
an equal representation of disease subtypes.
Specifically, the training set contained 78
samples (of which 42 had disease recurrence and
36 had no recurrence) and the testing set
contained 76 samples (of which 41 had disease
recurrence and 35 had no recurrence).
ii. Expression data from training sets were
subjected to enrichment using pathways
imported from the open-access KEGG database
(www.genome.jp/kegg/). Over-representation of
members of any of the 108 signalling pathways
maintained in KEGG were determined by z-score
as previously described (Ibrahim et al., 2012).
Ranking pathways by descending score readily
allowed identification of those most impacted
with disease state.
iii. A gene list p was created from members of k
high-scoring pathways whose expression could
be detected on the arrays (but may not
necessarily have showed a change in expression
between disease states). We evaluated the
performance of signatures derived from
increasing values of k.
iv. At this stage, two methods were evaluated.
To model existing pathway enrichment methods,
genes were ranked by fold change, and the
classification accuracy of increasing numbers of
genes investigated according to stage vi). We
termed this method PE_DEGs (for Pathway
Enrichment and Differentially Expressed Genes).
Alternatively, we proceeded to step v) in order to
evaluate an improvement in performance
resulting from an additional biological
enrichment step. We termed this second method
PEGNA for Pathway Enrichment and Gene
Network Analysis.
v. The gene list p was fed in to the GXNA
network analysis tool (Nacu et al., 2007), to
generate a user-specified number of networks.
Constituent genes from networks of increasing
size and number were passed to the next stage.
vi. A minimal biomarker set was identified by
calculating classification accuracies using
increasing numbers of genes from the filtered
group, starting with five genes. The ability of the
signature to separate high and low risk groups
was evaluated on the testing dataset using a
Support Vector Machine (SVM) classifier
(Cortes and Vapnik, 1995) and a K-fold cross-
validation testing strategy (Efron and Tibshirani,
1995). If the GXNA enrichment step was used,
this step was repeated for different sizes of gene
network to identify the network that yielded the
most informative genes.
All analysis was implemented in MATLAB 7.9.0
(Mathworks, Cambridge, UK).
4 RESULTS
4.1 Prognostic Signature Identification
We created a list of the top 10 KEGG pathways
impacted when samples from relapsing and non-
relapsing individuals in the training set were
compared (Table 1). All genes constituting these
pathways were then fed into GXNA if they were
expressed on the arrays, irrespective of any change
with disease subtype.
Table 1: Top ten KEGG pathways impacted in relapsing
breast cancer ranked by z-score.
Pathway z-score
1
Dorso-ventral axis formation 3.31
2
Calcium signaling pathway 2.82
3
Bladder cancer 2.03
4
Chemokine signaling pathway 1.55
5
Endocytosis 1.51
6
Cardiac muscle contraction 1.46
7
Bacterial invasion of epithelial cells 1.46
8
Focal adhesion 1.38
9
Regulation of actin cytoskeleton 1.34
10
VEGF signaling pathway 1.33
The testing set was used to build the SVM
classifier and to evaluate the performance of the
signature. Seventy-five of the 76 testing samples
were used to train the SVM classifier, which was
then tested on the remaining sample. This step was
repeated 76 times, with a different sample used each
time to test the classifier.
The accuracy achieved when the trained
classifier was used to separate samples into high-
and low-risk groups based on gene expression
profiles is shown in Figure 2. While the use of 20
and 24 genes isolated from the top 10 pathways gave
the same accuracy (73.7%), we selected latter group
due to the high sensitivity achieved by this group
RationalIdentificationofPrognosticMarkersofBreastCancer
267
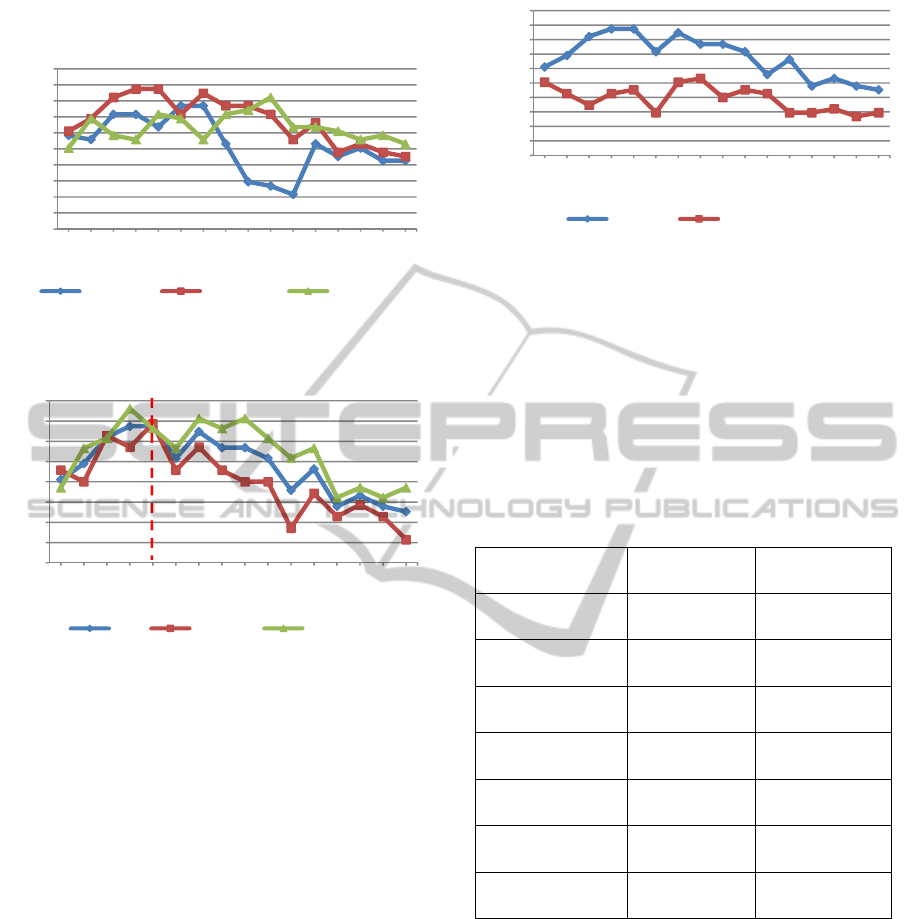
(74.3%) compared to the 20 gene signature (68.6%,
Figure 3).
Figure 2: Evaluation of increasing gene numbers selected
from the 5, 10 and 20 highest scoring KEGG pathways.
Figure 3: Accuracy (ACC), sensitivity and specificity
achieved with increasing numbers of genes derived from
the 10 highest scoring KEGG pathways.
A comparison between PEGNA and PE_DEGs
confirmed the effectiveness of combining biological
enrichment methods in obtaining a more informative
signature (Figure 4). PEGNA achieved a maximum
accuracy of 73.7% with just 24 genes, whereas
PE_DEGs achieved a maximum 56.6%, and this
required 40 genes. A single round of GXNA
enrichment alone (with no prior pathway
enrichment) did not match the performance of the
combined method, possibly as this technique tends
to find sub-optimal solutions on larger datasets (data
not shown).
4.2 Performance
While accuracy is a useful headline indicator of the
ability of a classifier to identify those at risk of
relapse, more meaningful measures include
sensitivity (individuals with recurrent disease that is
accurately predicted by the signature) and specificity
(accurate prediction of individuals in which disease
won’t reoccur). Another useful measure is an
Figure 4: Accuracy rates achieved by PE_DEGs and
PEGNA with increasing numbers of genes from the top 10
scoring pathways.
indication of the number of patients who would have
been over- or under-treated, had therapeutic regimes
been tailored to a predicted disease course. Results
of this analysis are shown in Table 2.
Table 2: A comparison of the performance of a novel 24
gene PEGNA-derived signature with the 16 genes
constituting Oncotype DX in classifying a retrospective
untreated group of ER+, LN- breast cancer.
Oncotype DX PEGNA
Accuracy 59% 73.7%
Sensitivity 48.6% 74%
Specificity 68% 73%
True positives 17 26
False positives
(over-treated)
13 11
True negatives 28 30
False negative
(Under-treated)
18 9
4.3 Statistical Evaluation of Prognostic
Signature Performance
To evaluate the statistical significance of the
accuracy of the genes constituting the Oncotype DX
panel and those identified by PEGNA, we
determined the probability of achieving similar or
higher classification accuracies by chance. A group
of 24 genes was randomly selected from the list of
all expressed microarray genes (of which there were
14368 in total) from the microarray dataset used to
define the original signature. This random signature
was then used to classify the testing samples and an
30
35
40
45
50
55
60
65
70
75
80
5 101520253035404550556065707580
Accuracy (%)
Gene number
5 pathways 10 pathways 20 pathways
68.6
74.3
40
45
50
55
60
65
70
75
80
5 101520253035404550556065707580
Rate (%)
Gene number
ACC sensitivity specificity
30
35
40
45
50
55
60
65
70
75
80
5 101520253035404550556065707580
Accuracy (%)
Gene number
PEGNA PE_DEGs
BIOINFORMATICS2014-InternationalConferenceonBioinformaticsModels,MethodsandAlgorithms
268

accuracy value was determined. This process was
repeated 1000 times, each with a distinct random
signature from which probability was estimated in
two different ways.
Firstly, the number of random signatures that
were at least as accurate as our bespoke signature
was calculated. We found that only two random
signatures out of the 1000 performed as well as our
signature. A p-value for the accuracy of our
signature (ACC
PEGNA
) was then calculated using
Equation 1, and found to be 0.002 (i.e. 2/1000). In
the same way, the p-value associated with the
accuracy achieved by the genes constituting the
Oncotype DX signature was calculated to be 0.126
(i.e. 126/1000).
1
()
()
n
R
and PEGNA
j
PEGNA
IACC ACC
PACC
n
(1)
Where I(X) is the identity function that returns 1
if X is true and 0 if false, and P(ACC
PEGNA
) is the
probability of achieving the accuracy of PEGNA
signature by chance.
Secondly, we modelled the classification
accuracy distribution of the random signatures
according to the standard normal distribution. Figure
5 confirms that the histogram of the 1000
classification accuracies achieved by the random
signatures is normally distributed. By calculating the
mean and the standard deviation of classification
accuracies, one can work out a z-score for the
accuracy of the PEGNA-derived signature using the
formula given by Equation 2. By using the standard
normal distribution table, a p-value for an ACC
PEGNA
value of 73.7% was estimated to be 0.0024. In
contrast, the p-value associated with achieving an
accuracy value of 59% using the Oncotype DX
signature by chance was 0.117 using the same
method.
P
EGNA mean
PEGNA
ACC ACC
Z
ACC
(2)
Where ACC
mean
and ACC
σ
are the mean and the
standard deviation of the accuracy distribution of the
random signatures.
5 CONCLUSIONS
The increasingly multidisciplinary management of
breast cancer has led to a significant improvement in
survival outcomes. One reason for this
improvement is the use of research into improved
prognostication and prediction of treatment
response. For example, the advent of microarray
Figure 5: Distribution of accuracy values achieved by
1000 random 24 gene signatures. Performance of both
Oncotype DX and PEGNA-derived signatures are
indicated.
technology has led to the identification of specific
molecular signatures that have enhanced the
accuracy of traditional tumour prognostic factors, for
example lymph node status. However, despite these
improvements, there remains a degree of uncertainty
in tailoring adjuvant treatment to patients in certain
prognostic groups. For example, the Intermediate
Risk of Recurrence patient category (based on the
calculated NPI and Oncotype DX analysis) is a
difficult group for which to plan treatment. While
we tested our algorithm on a broad selection of ER+,
lymph node negative disease, we also attempted to
evaluate the performance of molecular signatures on
a sub group of disease meeting the NICE guidelines
of NPI>3.4 and HER2 negativity, but the number of
samples that met these criteria represented only a
very small subgroup of intermediate risk disease. It
is also important to note that we did not use the
Oncotype DX assay per se, rather we trained our
classier to discriminate between disease groups
based on the expression of its constituent genes
identified in a larger microarray dataset, which will
most likely have implications for performance.
The experiments presented in this paper provide
a proof-of-concept for the potential clinical utility of
genetic signatures derived from computational
methods, and we feel that our approach will enhance
prognostic and predictive value. We intend to
validate our results by conducting further studies on
the correlation between tumour gene expression
characteristics and patient outcomes in a clinical
setting.
ACKNOWLEDGEMENTS
We are grateful to Professor Karol Sikora for helpful
comments on the manuscript.
0
10
20
30
40
50
60
70
80
17,11
22,37
26,32
30,26
32,89
35,53
38,16
40,79
43,42
46,05
48,68
51,32
53,95
56,58
59,21
61,84
64,47
67,11
69,74
72,37
77,63
Frequency
Accuracy rate (%)
OncotypeDX PEGNA
RationalIdentificationofPrognosticMarkersofBreastCancer
269

REFERENCES
Chin, K., DeVries, S., Fridlyand, J., Spellman, P.T.,
Roydasgupta, R., Kuo, W.-L., Lapuk, A., Neve, R.M.,
Qian, Z., Ryder, T., Chen, F., Feiler, H., Tokuyasu, T.,
Kingsley, C., Dairkee, S., Meng, Z., Chew, K., Pinkel,
D., Jain, A., Ljung, B. M., Esserman, L., Albertson, D.
G., Waldman, F. M., Gray, J. W., 2006. Genomic and
transcriptional aberrations linked to breast cancer
pathophysiologies. Cancer Cell 10, 529–541.
Cortes, C., Vapnik, V., 1995. Support-vector networks.
Machine learning 20, 273–297.
Desmedt, C., Piette, F., Loi, S., Wang, Y., Lallemand, F.,
Haibe-Kains, B., Viale, G., Delorenzi, M., Zhang, Y.,
D’ Assignies, M. S., Bergh, J., Lidereau, R., Ellis, P.,
Harris, A. L., Klijn, J. G. M., Foekens, J. A., Cardoso,
F., Piccart, M. J., Buyse, M., Sotiriou, C., On behalf of
the TRANSBIG Consortium, 2007. Strong time
dependence of the 76-gene prognostic signature for
node-negative breast cancer patients in the
TRANSBIG multicenter independent validation series.
Clinical Cancer Research 13, 3207–3214.
Efron, B., Tibshirani, R., 1995. Cross-validation and the
bootstrap: Estimating the error rate of a prediction
rule. Division of Biostatistics.
Galea, M. H., Balmey, R. W., Elston, C. E., Ellis, I. O.,
1992. The Nottingham Prognostic Index in primary
breast cancer. Breast cancer research and treatment
22, 207–219.
Guo, Z., Zhang, T., Li, X., Wang, Q., Xu, J., Yu, H., Zhu,
J., Wang, H., Wang, C., Topol, E., others, 2005.
Towards precise classification of cancers based on
robust gene functional expression profiles. BMC
Bioinformatics 6, 58.
Ibrahim, M., Jassim, S., Cawthorne, M.A., Langlands, K.,
2012. Integrating pathway enrichment and gene
network analysis provides accurate disease
classification. The International Conference on
Bioinformatics Models, Methods and Algorithms. 156–
163.
Khunlertgit, N., Yoon, B.-J., 2013. Identification of robust
pathway markers for cancer through rank-based
pathway activity inference. Advances in
Bioinformatics 2013, 1–8.
Loi, S., Haibe-Kains, B., Desmedt, C., Lallemand, F.,
Tutt, A. M., Gillet, C., Ellis, P., Harris, A., Bergh, J.,
Foekens, J. A., Klijn, J. G. M., Larsimont, D., Buyse,
M., Bontempi, G., Delorenzi, M., Piccart, M. J.,
Sotiriou, C., 2007. Definition of clinically distinct
molecular subtypes in estrogen receptor-positive
breast carcinomas through genomic grade. Journal of
Clinical Oncology 25, 1239–1246.
Nacu, Ş., Critchley-Thorne, R., Lee, P., Holmes, S., 2007.
Gene expression network analysis and applications to
immunology. Bioinformatics 23, 850–858.
Paik, S., Shak, S., Tang, G., Kim, C., Baker, J., Cronin,
M., Baehner, F. L., Walker, M. G., Watson, D., Park,
T., 2004. A multigene assay to predict recurrence of
tamoxifen-treated, node-negative breast cancer. New
England Journal of Medicine 351, 2817–2826.
Van Vliet, M. H., Reyal, F., Horlings, H. M., Van de
Vijver, M. J., Reinders, M. J., Wessels, L. F., 2008.
Pooling breast cancer datasets has a synergetic effect
on classification performance and improves signature
stability. BMC Genomics 9, 375.
Van’t Veer, L. J., Dai, H., Van De Vijver, M. J., He, Y.
D., Hart, A. A. M., Mao, M., Peterse, H. L., Van Der
Kooy, K., Marton, M. J., Witteveen, A. T., others,
2002. Gene expression profiling predicts clinical
outcome of breast cancer. Nature 415, 530–536.
Venet, D., Dumont, J. E., Detours, V., 2011. Most random
gene expression signatures are significantly associated
with breast cancer outcome. PLoS Computational
Biology 7, e1002240.
Wang, Y. C., Chen, B. S., 2011. A network-based
biomarker approach for molecular investigation and
diagnosis of lung cancer. BMC medical genomics 4, 2.
Wesolowski, R., 2011. Gene expression profiling:
changing face of breast cancer classification and
management. Gene expression 15, 105–115.
BIOINFORMATICS2014-InternationalConferenceonBioinformaticsModels,MethodsandAlgorithms
270
