
Weather Effect on Apparel Sales in France
Jean-Louis Bertrand and Xavier Brusset
ESSCA School of Management, Angers, France
Keywords:
Supply Chain Management, Weather Risk Management, Apparel Distribution, Statistical Model.
Abstract:
In 2012, French apparel industry suffered weak sales for the fifth consecutive year. Even if economic condi-
tions were not favorable, trade professionals feel that the weather played a significant role. Its impact on retail
sales in general has not been formally quantified. This has become an urgent issue as climate change is ag-
gravating naturally occurring climate variability and is becoming a source of uncertainty for climate-sensitive
economic sectors. In this paper we provide managers with tools to evaluate the impact of temperature anoma-
lies on sales volumes. We present a statistical method to separate out the weather effect from the underlying
real performance of apparel sales. The model has been developed for the retail economic sector but can be
extended to all fast moving consumer goods both in France and abroad. These models are applicable to supply
chain managers and business analysts.
1 INTRODUCTION
Weather is a powerful force affecting the economy.
Abnormal weather conditions can shift the timing of
purchases or result in a total loss of demand. Weather
is a risk factor for business and government. Retailers
often talk about how adverse weather impacts their
sales and/or earnings. Witness, for example, the July
6, 2005, statement on second-quarter earnings by Pe-
ter Harris, CEO of West Marine, who said of his com-
panys sales: “As one would expect, continuing poor
weather in April and May on both coasts dampened
second quarter sales, especially when compared to the
great spring weather we enjoyed last year”. In the fol-
lowing, we present both a method for computing the
impact of the weather on economic activity and an il-
lustration using the retail sales in the apparel industry
in France as recorded by the Institut Franc¸ais de la
Mode (IFM).
2 LITERATURE REVIEW
The impact of weather on economic activity has been
acknowledged as being large in most economic sec-
tors in all countries (Howarth and Hoffman, 1984; El-
lithorpe and Putnam, 2000). In some industries such
as agriculture and energy, weather is such a risk factor
that it is tracked, documented and hedged through risk
management instruments (Roll, 1984; Lee and Oren,
2009).
Although the impact of the weather on behavior
has been explored in fields such as finance, energy
consumption and psychology, it has been largely ig-
nored in the marketing literature. (Stoltman et al.,
1999) used weather conditions as one of six fac-
tors that affect behavioral reactions while shopping
for clothes. (Conlin et al., 2007) found evidence
of weather-related projection bias of catalogue sales.
However, there is now more than anecdotal evidence
that firms try to incorporate weather variables into
their sales forecasting models. For example, Wal-
Mart lowered its June 2006 sales forecasts due to un-
usually cool summer weather (Murray et al., 2010).
The impact of the weather on retail sales has been
recognized now for a long time (Steele, 1951). It
has been studied with varying conclusions. (Linden,
1959) studied the effects on New York City depart-
ment stores of rain, sunshine, temperature and snow
on the ground during business hours, finding few sys-
tematic effects. (Swinyard, 1993; Babin and Dar-
den, 1996; Groenland and Schoormans, 1994) fo-
cused on the link between consumer mood, behavior
and weather. To mitigate the effects of the weather on
sales in fashion retail, (Caliskan Demirag, 2013) stud-
ied the effectiveness of weather-conditional rebates
applied by numerous retail and manufacturing orga-
nizations to promote a variety of products from toys
to health and beauty items with cash values incentives
when weather conditions are unfavorable.
277
Bertrand J. and Brusset X..
Weather Effect on Apparel Sales in France.
DOI: 10.5220/0004918802770281
In Proceedings of the 3rd International Conference on Operations Research and Enterprise Systems (ICORES-2014), pages 277-281
ISBN: 978-989-758-017-8
Copyright
c
2014 SCITEPRESS (Science and Technology Publications, Lda.)

In the particular sector of garment and apparel dis-
tribution, (Bahng and Kincade, 2012) provide strong
evidence that fluctuation in temperature can impact
sales of seasonal garments on a daily basis. However,
no evidence has been found to substantiate an impact
on sales of a whole season. (Rowley, 1999) prove
what retailers had long suspected, ie, that precipita-
tion affected substantially actual clothing purchases.
The classic example can be found in the northern
hemisphere: the placement of Easter in the calendar
affects seasonal retail sales pattern depending upon
whether it is in early March or late April. Generaliz-
ing, (Starr-McCluer, 2000) estimated that the effect of
weather on retail sales in the United States has a small
but statistically significant role in explaining monthly
retail sales.
3 DATA AND METHODS
3.1 Data
The analysis of this relationship relies on choosing
the most representative set of economic output, rele-
vant weather data, and appropriate quantitative tech-
niques. The objective is to prove the existence of a
statistically significant relationship and establish the
weather-sensitivity relationship in the case of textile
and clothing.
3.1.1 Defining Weather Sensitivity
Weather exposure is the amount of revenues or costs
at risk, which results from changes in weather con-
ditions (Brockett et al., 2005). Many businesses ex-
perience some form of seasonal pattern in their activ-
ity. For example, electricity consumption is higher in
winter than in summer, ice cream sales are stronger
in summer than in winter, and so on. Business man-
agers can execute their plans as long as the weather
patterns remain typical. Potential gains or losses arise
when weather conditions unexpectedly deviate from
their normal values. Meteorologists refer to these
deviations as weather anomalies. Because they are
unexpected, weather anomalies, or weather surprises
(Roll, 1984), can potentially change the economic
performance of a firm or a sector. Normal weather
conditions are calculated as the average weather over
30 years (Baede, 2001; Dischel, 2002).
The average weather is the climate. Climate vari-
ability is the extent to which actual weather differs
from this climate. Climate variability causes potential
disruption in economic conditions (Dischel, 2002).
How much less will the ice-cream producer sell if
the temperature is cooler than normal? How much
more will the motorway operator spend to clear roads
if snowfall is higher than in a typical winter? An
economic sector is considered to be weather sensi-
tive if weather anomalies can explain a percentage of
the performance of the sector. In other words, a sec-
tor is weather sensitive if it is possible to establish a
statistically significant relationship between weather
anomalies and change in revenues: The stronger the
relationship, the higher the sensitivity to weather.
3.1.2 Time Series from the Institut Franc¸ais de
la Mode
The first weather-sensitivity research papers focused
on U.S. economic output. Gross Domestic Product
(GDP) or gross state product data for the 11 non-
governmental sectors were used as a measure of eco-
nomic activity principally because time-series were
sufficiently long to apply statistical analysis (Dutton,
2002; Larsen, 2006; Lazo et al., 2011).
Similarly, one important data source which could
have been used are monthly turnover indices pub-
lished by the French National Bureau of Statistics
(INSEE). These indices aggregate turnover figures of
firms falling within the scope of value-added tax pay-
ment. They are available at the most detailed level of
the European classification of activities. More impor-
tant, turnover indices are volume-based, which make
them particularly relevant as a base for testing the im-
pact of weather anomalies, as weather risk is a volume
risk (Brockett et al., 2005; Barrieu, 2003; Dischel,
2002). Though data starts in January 1995, only two
sectors could have been used for our analysis (tex-
tile retail sales in specialized stores and retail sale via
stalls and markets of textiles, clothing and footwear).
Moreover, the level of detail is insufficient.
We used data provided by IFM, the French Insti-
tute of Fashion. Researchers from the Economic Ob-
servatory of IFM have been gathering sales figures
in volume from a panel of thousands of textile and
clothing retailers across France since January 2000.
Panel members range from independent multi-brand
clothing stores to specialized single brand chain stores
and department stores. Data is available by garment
type for women, men and children. Sales figures are
compiled and analyzed by IFM in a survey (Distribi-
lan) to highlight major trends and changes by product
category and distribution channel year on year on a
monthly basis (see table 1).
ICORES2014-InternationalConferenceonOperationsResearchandEnterpriseSystems
278

Table 1: Apparel categories and distribution channels as used by the Institut Franc¸ais de la Mode.
Category Product Distribution Channels
Ready-To-Wear Independent Stores
Women Small Garments Department Stores
Underwear Mass Merchant, Factory Outlets
Ready-To-Wear Online
Men Small Garments Hypermarkets
Underwear Large Distribution Chains
Children Children’s Clothes Specialty Chain Stores
Haberdashery - Knitting Wool Multi-Brand Independent Stores
Other Fabric By Meter
Household Linen
3.1.3 Weather Data
The choice of weather variables is a key step of the
process. IFM sales figures are produced at national
level, whereas weather is a local risk. On a given
day at a given time, weather conditions are different
in Paris, in Brest in western France, and in Marseille
in southern France (Barrieu, 2003). IFM indices add
revenues from all regions at a national level. There-
fore, weather variables must be constructed in such a
way that they not only are a valid representation of
national weather conditions but also can capture po-
tential weather signals at a national level. In 2002,
M
´
et
´
eo France and Powernext developed a range of
national temperature indices (NextWeather), initially
aimed at the financial community to serve as a base
for derivative instruments. They constructed the tem-
perature index to fit the geographical distribution of
economic activity. M
´
et
´
eo France selected 22 rep-
resentative weather stations (figure 1) and weighted
daily data from each station by the population in
each region to construct national temperature indices
(Bertrand, 2010).
We applied the methodology developed by M
´
et
´
eo
France to construct our set of weather data. We used
certified temperature and precipitation data from the
National Oceanic and Atmospheric Administration
(NOAA). To facilitate the replication of our work, it is
important to detail the calculation process using one
example. For each month m of year y, we calculated
the national temperature index T
m,y
as follows:
T
m,y
=
22
∑
s=1
l
m
∑
d=1
1
l
m
p
v
p
total
·t
d,s,m
, (1)
where t
d,v,m
is the average temperature of day d of
year y in the weather station s of the 22 representative
cities, l
m
is the number of days within the month m, p
v
the regional population and finally p
total
the total pop-
ulation for all regions. Since we defined weather sen-
sitivity as the exposure to weather anomalies, we cal-
culated weather anomalies as the difference between
the observed value and its “normal” value. For the
current studys purposes, the normal value is the aver-
age observation over 30 years (19832012) as defined
by the World Meteorological Office. For each month
m of year y, the national temperature index anomaly
T
0
m,y
is given by the difference between the monthly
national temperature index T
m,y
and the average of the
same index over 30 years:
T
0
m,y
= T
m,y
−
1
30
2012
∑
y=1983
T
m,y
(2)
4 MODEL SELECTION
4.1 Times Series: Stationarity and Lags
A common assumption in time series analysis is that
the data are stationary. Stationary series follow an
accurate mathematical definition, which, for the pur-
poses of the current study, is summarized by taking
to mean that a stationary process has the property that
the mean, variance, and autocorrelation structures are
constant over time. This property means that station-
ary series are trendless with no seasonal fluctuations.
There are several precise statistical tests on station-
arity, of which the DickeyFuller one (Greene, 2011).
This test applied to our data confirmed our assump-
tion that all series are stationary. To test whether tex-
tile sales anomalies can be explained by temperature
anomalies, we built the following linear models:
α
m,y
= α + βT
0
m,y
+ ε, (3)
where α
m,y
is the apparel sales anomaly of month
m and year y, T
0
m,y
the national temperature index
WeatherEffectonApparelSalesinFrance
279
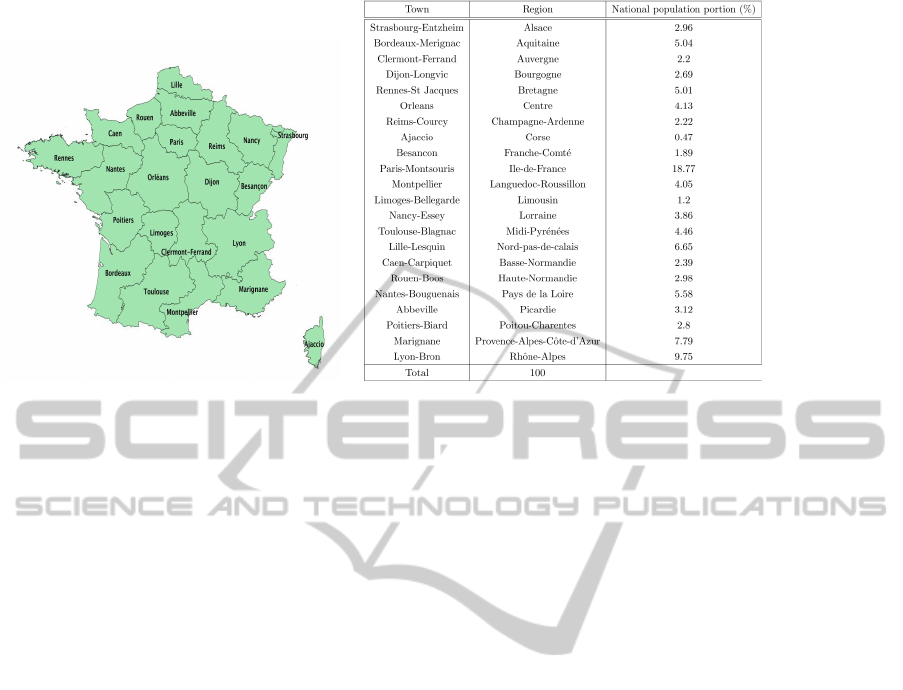
Figure 1: Regions of France and share of total population.
anomaly, ε a random variable following a normed
and centered distribution, and α and β the coefficients
which we need to estimate. The textile industry is
season-driven so we assumed that the sensitivity to
weather for each month does not change within the
same season. We therefore tested each model, for
each of the four seasons to build each model. The
models use the unexpected change in sales volumes
which may be explained by unexpected changes in
weather conditions as represented by temperatures.
For each model, we tested the significance and the fit
of the linear regression.
5 MANAGERIAL IMPLICATIONS
The present study is the first research work which ana-
lyzes the impact of temperature anomalies on sales in
the entire apparel sector at regional level for a whole
country. We calculate the sensitivity to weather of
each product category, for each distribution channel,
for men, women and children. As a result, we show
how to remove the impact of weather on the histor-
ical apparel sector performance to display the true
organic performance. We show how to specifically
identify periods of the year which exhibit the high-
est exposure to changes in weather conditions. And
finally, we provide “sales at risk” results thanks to a
deep weather database to determine the average and
the maximum potential losses which can be caused
by extreme weather conditions by product category,
by distribution channel. The fact that weather has an
impact on apparel sales is not new to retailers. For the
first time however, our findings formalize the relation-
ship between weather and apparel sales and provide
retailers with invaluable information about their per-
formance excluding weather effect and about their ex-
posure to weather. Such modeling also allows for risk
management instruments such as weather derivatives
or weather insurance to be implemented to protect re-
tailers from losses caused by unfavorable weather.
ACKNOWLEDGEMENTS
This paper has been written using material collected
with the help of the Institut Franc¸ais de la Mode. We
would also wish to thank Meteo-Protect for providing
us with curated and certified weather data.
REFERENCES
Babin, B. J. and Darden, R. (1996). Good and bad shopping
vibes: spending and patronage satisfaction. Journal of
Business Research, 35(3):201–206.
Baede, A. P. M. (2001). Climate change 2001: Working
group i: The scientific basis. appendix i - glossary.
Technical report, Intergovernmental Panel on Climate
Change (IPCC).
Bahng, Y. and Kincade, D. (2012). The relationship be-
tween temperature and sales. International Journal of
Retail and Distribution Management, 40(6):410–426.
Barrieu, P. (2003). Introduction aux produits d
´
eriv
´
es clima-
tiques. Journal de la Soci
´
et
´
e Franc¸aise de Statistique,
144(3):53–68.
Bertrand, J.-L. (2010). La gestion du risque m
´
et
´
eorologique
en entreprise. PhD thesis, Universit
´
e Paris Ouest Nan-
terre La D
´
efense.
Brockett, P., Wang, M., and Yang, C. (2005). Weather
derivatives and weather risk management. Risk Man-
agement and Insurance Review, 8(1):127–140.
ICORES2014-InternationalConferenceonOperationsResearchandEnterpriseSystems
280

Caliskan Demirag, O. (2013). Performance of weather-
conditional rebates under different risk preferences.
Omega, 41:1053–1067.
Conlin, M., O’Donoghue, T., and Vogelsang, T. J. (2007).
Projection bias in catalogue orders. The American
Economic Review, 97(4):1217–1249.
Dischel, R. (2002). Climate Risk and the Weather Market:
Financial Risk Management with Weather Hedges,
chapter Introduction to the weather market: Dawn to
mid-morning, pages 25–41. Risk Books, London.
Dutton, J. (2002). Opportunities and priorities in a new era
for weather and climate services. Bulletin of American
Meteorological Society, 83(9):1303–1311.
Ellithorpe, D. and Putnam, S. (2000). Weather derivatives
and their implications for power markets. The Journal
of Risk Finance, 1(2):19–28.
Greene, W. (2011). Econometric Analysis. Prentice Hall,
Upper Saddle river, NJ, USA, 7th edition edition.
Groenland, E. A. and Schoormans, J. P. L. (1994). Com-
paring mood-inducion and affective conditioning as
mechanisms influencing product evaluation and prod-
uct choice. 11:183–197.
Howarth, E. and Hoffman, M. S. (1984). Amulti dimen-
sional approach to the relationship between mood and
weather. British Journal of Psychology, 75(1):05–23.
Larsen, P. H. (2006). Estimating the sensitivity of u.s. eco-
nomic sectors to weather. Working Paper, Cornell
University.
Lazo, J. K., Lawson, M., Larsen, P. H., and Waidmann,
D. M. (2011). U.s. economic sensitivity to weather
variability. Bulletin of American Meteorological Soci-
ety, 92:709–720.
Lee, Y. and Oren, S. (2009). An equilibrium pricing model
for weather derivatives in a multi-commodity setting.
Energy Economics, 31:702–713.
Linden, F. (1959). The business of department stores. Tech-
nical report.
Murray, K., Di Muro, F., Finn, A., and Popkowski Lesz-
cyc, P. (2010). The effect of weather on consumer
spending. Journal of Retailing and Consumer Ser-
vices, 17:512–520.
Roll, R. (1984). Orange juice and weather. The American
Economic Review, 74(5):861–880.
Rowley, J. (1999). Loyalty, the internet and the weather;
the changing nature of the marketing information sys-
tems. Management Decision, 37:514–518.
Starr-McCluer, M. (2000). The effect of weather on retail
sales. Technical report.
Steele, A. T. (1951). Weather’s effect on sales of a depart-
ment store. Journal of Marketing, 15:436–443.
Stoltman, J. J., Morgan, W. F., and Anglin, K. L. (1999).
An investigation of retail shopping situations. Inter-
national Journal of Retail and Distribution Manage-
ment, 27(4):145–153.
Swinyard, W. R. (1993). The effects of mood, involve-
ment and quality of store experience on shopping in-
tentions. Journal of Consumer Research, 20(2):271–
293.
WeatherEffectonApparelSalesinFrance
281
