
Pattern-based Classification of Rhythms
Johannes Fliege, Frank Seifert and André Richter
Dept. of Computer Science, Chemnitz University of Technology, 09107, Chemnitz, Germany
Keywords: Rhythm Classification, Music Information Retrieval, Knowledge Modelling, Pattern Extraction.
Abstract: We present a pattern-based approach for the rhythm classification task that combines an Auto-correlation
function (ACF) and Discrete Fourier transform (DFT). Rhythm hypotheses are first extracted from symbolic
input data, e.g. MIDI, by the ACF. These hypotheses are analysed by the use of DFT to remove duplicates
before the classification process. The classification of rhythms is performed using ACF in combination with
rhythm patterns contained in a knowledge base. We evaluate this method using pre-labelled input data and
discuss our results. We show that a knowledge-based approach is reasonable to address the problem of
rhythm classification for symbolic data.
1 INTRODUCTION
Access to music is ubiquitous. Internet archives of
enormous size can be searched for any demanded
track. However, in many cases search criteria are
limited to Meta-information such as title, album,
interpreter or composer. Searching intuitively on the
basis of semantic information like rhythmic, melodic
or instrumental properties is usually not offered.
Nevertheless, it would be helpful in cases where
other metadata is not available. Thus, in order to
provide search techniques that can offer these
content-based modes, automated methods to retrieve
this information are necessary.
1.1 Motivation
The use of percussion is common in contemporary
music. In most cases these instruments are used to
play recurring rhythmic patterns. Nevertheless, this
rhythmic accompaniment is not of an absolute
steady character but may be interrupted by so-called
fill-ins or variations. Rhythms may even be
superseded by other rhythms in one piece of music.
These points raise the question for an approach that
can identify rhythms in a piece of music and is able
to manage fill-ins or rests. Furthermore, the
approach would need to be able to handle multiple
rhythms that may occur in a music track.
1.2 Paper Organization
In Section 2 we present related work and outline the
need for our work. In Section 3 we present our
approach of rhythm classification. In Section 4 we
evaluate our method and present test results. Section
5 concludes and gives directions for future work and
further improvements.
2 RELATED WORK
Various methods that address the classification of
musical genres have already been presented. These
approaches are based on either audio data, e.g. tracks
in wav-format, or on symbolic music data such as
MusicXML or General MIDI. Furthermore, the
presented approaches need to be differentiated by
their proposed methods of music information
retrieval. They can be grouped into the following
four categories.
Feature-based Approaches: Paulus and Klapuri
(2002) propose a method to compare rhythms, which
uses a database of nine rhythm patterns. The
comparison is based on several features, such as
loudness and brightness that are extracted from
audio. The feature vectors are matched by a dynamic
time warping algorithm. Tzanetakis and Cook
(2002) present a method for music genre
classification by deriving several features from a
beat histogram in combination with other music
audio content features. The approach is based upon
747
Fliege J., Seifert F. and Richter A..
Pattern-based Classification of Rhythms.
DOI: 10.5220/0004919507470752
In Proceedings of the 3rd International Conference on Pattern Recognition Applications and Methods (ICPRAM-2014), pages 747-752
ISBN: 978-989-758-018-5
Copyright
c
2014 SCITEPRESS (Science and Technology Publications, Lda.)

audio. Peeters (2011) presents an approach that is
also based on audio. First, the onset positions are
evaluated by an energy function. Based on this
function, vector representations of rhythm
characteristics are computed. For classifying these
rhythms, four feature sets of these vectors are
studied which are derived by applying DFT and
ACF. Next, various ratios of the local tempo are
applied to these vectors. Finally, a classification task
measures the ability of these periodicity
representations to describe the rhythm characteristics
of audio items.
Pattern-based Approaches: Ellis and Arroyo
(2004) present an approach that uses Principal
Components Analysis (PCA) to classify drum
patterns. First, measure length and downbeat
position are estimated for each track of a collection
of 100 drum beat sequences given in General MIDI
files. From each of these input patterns, a short
sequence is passed to the PCA resulting in as set of
basic patterns. A classification task is performed
with them producing about 20 % correctly classified
results. Murakami and Miura (2008) present an
approach to classify drum-rhythm patterns into
“basic rhythm” and “fill-in” patterns. Based on
symbolic representations of music, i.e. General
MIDI tracks, instruments are grouped by their
estimated importance on playing roles in either
“basic rhythm” patterns or “fill-in” patterns or both.
These three groups model drum rhythm patterns.
Expecting a minimum input of one measure in 4/4
beat the classification is performed based on
neighbourhood comparison. They achieve
classification result of up to 76 %.
Source Separation based Approaches: Tsunoo,
Ono & Sagayama (2009) propose a method to
describe rhythm by classifying track spectrograms
based on audio. Thus, percussive and harmonic
components of a track are first separated by the
method described in Ono et al. (2008) followed by
clustering the percussive part in a combination of
One-Pass Dynamic Programming algorithm and k-
means clustering. Finally, the frame of each track is
assigned to a cluster. The corresponding track’s
spectrogram is used to classify the rhythms. They
achieve accuracies of up to 97.8 % for House music.
Psychoacoustic-based Approach: Rauber,
Pampalk and Merkl (2002) propose a method to
automatically create a hierarchical organization of
music archives based on perceived sound similarity.
First, several pre-processing steps are applied. All
tracks of the archives are divided into segments of
fixed length followed by the extraction of frequency
spectra based on the Bark scale in order to reproduce
human perception of frequency. Finally, the specific
loudness sensation in Sone is calculated. After these
pre-processing steps a time invariant representation
of each piece of music is generated. In the last step
of processing, these patterns are used for
classification via Self-Organizing Maps. The method
is based on audio.
Although approaches on solving the problem of
rhythm classification have already been presented
yet the success rates can only be regarded as
satisfying for specific genres, e.g. Popular music or
House music (Ono et al., 2008) or ballroom dance
music (Peeters, 2011). Furthermore, the majority of
approaches (Paulus and Klapuri, 2002; Tzanetakis
and Cook, 2002; Peeters, 2011; Tsunoo, Ono &
Sagayama, 2009; Ono et. Al, 2008; Rauber, Pampalk
and Merkl, 2002) rely on audio. Thus, further effort
is required to improve classification methods that
address symbolic data.
3 CLASSIFYING RHYTHM
PATTERNS
In this paper we present an approach for the
classification of music rhythms that treats rhythm as
a sequence of N notes with a time difference
between the onsets of adjacent notes. Our method is
based on symbolic data in order to be able to access
all necessary information for each note directly.
Thus, by not using audio, we can exclude further
sources of error, e.g. detecting the onset positions of
notes. Although numerous onset detection
approaches are known their reliability is still
inadequate for excluding them as a possible source
of error (Collins, 2005).
We compare and classify rhythms in four steps.
Step one covers all necessary preliminary
computations; in step two all possible, i.e.
hypothetical rhythm patterns are extracted; step
three reduces the number of rhythm hypotheses and
finally, step four performs the classification task
utilizing a knowledge base. Fig. 1 illustrates this
concept.
However, to limit the number of possible sources
of error, we only focus on drum rhythm patterns and
limit our method to the use of temporal information
and accentuation as features for the classification
task. Furthermore, evaluated sequences are limited
to a length of 30 s in order to reduce computational
complexity.
ICPRAM2014-InternationalConferenceonPatternRecognitionApplicationsandMethods
748

Figure 1: Overview of the rhythm classification approach.
3.1 Preliminary Computations
The preliminary computations of our approach cover
the extraction of musical events from the MIDI data
and the temporal clustering of these events.
In order to provide a basis for succeeding
computations the input is processed, thus, extracting
a sequence S of musical events e, i.e. notes and
sorting them by time. For each event e
i
, the
extraction process covers the onset time t
e
i
, the
accentuation according to the MIDI velocity v
e
i
, and
the MIDI instrument specification inst
e
i
. The latter
parameter is of special interest since our approach is
based on percussive instruments. Thus, only events
created by a percussion instrument are taken into
account.
The temporal clustering of these events is based
on the perception of periodic pitches (Sethares,
2007). The minimum time difference that can be
perceived is at approximately 0.02 s for click sound
events or higher for more complex sound events
(Pfleiderer, 2006). Sethares (2007) instead claims
that minimum interval of 0.05 s is necessary to
perceive these events separately. We decided to uses
the mean value of these times as threshold for the
clustering process, i.e. 0.35 s. Thus, all events e
i
and
e
j
with a smaller time difference can be assigned a
new equal onset time t
new
(see (1)). This step also
reduces the sensitivity for intended or unintended
inaccuracies in a piece of music.
t
new
t
e
i
v
e
i
t
e
j
v
e
j
v
e
i
v
e
j
(1)
3.2 Extracting Rhythm Hypotheses
In order to create a set of rhythm pattern hypotheses
all recurring patterns need to be identified. Our
approach uses a discrete Auto-correlation function to
compute similarity values for possible rhythm
hypotheses. First, a regular grid is applied to
perform temporal discretization of the continuous-
time input.
3.2.1 Temporal Discretization
Applying a regular grid to the pre-processed input
performs discretization. The grid resolution R needs
to ensure that separate events remain separate when
they are mapped to the grid. Nevertheless, a coarse
grid resolution might change the structure of a
pattern, which should also be avoided. Thus, in (2),
R depends on the temporal distances of each two
events e
i
and e
j
and is limited to R
max
= 0.1 s.
Equation (3) shows the mapping of an event e to its
position on the grid.
(2)
(3)
3.2.2 Auto-correlation Function
Based on the discrete-time events, a modified auto-
correlation function is applied to the time frames f
s
and f
t
. These time frames limit the length of a
rhythm pattern since very long rhythmic structures
are not addressed by the approach because long
structures (patterns) would violate the concept of the
perceptual present (Pfleiderer, 2006) and might
include multiple perceived gestalts. Thus, the frame
length is fixed to 4 s, and the maximum start time
difference of two frames t
dif_max
is constrained to
t
dif_max
= 6 s. The resulting tolerance of 2 s between
frames was introduced to improve the robustness for
rests, fill-ins or breaks. These anomalies might
disconnect the sequence of rhythms. For applying
the ACF, f
s
is fixed in time while f
t
is shifted in steps
of R until t
dif_max
is reached. In Fig. 2 we illustrate
this concept.
For each step i of f
t
the correlation coefficient
Cor is evaluated depending on the grid positions s
i
and t
i
of f
s
and f
t
, respectively. In detail, Cor depends
on the accentuation a at each these positions. The
formula is given in (4); Y denotes the number of grid
positions per frame.
(4)
In (5) the quotient of the correlation coefficients
of f
s
and f
t
is evaluated for the fixed grid position s
and the variable position s + i. We denote it as
normalized correlation coefficient NCor
i
(s).
input
data
prelim.
computations
extraction of
hypotheses
validation of
hypotheses
k
n
o
w
l
e
d
g
e
b
a
s
e
classification
classified
rhythms
R min
0.1,
{dist (e
i
,e
j
)|dist(e
i
,e
j
) 0,i, j 1..n;i j}
r
e
t
e
R
Cor (s,t) a(si) a(t i)
i0
Y1
Pattern-basedClassificationofRhythms
749
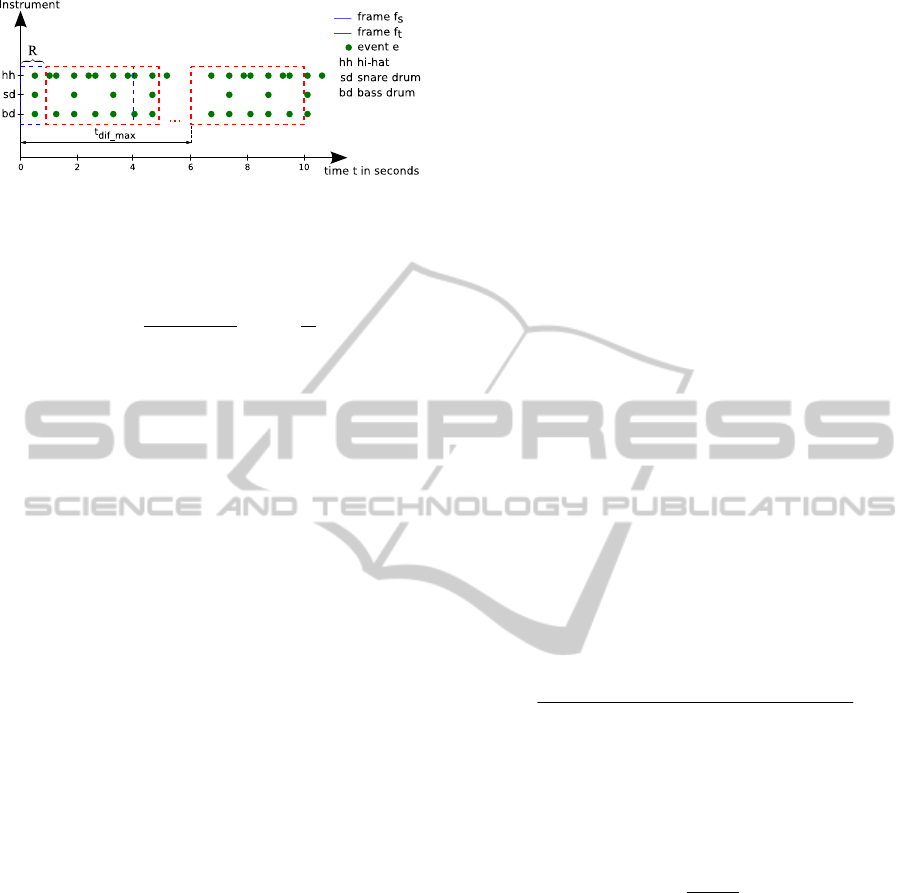
Figure 2: Time frame concept for the ACF. Frame f
s
is
fixed while f
t
is shifted across the time axis in steps of R.
Both frames have a length of 4 s; their start times may
differ at most by 6 s.
(5)
A set H containing rhythm hypotheses H
m,n
is
created on the basis of (5). For each NCor
x
(y) an
element H
m,n
is added to H. Each element is based on
a time domain T
m,n
with m = y and
n = min((y + x),(y + Y)). Furthermore, H
m,n
can only
be part of H if it contains at least two events e
1
and
e
2
with r(e
1
) ≠ r(e
2
). These rhythm hypotheses are
fundamental to all further evaluations.
3.3 Validation of Rhythm Hypotheses
Set H contains all computed rhythm hypotheses.
Based on the assumption that true rhythms occur
more often than false identified hypotheses, H will
be filtered by quantity. Furthermore, equal rhythm
hypotheses may occur phase-shifted. This issue will
be addressed by DFT.
A quantitative filter is applied based on the
assumption that many occurrences of a rhythm lead
to large number of rhythm hypotheses of equal
length. Thus, a histogram h is composed of the
durations of all elements in H. The durations form
histogram categories. To filter by quantity, the
arithmetic mean A is evaluated as a function of the
number of elements per category. Hypotheses that
belong to a category with fewer values than A are
rejected. All others form classes class
p
based on
their histogram categories;
p
denotes the duration.
For each class
p
, a DFT is applied to all contained
hypotheses H
m,n
to calculate their frequency-
dependent representations. Subsequently, correlating
these representations for each two hypotheses i and j
of p results in the similarity value c
i,j
. The
aggregated similarity value s
i
is evaluated for each i
by summing all c
i,j
of p. Hence, the three most
similar rhythm hypotheses, indicated by s
i
, are added
to set D. D forms the input data set for the
classification process.
3.4 Classification
The classification of the rhythm hypotheses in D is
performed as final step. For each element in D,
matching candidates are chosen from a set W of
rhythms, i.e. from our knowledge base. Finally, the
rhythm hypotheses are classified.
Two rhythms might not be perceived as similar
to each other if their duration differs by more than a
certain amount. This may happen although their
structure appears to be equal when being normalized
to equal length. Thus, for each dD, we chose to
exclude all rhythms from W that are more than 50 %
shorter or longer than d. The value had been
evaluated during our experiments. The remaining
subset of W is called W
d
.
Next, the duration of all wW
d
is altered to the
length of d and a regular grid is applied to w using
the same parameters as in the temporal discretization
step of d. The modification of the temporal
representation of w to the length of d is performed in
order to be able to apply the ACF in the next step.
Finally, classification is performed by the means
of ACF. In (6) the the correlation coefficient W
d,w
is
calculated. The accentuation values a
w
and a
d
of w
and d are correlated at grid position r. Possible phase
shifts i are also considered. l denotes the number of
grid positions of both d and w.
1
0
,
min ( ) ( ) , ( ) ( )
()
l
dwww
r
dw
ai r ar ai r ar
Wi
l
(6)
The reference value W
ref
of the ACF is evaluated
as a function of the sum of the square of a
w
of all
grid positions t of w. The result of the classification
of d and w E
d,w
is expressed in (7) by the maximum
value q of the ACF of d and w.
,
,
()
,, | max | 0..( 1)
dw
dw
ref
Wi
Eqdwq il
W
(7)
All classification results of an input file form the
set E (see (8)).
E E
d,w
| d D,w W
d
(8)
4 EXPERIMENTAL
EVALUATION
In this part, we evaluate our presented rhythm
classification approach. In our evaluation, we focus
on swing and rock since percussive instruments play
a major role in music of this genre.
NCor
i
(s)
Cor (s,si)
Cor (s,s)
; i 0..
6
R
ICPRAM2014-InternationalConferenceonPatternRecognitionApplicationsandMethods
750

4.1 The Knowledge Base
Our approach requires a knowledge base. Thus, we
define a knowledge base that contains 10 rhythm
patterns. Five of these are categorized as swing
patterns, five as rock patterns. All of them were
taken from a drum kit textbook (Kramme and
Kiesant, 1981). Currently, at the basic state of our
method, we consider this number to be sufficient for
testing.
4.2 Test-set
Our test-set is formed of 465 MIDI tracks of the
genres Rock and Swing. More precisely, 223 Rock
tracks and 242 Swing tracks are included. These
tracks are of various lengths. Nevertheless, some of
them cannot be taken into account for our
experiment since our method shall be applied to
sequences of a length of 30 s, as we already pointed
out in Section 3. Thus, shorter tracks are removed.
For longer tracks, our system chooses the first 30 s.
The majority of the tracks that fulfil the length
requirement contain only drum sequences, a minor
part contains drum sequences and other instruments
and a negligible part does not contain drum
sequences at all. The tracks that belong to the latter
part are removed since the approach addresses only
drum rhythm patterns. For tracks containing non-
percussive and percussive instruments, the non-
percussive sequences are ignored automatically.
By applying these limitations, 9 out of 223 Rock
tracks and 25 out of 242 Swing tracks are removed.
Finally, they form a Rock test-set containing 214
tracks and a Swing test-set of 217 tracks.
4.3 Results
We perform experiments with the proposed system
in order to answer the question if it is capable of
identifying rhythms of pre-labelled tracks correctly,
i.e. identifying the genre by comparing it to the
rhythmic patterns contained in the knowledge base.
Furthermore, we were interested in the quality of the
classification result, which is indicated by q (see
(7)).
The results of these experiments are presented in
Table 1 and Table 2. The values calculated on the
basis of the rock test-set show that all tracks could
be identified to belong to the genre Rock with a
probability of at least 50 %. The major part could be
assigned a probability of 80 % or more to belong to
its pre-labelled genre. If more than one rhythm could
be identified for a track, only the pattern with the
highest quality value was regarded for the results.
If we assume that a classification result of at
least 80 % is sufficient to claim that a track belongs
to the genre Rock, we can say that our approach
achieved a classification ratio of 73.4 % for this
specific genre.
The Swing test-set’s results differ slightly from
the Rock test-set’s results. Although 147 of 217
tracks could be classified to be Swing with a
probability of q ≥ 0.8, 6 tracks did not achieve a
classification result of 50 % or more. Furthermore,
the number of tracks classified with a probability of
at least 95 % sufficiently lower than in the Rock
test-set’s results. Applying the 80 % threshold to the
Swing experiment, a success rate of 67.7 % can be
assumed.
4.4 Discussion
Our approach can be contrasted with other work that
is limited to specific values of features. Murakami
and Miura (2008) have presented a system able to
classify rhythm patterns based on symbolic data in
4/4 meter. They also limit the scope of their
approach to popular music. Ellis and Arroyo (2004)
developed an approach that looks at the sequence of
the beats to perform automatic classification of
contemporary musical genres. We do not limit our
approach to specific musical genres but restrict it to
data that contains percussive instruments. Besides
this limitation, we consider aspects of auditory
perception and the concept of the perceptual present
in rhythm classification approach.
Table 1: Classification results of the Rock test-set. The
table shows the probability to be Rock for all Rock tracks.
Probability value Number of tracks
q ≥ 0.95 83
0.8 ≤ q < 0.95 74
0.65 ≤ q < 0.8 53
0.5 ≤ q < 0.65 4
q < 0.5 0
Table 2: Classification results of the Swing test-set. The
table shows the probability to be Swing for all Swing
tracks.
Probability value Number of tracks
q ≥ 0.95 58
0.8 ≤ q < 0.95 89
0.65 ≤ q < 0.8 40
0.5 ≤ q < 0.65 24
q < 0.5 6
Pattern-basedClassificationofRhythms
751

The results produced by our system depend
fundamentally on the knowledge base. The quality
range of the results shows that a knowledge base of
10 patterns may not cover all appearing rhythmic
structures. Evaluating only 30 s of a track may also
have influenced the results as well as the limited
feature set. Thus, more features might help to
improve the classification approach. Timbre
information might be one of these.
5 CONCLUSIONS AND FUTURE
WORK
We have introduced an automatic rhythm
classification approach that is not limited to specific
musical genres. Based on MIDI data, we used an
ACF to extract possible rhythm patterns from the
input. These pattern hypotheses were validated using
the DFT to reduce duplicates and to ensure the
efficiency of the final classification process.
Correlating extracted rhythm hypotheses with
patterns provided by the knowledge base performed
the classification.
Our results showed that the proposed method is
capable to perform a genre classification of music
tracks. However, the quality of the results is highly
dependent on the content of the knowledge base.
In future works we plan to extend our knowledge
base to cover more musical genres. Thus, it is also
intended to examine the general applicability of our
method. Further future works include improvements
of the discretization method, i.e. improved alignment
of the grid to the content. Furthermore, we plan to
extend our approach by adding beat detection, thus,
considering the detected meter as feature for the
classification process. In addition, we also plan to
study the influence of timbre on rhythm
classification. Further evaluations will also be
performed.
Limitations that were introduced in order to limit
computational effort will also be removed in future
works. We plan to investigate parallelization
approaches as well as distributed processing
methods.
REFERENCES
Collins, N. (2005), A Comparison of Sound Onset
Detection Algorithms with Emphasis on
Psychoacoustically Motivated Detection Functions. In
Audio Engineering Society 118th Int. Conv.
Ellis, D. and Arroyo, J. (2004), Eigenrhythms: Drum
pattern basis sets for classification and generation. In
ISMIR.
Kramme, H. E. & Kiesant, G. (1981), Das Schlagzeug in
Pop, Rock und Jazz. Leipzig, Germany: VEB
Deutscher Verlag für Musik Leipzig.
Murakami, Y. and Miura, M. (2008), Automatic
classification of drum-rhythm patterns employed in
popular music. In ICMPC. p. 450-454.
Ono, N.; Miyamoto, K.; Kameoka, H. and Sagayama, S.
(2008), A Real-time Equalizer of Harmonic and
Percussive Components in Music Signals. In ISMIR.
p. 139-144.
Paulus, J. and Klapuri, A. (2002), Measuring the similarity
of rythmic patterns. In ISMIR. p. 150-156.
Peeters, G. (2011), Spectral and Temporal Periodicity
Representations of Rhythm for the Automatic
Classification of Music Audio Signal. IEEE
Transactions on Audio, Speech & Language
Processing 19 (5). p. 1242-1252.
Pfleiderer, M. (2006), Rhythmus: psychologische,
theoretische und stilanalytische Aspekte populärer
Musik. Bielefeld, Germany: transcript.
Rauber, A., Pampalk, E. and Merkl, D., (2002), Using
Psycho-Acoustic Models and Self-Organizing Maps to
Create a Hierarchical Structuring of Music by Sound
Similarity. In ISMIR. p. 71-80.
Seifert, F. and Rentzsch, M. (2010), Generic modeling of
music for computational education and recognition of
song variations. In IEEE ICCIT. p. 1046-1051.
Sethares, W. A., (2007), Rhythms and Transforms,
London, Springer-Verlag.
Tsunoo, E.; Ono, N. and Sagayama, S. (2009), Rhythm
map: Extraction of unit rhythmic patterns and analysis
of rhythmic structure from music acoustic signals. In
ICASSP. IEEE. p. 185-188.
Tzanetakis, G. and Cook, P. (2002), Musical genre
classification of audio signals. IEEE Transactions on
Speech and Audio Processing. 10 (5). p. 293-302.
ICPRAM2014-InternationalConferenceonPatternRecognitionApplicationsandMethods
752
