
Development of an Interhemispheric Symmetry Measurement
in the Neonatal Brain
Ninah Koolen
1,2
, Anneleen Dereymaeker
3
, Katrien Jansen
3
, Jan Vervisch
3
, Vladimir Matic
1,2
,
Maarten De Vos
1,2,4
, Gunnar Naulaers
5
and Sabine Van Huffel
1,2
1
Department of Electrical Engineering (ESAT), division SCD, University of Leuven, Leuven, Belgium
2
iMinds-KU Leuven Future Health Department, Leuven, Belgium
3
Department of Pediatrics, University Hospital Gasthuisberg, Leuven, Belgium
4
Department of Psychology, University of Oldenburg, Oldenburg, Germany
5
Neonatal Intensive Care Unit, University Hospital Gasthuisberg, Leuven, Belgium
Keywords: Preterm Brain, Symmetry, Channel Symmetry Index, Spectral Power, EEG, One-class SVM, Classification.
Abstract: The automated analysis of the EEG pattern of the preterm newborn would be a valuable tool in the neonatal
intensive care units for the prognosis of neurological development. The analysis of the (a)symmetry
between the two hemispheres can provide useful information about neuronal dysfunction in early stages.
Consecutive and subgroup analyses of different brain regions will allow detecting physiologic asymmetry
versus pathologic asymmetry. This can improve the assessment of the long-term neurodevelopmental
outcome. We show that pathological asymmetry can be measured and detected using the channel symmetry
index, which comprises the difference in power spectral density of contralateral EEG signals. To distinguish
pathological from physiological normal EEG patterns, we make use of one-class SVM classifiers.
1 INTRODUCTION
Electroencephalogram (EEG) is a non-invasive and
sensitive tool for assessing cerebral function in
premature infants. The chronological changes in
EEG background with increasing postconceptional
age reflect the central nervous system maturation.
Standard values of maturational features in
premature EEG are already well described
(Hellström-Westas, 2005; Vecchierini, 2007;
Hayashi-Kurahashi, 2012; Le Bihannic, 2012).
Chronic EEG background abnormalities are strongly
associated with adverse neurological outcome in
both preterm and full-term infants (Hellström-
Westas, 2001; Okumura, 2002). These abnormal
patterns must be scored and interpreted visually and,
thus, subjectively. However, analyses and
interpretation of multichannel neonatal EEG is
difficult, requires expertise and is time consuming.
Therefore, objective criteria for the assessment
of EEG abnormalities have to be established and
automated background EEG analysis may contribute
to reliable interpretation (Palmu, 2010). In previous
research, we have defined features that can be
calculated for each time signal, in other words, for
each EEG channel independently (Koolen, 2013).
However, EEG is a multichannel measurement, and
all too often this spatial dimension is ignored.
Spatial 'integration' is usually limited to concatenate
the characteristics of different channels (Hunyadi,
2011). Here, we intend to exploit the available
spatial information to quantify the interaction
between the various areas of the brain using
connectivity analysis. Such connectivity values can
be highly relevant to make an accurate prognosis of
the neurological outcome of the premature babies,
since they are the mathematical quantification of the
degree of connectivity between different brain
regions. After all, it is commonly assumed that brain
areas in very young babies are barely connected, and
that during brain development through spontaneous
interaction a sophisticated network is formed
(Vanhatalo, 2006; Smyser, 2010). In this paper, the
interhemispheric symmetry is examined: can we
detect pathological asymmetry in
electrophysiological activity between two
hemispheres.
765
Koolen N., Dereymaeker A., Jansen K., Vervisch J., Matic V., De Vos M., Naulaers G. and Van Huffel S..
Development of an Interhemispheric Symmetry Measurement in the Neonatal Brain.
DOI: 10.5220/0004922407650770
In Proceedings of the 3rd International Conference on Pattern Recognition Applications and Methods (ICPRAM-2014), pages 765-770
ISBN: 978-989-758-018-5
Copyright
c
2014 SCITEPRESS (Science and Technology Publications, Lda.)

Interhemispheric asymmetry in premature infants is
defined as a persistent amplitude difference of 50%
over homologous areas in one hemisphere and must
be persistent to all behavioural states to be
significant (Holmes, 1993).
In addition,
abnormalities can be extracted from a difference in
the power of the frequency domain.
This
abnormality in background pattern is frequently
associated with lateralized pathology such as an
underlying anatomical or acquired brain lesion (e.g.
intraparenchymal haemorrhage, stroke, ischemic
insults and congenital brain malformations)
(Holmes, 1993; Van Putten, 2004).
Automated interhemispheric symmetry analysis
in preterm and term infants can be a valuable tool to
detect neuronal dysfunction in early stages.
Consecutive and subgroup analyses of different
brain regions (as detected in frontal, central,
temporal and occipital electrophysiological activity)
will allow detecting physiologic asymmetry versus
pathologic asymmetry. Correlation of this pattern
with long–term neurodevelopmental outcome has to
be defined.
In order to detect those abnormal patterns in a
classification process, we will use the channel
symmetry index (CSI) (Hunyadi, 2010). Both
amplitude and frequency content are taken into
account, since the CSI is based on the difference in
the power spectral bands of the contralateral
channels. Derived features from the CSI curves will
serve as input for the classification. Due to an
unbalanced dataset, we will make use of a one class
Support Vector Machine (SVM) (Schölkopf, 2000,
2001).
2 DATA ACQUISITION
The proposed method is tested on EEG
measurements, obtained with OSG equipment (OSG,
Belgium). The purpose is to observe the symmetry
between different brain areas. Therefore, we use
multi-channel or ‘full’ EEG taken at 9 electrode
locations (Fp1, Fp2, T3, T4, C3, C4, Cz, O1, O2).
The sampling frequency is 250 Hz. The dataset
contains EEG recordings of 47 newborns, born at a
postmenstrual age (PMA) of 24-40 weeks, including
patients with structural brain abnormalities (acquired
or congenital) and clinical convulsions. To assess
brain maturation, 20 preterm infants had several
EEG measurements at consecutive moments with
increasing PMA. This resulted in a total of 92 EEG
measurements. In this way, we want to score
physiologic brain symmetry in the developing
premature brain. On the other hand, we can score
brain symmetry in both preterm and term infants
with pathologic conditions. Data containing artefacts
(>30% of the whole measurement) were excluded
from this study. In consideration of symmetry
calculations between two EEG channels, signals of
only these two channels are excluded in case that
one electrode is disturbed. In other words, not the
whole full-EEG is excluded. The data was labelled
into two categories: pathologic asymmetry and
physiologic normal symmetry. The protocol was
approved by the ethics committee of the University
Hospitals of Leuven, Belgium. A pre-processing
step including a 50 and 100 Hz Notch filter and a 1-
20 Hz band pass filter was applied on the data.
3 METHODOLOGY
3.1 Channel Symmetry Index
First, we investigate detecting asymmetry between
different EEG channels based on a feature called
channel symmetry index (CSI) (Hunyadi, 2010).
This feature is defined as the power asymmetry in
predefined frequency bands and is calculated
between two contralateral channel pairs presented in
formula 1 (O1 vs. O2, C3 vs. C4, T3 vs. T4, Fp1 vs.
Fp2).
max
min
,,
,,
(,)
F
f ch f opp
fF
fch fopp
PSD PSD
CSI ch F
PSD PSD
(1)
where ch is a chosen EEG channel and opp its
contralateral channel as can be found in Figure 1.
Figure 1: Electrode placements for 9 channel EEG
measurement, contralateral channels are given in white-
black (O1-O2, C3-C4, T3-T4, Fp1-Fp2).
The selected frequency bands correspond to the
clinically relevant frequencies to monitor brain
activity: delta band (1-4 Hz), theta band (4-8 Hz),
alpha band (8-13 Hz) and beta band (13-21 Hz). A
ICPRAM2014-InternationalConferenceonPatternRecognitionApplicationsandMethods
766
CSI value is calculated for each 150 seconds of the
EEG measurement, for each channel pair and each
frequency band. A mean value is obtained by
averaging the CSI values of the different frequency
bands (Figure 2a). Subsequently, a patient specific
box plot of these values over the whole EEG
measurement is determined (Figure 2b).
3.2 Outcome Dependent Features
For classification, we need features to distinguish
normal and abnormal EEG patterns. Based on the
box plots, we have worked with four features:
Median box plot
Interquartile range (iqr) of the box plot: a
statistical measurement to describe the spread
of the data. iqr is calculated as the difference
between the upper and the lower quartiles. This
feature is similar to the range, although it is
less sensitive to outliers, e.g. the movement of
an electrode.
Standard deviation (std) of the boxplot:
variation from the average.
Postmenstrual age (PMA): brain maturation
may have an influence on the median of the
box plot. The hemispheres connection is still
developing.
Figure 2: a. mean CSI values, averaged over frequency
bands, shown for different channel pairs; b. box plot mean
CSI.
3.3 One-class SVM Classification
A simple threshold on the median value of the
patient box plots is not sensitive enough, leading to a
lot of false positive detections. Therefore, we need
to incorporate the different features into a more
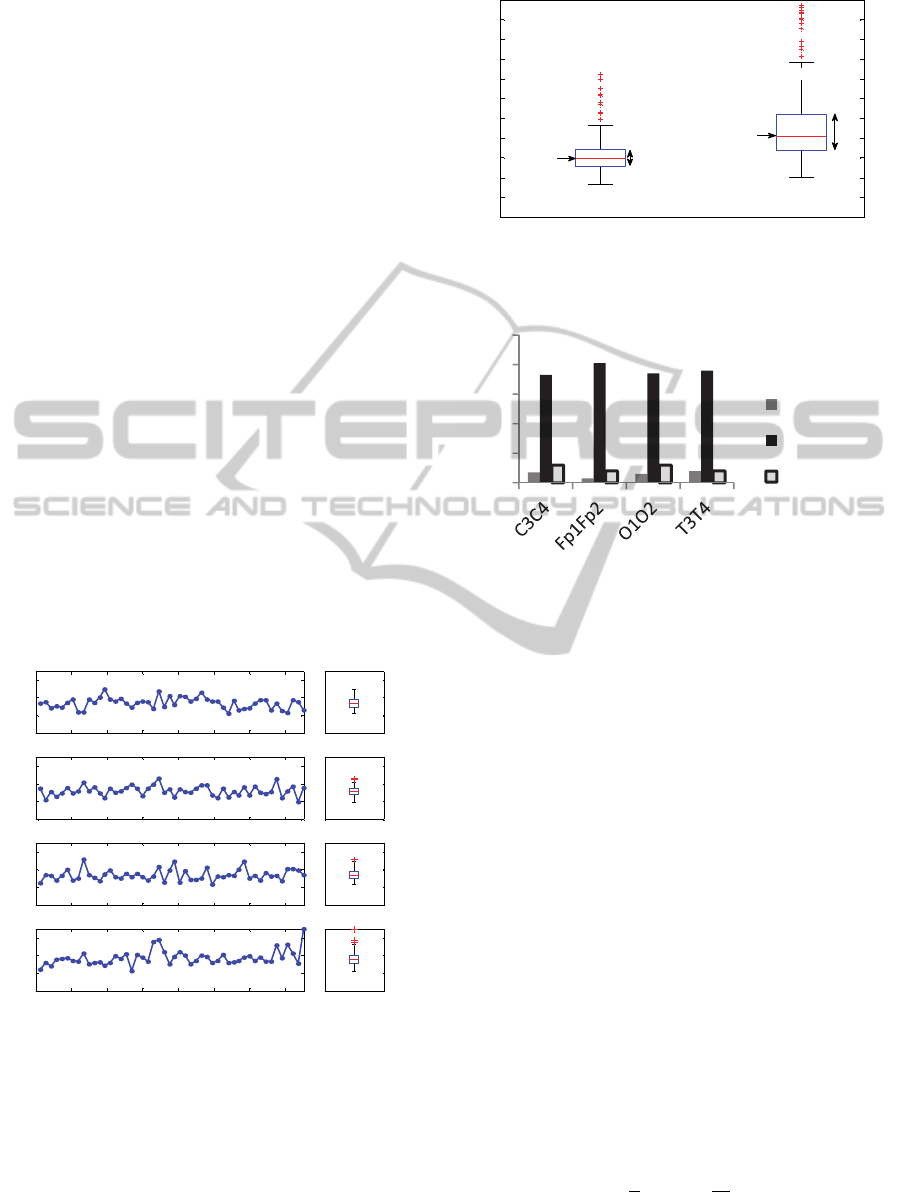
Figure 3: Different features for a normal patient (patient 1)
and a patient with hemimegalencephaly-haemorrhage
(patient 2), measurements taken at comparable PMA.
Figure 4: Number of normal/abnormal patients, number of
data excluded for analysis since artefacts are present in the
data.
complex classification system. Here, a classifier is
constructed and trained for every channel pair,
resulting in four classifiers. Unfortunately, one
classifier incorporating all features is not enough,
since pathologies can result in lateralization of only
one region of the brain. This means, the
hemisphere’s symmetry elsewhere in the brain can
be normal compared to patients of similar age. In
addition, there is a huge unbalance between the
number of normal and abnormal classes (Figure 4).
For this purpose, one-class SVM classifiers are
applied. It will give the value +1 in a small region
capturing the pathological class and -1 for all other
data points (normal class). The data is mapped in the
feature space corresponding to the radial basis kernel
function and to separate them from the origin with
maximum margin (Schölkopf, 2000). On which side
of the hyperplane a new point will fall in feature
space, will decide to which class this point will
belong.
The quadratic problem to separate the data from
the origin is solved (Schölkopf, 2001):
min
∈,∈
,∈
1
2
‖
‖
1
subjectto∙
,
0
(2)
0 1000 2000 3000 4000 5000 6000 7000
0
0.2
0.4
0.6
Fp1-Fp2
mean CSI (over different frequency bands)
0
0.2
0.4
0.6
1
boxplot mean CSI
0 1000 2000 3000 4000 5000 6000 7000
0
0.2
0.4
0.6
C3-C4
0
0.2
0.4
0.6
1
0 1000 2000 3000 4000 5000 6000 7000
0
0.2
0.4
0.6
T3-T4
0
0.2
0.4
0.6
1
0 1000 2000 3000 4000 5000 6000 7000
0
0.2
0.4
0.6
time (seconds)
O1-O2
0
0.2
0.4
0.6
1
0
0.1
0.2
0.3
0.4
0.5
0.6
0.7
0.8
0.9
1
17 16
mean CSI for Fp1-Fp2
iqr1
median 1
median 2
patient 1
patient 2
iqr2
7
3
6
8
73
81
74
76
12
8
12
8
0
20
40
60
80
100
Abnormal
Normal
Artifact
DevelopmentofanInterhemisphericSymmetryMeasurementintheNeonatalBrain
767

Here, w and ρ are a weight vector and an offset to
parameterize the hyperplane in feature space
associated with the kernel (Schölkopf, 2000).
Outliers are those points defined as points on the
wrong side of the hyperplane (within margin ρ of the
origin).
are the outlier distances from the
hyperplane.
Figure 5: Principle of the quadratic problem of the one-
class SVM (Fourie, 2011).
In order to choose the best subset of model
parameters, we have trained the hyper parameters of
this classifier, namely ν and γ. ν is an upper bound
on the fraction of training errors and a lower bound
of the fraction of support vectors. When ν decreases,
a misclassification will have a large impact on the
objective. This can also result in overfitting of the
data. First, ν is adapted from 0.05 to 0.2 in steps of
0.05, since it resembles how many outliers can be
without the class. For the data (Figure 4), this is a
percentage of around 10% for each group. γ is
constrained to a default value by
1/number_features=0.25 (Chih-Chung, 2011).
As we applied the RBF kernel, γ represents the
width of the Gaussian kernel, representing the
boundary to catch all the training data within the
class. Therefore, in a next step ν and γ are adjusted
simultaneously to find the optimal set of hyper
parameters. ν (range 0.05 to 0.2) is adapted in steps
of 0.05 and γ (range 0.1 to 0.7) in steps of 0.15.
We made use of leave-one-out 10-fold cross-
validation (loo-cv) to optimize the model
parameters. Thereby, a comparison of the accuracies
of the models built on each subset is carried out. Due
to the small sample at disposal, a result in term of
best loo-cv error is presented here, as a (necessarily
small) test set would not be very informative.
Moreover, within a small test set there is necessarily
huge variability. The loo-cv error is called the
specificity of the model (true negative rate). After
the model is trained, we can define the sensitivity as
the true positive rate. In other words, how many
abnormal EEG patterns have been found by the
SVM model.
4 RESULTS AND DISCUSSION
Results of the optimization of the four one-class
SVM classifiers are shown in Table 1. For the C3C4
classifier, ν = 0.15 is chosen to be the optimal value.
For the other 3 classifiers, ν = 0.1 gives the highest
sensitivity and specificity. Grid search for optimal
combination of γ and ν by adapting them
simultaneously resulted in the same optimal value
for the model parameter γ (=0.25). Due to the
relatively small sample size, both high sensitivity
and specificity are difficult to obtain. Therefore, we
set the minimum specificity on 70%, considering
that not too many false alarms can be given in case
there is no pathological pattern.
We want to emphasize that we want to detect
patients with lateralized lesions; cases confirmed by
clinical doctors through lesion(s) on MRI images.
For example, lateralized lesions can be
hemimegalencephaly or cases with convulsions.
These cases were found by all four optimized one-
class SVM classifiers. However, there are still some
false negatives in the C3C4 classifier and T3T4
classifier. That is, there exists always three false
negatives for the T3T4 classifier; abnormal patterns
which are not detected (Table 1). Two of these false
negatives are not detected by most T3T4 classifiers.
An explanation could be that one patient has corpus
collosum agenese, what affects more the asynchrony
instead of the asymmetry. The other false negative
has mainly asymmetry in only one frequency band
(theta), which is presumably not picked up by the
classifier as we work with the average over the
different frequency bands (CSI). In fact, clinical
doctors visually detected the lesion on the other
hemisphere on the MRI than they did on the EEG
measurement, indicating it is hard to specify the
lateralization. In addition, one patient with
pathologic asymmetry is never detected by the C3C4
classifier. The pathologic EEG pattern, comparing
the C3 and the C4 channel, is very short compared to
the length of the whole measurement. Moreover, the
lesion is located in the thalamus (=sub cortical),
which is less pronounced in the cortical EEG
signals. Overall, the Fp1Fp2 and the O1O2
classifiers are performing well, all pathologies are
detected.
ICPRAM2014-InternationalConferenceonPatternRecognitionApplicationsandMethods
768

Table 1: Specificity (%) of the four trained one-class SVMs with 10-fold cross-validation. Sensitivity (%) on detecting the
abnormal EEG patterns. For this small sample, we would go for ν =0.15 in case of the C3C4 classifier and ν = 0.1 for the
three other classifiers.
C3C4 Fp1Fp2 O1O2 T3T4
ν
spec sens spec sens spec sens spec sens
0.05 67.12 42.86 (3/7) 61. 72 66.67 (2/3) 74.32 100 (6/6) 64.47 62.5 (5/8)
0.1 71.23 57.14 (4/7) 71.60 100 (3/3) 75.67 100 (6/6) 73.68 62.5 (5/8)
0.15 76.71 71.43 (5/7) 67.9 66.67 (2/3) 75.67 100 (6/6) 68.42 62.5 (5/8)
0.2 68.49 85.71 (6/7) 66.67 66.67 (2/3) 68.92 83.33 (5/6) 61.84 62.5 (5/8)
In future, other classification models can be applied
to this problem, which also take the unbalance
between classes into account. For example, weighted
least squares-support vector machines (LS-SVM)
can be trained (Cawley, 2006). In general, weighted
loss functions are appropriate to balance the
contribution of classes that are not equally
represented. Nevertheless, further improvement of
the applied one-class SVM model is possible by
adding more features into the training phase.
Thereby, we think of asymmetry defined in clinical
papers; a ratio of amplitude difference. Another
possibility is to search more localized in time, in
case of convulsions, instead of calculating features
over the whole EEG measurement. However, this
will probably lead to a higher rate of false positive
detections introduced by short-time artifacts. In
addition, more patients will be incorporated in future
to refine and tune the model. In this way, normal
values for the channel symmetry indexes can be
established, dependent on the physiologic
maturation.
5 CONCLUSIONS
The developed algorithm is a successful strategy to
detect abnormal lateralized lesions in the neonatal
brain. Based on non-invasive EEG measurements,
we can extract useful features to distinguish
physiological from pathological asymmetry.
Therefore, we have used characteristics derived from
the channel symmetry index as input features for a
classifier. Moreover, automated assessment creates
possibilities to look over a longer period of time in
an objective way including the experience of clinical
doctors. Future work will focus on fine-tuning the
algorithm based on a larger dataset, adding clinical
relevant features to the classifier, and trying out
other weighted SVMs. Measuring and analyzing
connectivity in the neonatal brain is of added value
and high interest for the overall assessment in the
Neonatal Intensive Care Units for EEG diagnosis.
ACKNOWLEDGEMENTS
I want to thank M. Signoretto, B. Hunyadi and M.
Milosevic for their valuable discussions. Research
supported by Research Council KUL: GOA MaNet,
PFV/10/002 (OPTEC), several PhD/postdoc &
fellow grants; Flemish Government: FWO: Postdoc
grants, projects: G.0427.10N (Integrated EEG-
fMRI), G.0108.11 (Compressed Sensing)
G.0869.12N (Tumor imaging) G.0A5513N (Deep
brain stimulation) IWT: PhD grants, projects: TBM
070713-Accelero, TBM 080658-MRI (EEG-fMRI),
TBM 110697-NeoGuard iMinds: SBO dotatie 2013,
ICONs: NXT_Sleep, FallRisk Flanders Care:
Demonstratieproject Tele-Rehab III (2012-2014)
Belgian Federal Science Policy Office: IUAP P719/
(DYSCO, `Dynamical systems, control and
optimization', 2012-2017); ESA AO-PGPF-01,
PRODEX (CardioControl) C4000103224 EU:
RECAP 209G within INTERREG IVB NWE
programme, EU HIP Trial FP7-HEALTH/ 2007-
2013 (n° 260777), EU MC ITN TRANSACT 2012
(n° 16679), ERC Advanced Grant: BIOTENSORS
(n° 39804), ERASMUS EQR: Community service
engineer (n° 539642-LLP-1-2013).
REFERENCES
Cawley, G. C., 2006. Leave-One-Out Cross-Validation
Based Model Selection Criteria for Weighted LS-
SVMs. In IJCNN, IEEE: p. 1661-1668.
Chih-Chung Chang and Chih-Jen Lin, LIBSVM : a library
for support vector machines. In ACM Transactions on
Intelligent Systems and Technology, 2: 27:1--27:27,
2011. Software available at http://
www.csie.ntu.edu.tw/~cjlin/libsvm.
Fourie, C., van Niekerk, A., Mucina, L., 2011. Optimising
DevelopmentofanInterhemisphericSymmetryMeasurementintheNeonatalBrain
769

a one-class SVM for geographic object based novelty
detection. In Proceedings of the first AfricaGeo
conference. Cape Town, South Africa: p. 1-25.
Hayashi-Kurahashi, N., Kidokoro, H., Kubota, T. et al.,
2012. EEG for predicting early neurodevelopment in
preterm infants: an observational cohort study. In
Pediatrics, 130: p.891-897.
Hellström-Westas, L., Klette, H., Thorngren-Jerneck, K.,
et al., 2001. Early prediction of outcome with aEEG in
preterm infants with large intraventricular
hemorrhages. In Neuropediatrics, 32: p. 319-324.
Hellström-Westas, L. and Rosén I., 2005.
Electroencephalography and brain damage in preterm
infants. In Early Human Development, 81: p. 255-261.
Holmes, G. and Lombroso, T., 1993. Prognostic value of
background Patterns in the neonatal EEG. In Journal
of Clinical Neurophysiology, p. 323-352.
Hunyadi, B., De Vos, M., Signoretto, M., et al., 2011.
Automatic Seizure Detection Incorporating Structural
Information. In Artificial Neural Networks and
Machine Learning–ICANN, 6791: p. 233–240.
Hunyadi, B., De Vos, M., Van Paesschen, W., et al., 2010.
A mimicking approach for human epileptic seizure
detection. In Proc. of the International Biosignal
Processing Conference. Berlin, Germany: p. 1-4.
Koolen, N., Jansen, K., Vervisch, J., et al., 2013.
Automatic burst detection based on line length in the
premature EEG. In Proc. of the 6
th
International
Conference on bio-inspired systems and signal
processing (BIOSIGNALS). Barcelona, Spain: p. 105-
111.
Le Bihannic, A., Beauvais, K., Busnel, A., et al., 2012.
Prognostic value of EEG in very premature newborns.
In Arch Dis Child Fetal Neonatal, 97: p.106-109.
Okumura, A., Hayakawa, F., Kato, T., et al., 2002.
Developmental outcome and types of chronic-stage
EEG abnormalities in preterm infants. In
Developmental Medicine and Child Neurology, 44: p.
729-734.
Palmu, K., Wikström, S., Hippeläinen, E., et al., 2010.
Detection of ‘EEG bursts’ in the early preterm EEG:
Visual vs. automated detection. In Clinical
Neurophysiology, 121: p. 1015-1022.
Schölkopf, B., Smola, A. J., Williamson, R. C., et al.,
2000. New Support Vector Algorithms. In Neural
Computation, 12: p. 1207-1245.
Schölkopf, B., Platt, J.C., Shawe-Taylor, J., et al., 2001.
Estimating the Support of a High-Dimensional
Distribution. In Neural Computation, 13: p. 1443-
1471.
Smyser, C. D., Inder, T. E., Shimony, J.S., et al., 2010.
Longitudinal analysis of neural network development
in preterm infants. In Cerebral cortex, 20: p. 2852-
2862.
Vanhatalo, S. and Kaila, K., 2006. Development of
neonatal EEG activity: from phenomenology to
physiology. In Seminars in fetal & neonatal medicine,
11: p. 471-478.
Van Putten, M. and Tavy, D., 2004. Continuous
Quantitative EEG Monitoring in Hemispheric Stroke
Patients Using the Brain Symmetry index. In Stroke,
35: p. 2489-2492.
Vecchierini, M. F., André, M., d’Allest, A. M., et al.,
2007. Normal EEG of premature infants born between
24 and 30 weeks gestational age: Terminology
definitions and maturation aspects. In Clinical
Neurophysiology, 37: p.311-323.
ICPRAM2014-InternationalConferenceonPatternRecognitionApplicationsandMethods
770
