
Searching of Correlation of Weather and Cardiologic Events
Computer Methods for Relation Discovery and Events Prediction
Błażej Zyglarski
1
, Piotr Bała
2
and Jeremi Mizerski
2
1
Faculty of Mathematics and Computer Science, Nicolaus Copernicus University, Toruń, Poland
2
Interdisciplinary Centre for Mathematical and Computational Modelling, Warsaw University, Warsaw, Poland
Keywords: Weather Influence, Cardiologic Events, Prediction, Events and Trends Detection, Self Organizing Maps.
Abstract: This paper presents our recent research on finding correlation between weather events and medical
(cardiologic) events and trends. Such correlation is intuitive, however no solid proof exists. Such correlation
was investigated, but it most cases it drives to conclusion that differences are visible in large periods of time
(like year seasons, winter for example). We are trying to show, that such correlation is visible in much
shorter time periods (as couple of days) with unusual weather behaviour). We examine standard statistical
methods, advanced events and trend detection methods and neural networks (self organizing maps) usage.
We propose basic scenarios for medical events frequency increase prediction, according to weather
forecasts.
1 INTRODUCTION
It is common knowledge that weather is influencing
people’s life. Correlation between atmospheric
pressure, high humidity, temperature and any human
wellbeing is strongly intuitive but still difficult to
prove with professional study, especially with
standard statistical methods.
In previous studies, like (Gerber et al., 2006 or
Klot et al., 2012, or Palmisano et al., 2013 such
correlation was investigated, but it most cases it
drives to conclusion that differences are visible in
large periods of time (like year seasons, winter for
example). We are trying to show, that such
correlation is visible in much shorter time periods
(as couple of days) with unusual weather behaviour).
Such task is difficult, because the data on
specific medical events are very rare and cannot be
tested by conventional statistical methods.
In this paper we present that advanced approach
(including neural networks driven analysis as well as
trends and events detection algorithms) could
distinguish tangent points in timeline where
correlation between health and weather parameters
is visible.
Finally, we have developed methods for
prediction risk of selected medical events using
weather forecast.
Presented research is based on the anonymized
medical data coming from two hospitals from south-
east Poland (Zamość, Białystok), containing
hospitalization and diagnosis data of cardiovascular
patients treated from 2005 to 2008. This data was
correlated with recorded weather ratings and
numerical weather forecasts.
Main purpose of this paper is to prove that such
event correlation is possible and present our plans to
develop reliable methods for prediction of increase
of cardiac events occurrences frequency.
Analysed data was very small dataset, what also
influences our results. Unfortunately acquiring
medical data is not an easy task. We hope to expand
our test with more datasets all over the world.
2 DATA STRUCTURE
Acquired medical data is very simple. Medical event
consists of 4 fields: inpatient id (anonymous),
admission date, discharge date and diagnosis type.
Type of diagnosis is defined explicitly by a closed
dictionary.
Database contains 4089 records from 2001 to
2012. Example medical data is shown in Table 1.
529
Zyglarski B., Bała P. and Mizerski J..
Searching of Correlation of Weather and Cardiologic Events - Computer Methods for Relation Discovery and Events Prediction.
DOI: 10.5220/0004922805290534
In Proceedings of the International Conference on Health Informatics (HEALTHINF-2014), pages 529-534
ISBN: 978-989-758-010-9
Copyright
c
2014 SCITEPRESS (Science and Technology Publications, Lda.)

Table 1: Example medical data records.
ID Admission Date
Discharge
Date
Diagnosis
Type
1 2001-07-29 18:45 2001-08-01 L25.1
2 2001-08-09 15:23 2001-08-12 L25.1
Historical weather data was provided with one
hour accuracy. Each record consists of 5 columns:
record date and time, humidity (percentage),
temperature (in Kelvin), cloudiness (0..1) and
pressure (in Pascal). Example records are shown in
Table 2.
Table 2: Example weather data records.
Record Date
Humidity
(%)
Temperature
(K)
Cloudin
ess
Pressure
2005-01-01 00:00 92.12 273.75 0.29 102224
2005-01-01 01:00 92.25 273.12 0.17 102142
2005-01-01 02:00 92.25 272.50 0.07 102109
2005-01-01 03:00 92.25 272.00 0.04 102084
2005-01-01 04:00 92.50 271.62 0.07 102072
2005-01-01 05:00 92.87 271.37 0.10 102057
There were less than 0.5% of incomplete records.
Missing entries were completed as an average of
neighbouring entries.
Due to the response time of organisms to
changes in weather conditions affected by the
patients decision to call emergency or enter hospital,
we assumed that sufficient granularity of the data is
of one day. Therefore for the further analysis we
have used weather parameters averaged over the
day. Despite this reduction one can still observe
significant changes in the weather parameters.
Example average data is shown in Table 3.
Table 3: Example average weather data records.
Record Date
Humidity
(%)
Temperature
(K)
Cloudiness Pressure
2005-01-01 90.72 274,40 0.64 97700
2005-01-02 85.56 275,19 0.65 97078
2005-01-03 85.29 273,31 0.40 97326
2005-01-04 91.46 274,83 0.89 96991
2005-01-05 86.61 276,44 0.65 97549
2005-01-06 89.76 274,67 0.67 97810
The analysis consisted of two phases. The first
one was to determine the extraordinary events
occurring in a stream of weather data. Second phase
was to analyse medical events and align them with
the discovered weather events.
3 WEATHER DATA ANALYSIS
To determine the extraordinary events occurring in a
stream of weather data the modified algorithms
composed of chi-square tests or "Gaussian
algorithm" and adaptive thresholding has been used
(Engel, Whitney and Cramer 2010).
3.1 Adaptive Events Detection
Algorithm
The Adaptive Events Detection Algorithm analyzes
the successive values of the weather parameter,
comparing them with the previous values within
moving time window. In our approach the time
window has a length of 10 days. One step of analysis
is visualized on Figure 2.
Figure 2: Time window examined with events detection
algorithm against.
In each time step
the event factor
is
computed, according to the previous time window.
1
∑
∑
(1)
∑
1
1
(2)
If the event factor is high enough, the time step is
considered as event occurrence time. This method
allows to detect important changes to weather inside
analysed time window. Results are independent from
the general weather outside a time window, such as
weather season and it focuses on the unique change
in a shorter time period.
3.2 Algorithm Results
In contrast to the standard statistical methods events
detection algorithm allows for more accurate
diagnosis by rejecting a lot of points detected by
searching for local maxima (method 1) or for points
that are above a certain threshold (taken threshold
was half of maximum value in some time period).
Example events detected by the mentioned
methods are shown on Figure 1.
As one can see, the adaptive events detection
algorithm selects much less points than other
HEALTHINF2014-InternationalConferenceonHealthInformatics
530
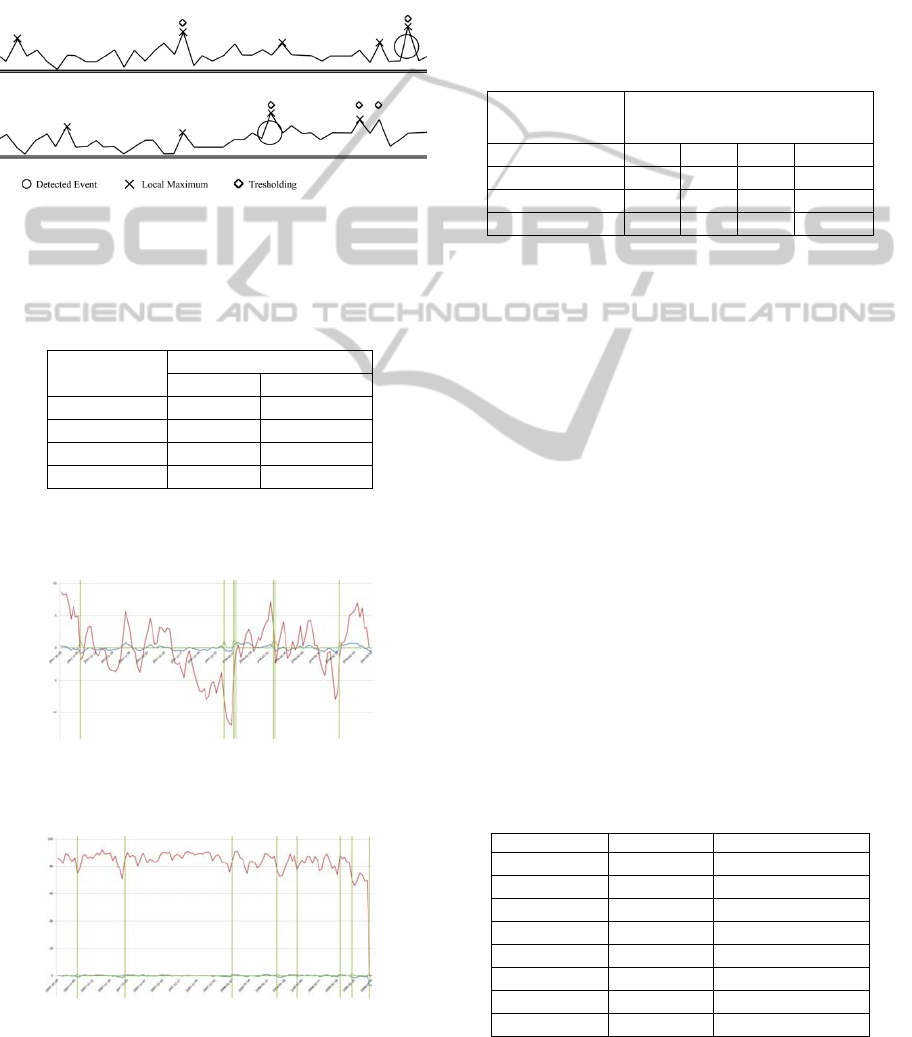
presented methods, what suggests that those points
can be more significant in weather change data
stream. It misses irrelevant points, which were
results of small weather changes in other methods.
Such computation is performed for all 4 kind of
weather parameters. In the considered time there
was significant amount of 416 events discovered,
listed in Table 4.
Figure 1: Example events detected with three methods: 1)
Local Maxima (upper circle), 2) Treshold (middle cross)
and 3) Adaptive Events Detection (bottom big circle) in
data stream.
Table 4: Example weather data records.
Parameter
Number of Events
Increase Decrease
Humidity 111 103
Temperature 51 60
Pressure 23 20
Cloudiness 22 26
Figures 2-4 visualize example events detected for
temperature, cloudiness and humidity data.
Figure 2: Events Detected in Temperature Data between
October 2007 and March 2008.
Figure 3: Events Detected in Humidity Data between
October 2007 and March 2008.
Table 5 shows the results of the quantitative
detection of events related to changes in pressure
using thresholding algorithms (items significantly
different from the average found for the event), the
designation of local maxima used in this study, event
detection methods.
Results presented in Table 5 confirm that
repurpose algorithm selects the events with greater
caution, suggesting a better quality of results.
Table 5: Events detection methods comparison.
Type of
algorithm
Number of events detected
Year 2005 2006 2007 1,2.2008
Tresholding 177 176 155 47
Local Maxima 91 91 101 18
Events detection 58 64 63 18
4 MEDICAL DATA ANALYSIS
Because the purpose of our research is to show, that
there is relation between medical events and
weather, our data analysis is divided into two
phases. First one is to allocate time intervals, where
unusual amount of cardiologic events occurred.
Then we have checked if inside those time intervals
some events occurred.
4.1 Allocating Time Intervals
The standard approach bases on an analysis of the
number of selected medical events detected in some
period of time. It examines some predefined periods
of time (for example one week or one day). In such
approach boundary events cluster can be missed. It
does not allow to detect all unusual clusters of
events. An example of such events is shown in Table
6. The statistical analysis with one week time
window is shown in Table 7.
Table 6: Example medical events.
Week Day of week Number of Events
1 2 1
1 3 1
1 5 1
2 6 2
3 1 3
4 1 1
4 3 1
4 6 1
SearchingofCorrelationofWeatherandCardiologicEvents-ComputerMethodsforRelationDiscoveryandEvents
Prediction
531
As shown in Table 6 there is nothing statistically
interesting in the presented time period. Although, in
the end of week 2 and begin of week 3, there was 5
events, which should be noticed as unusually high
density of events.
Table 7: Example number of events with one week time
window.
Week
Number of
Events
1 3
1 2
1 3
2 3
Capturing this density would require statistics for
different sizes of time windows (week / month ...)
and shift their origins. Such an approach would be
very inefficient. At the same time problem which
window size is most correct occurs.
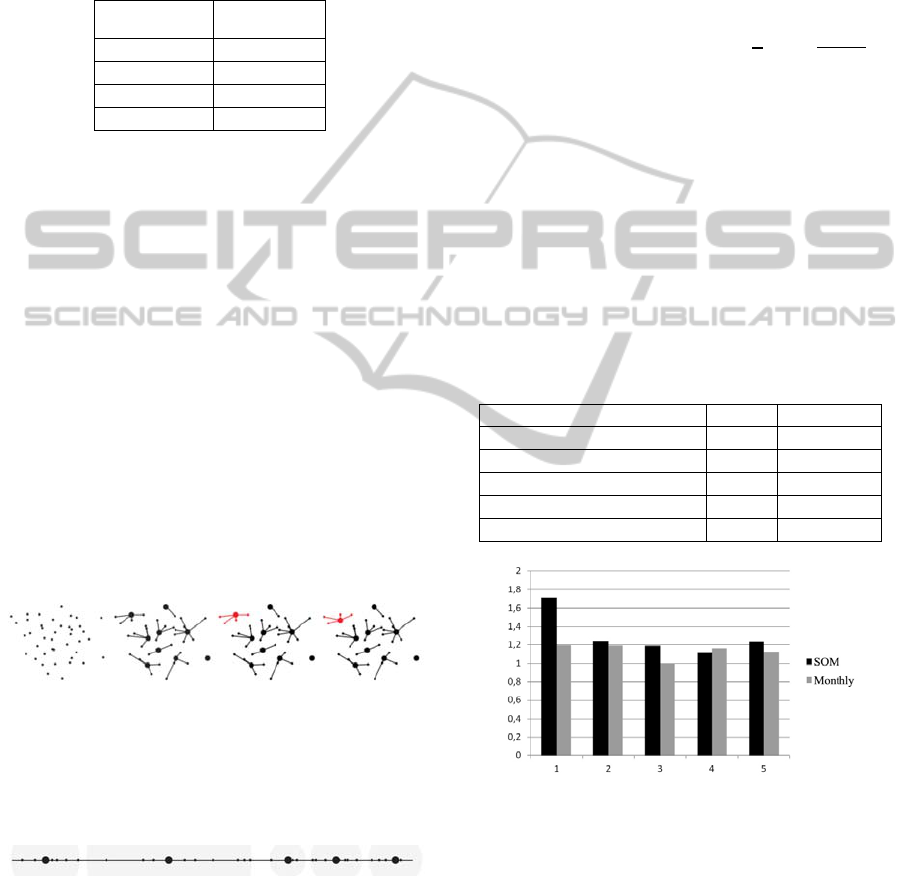
4.1.1 SOM
In order to determine the location of higher density
of events we have looked for event clusters, using
self-organizing maps (Kohonen neural network),
developed as a set of approximation algorithms.
SOM network performs a random initial
distribution of objects and then performs a number
of iterations of the initial allocation weightings. A
prototype matching the innermost part is assigned to
the each of the subsets. Prototypes are adjusted in
each iteration step. When a node consists only with a
prototype, it is removed.
Figure 4: Example 2- dimensional SOM steps.
The space was one-dimensional and the distance
d between the events was considered as the time
between them.. The event here is the admission to
the hospital.
Figure 5: Example of 1- dimensional SOM clusters.
SOM scenario is as following:
1) For each node choose random prototype of the
category.
2) For each node clean set of contained events.
3) For each record find node with closest
prototype and add this event to set of events for this
node.
4) For each node compute generalized median of
its prototype and contained events. Set it as new
prototype.
5) Repeat from 2) until network is stable.
A generalized median is defined as an element s
which minimizes a function:
∑
,
.
Our SOM started with
√
√
4089
64clusters. Such starting cluster number
approximation is good approximation, according to
our research with textual documents comparison
(Zyglarski B.). Self-organizing, unattended Kohonen
neural network divided the whole set into 26 subsets
representing intervals. This means that the 38
subsets were removed during the operation of the
network.
In the analyzed period, the frequency of events is
1.019 per day. Clusters with events frequency higher
than average were considered as unusual. Those
clusters are listed in Table 8.
Table 8: Unusual Time Clusters.
Time interval Events Frequency
2008-01-08 - 2008-01-15 22 1,714286
2006-02-16 - 2006-04-19 77 1,241935
2006-08-22 - 2006-10-30 82 1,188406
2007-11-07 - 2007-12-30 59 1,113208
2006-11-29 - 2007-02-14 95 1,233766
Figure 6: Unusual Time Clusters frequency (black) in
comparison to the frequency of surrounding months
(gray).
Periods selected in this procedure comprise about
8% of all events. At the same time it can be seen that
the statistical analysis of the surrounding intervals
do not show different frequency of the events.
Figure 6 shows comparison of the frequency of
occurrences of the event at designated time intervals
with the surrounding months.
HEALTHINF2014-InternationalConferenceonHealthInformatics
532
4.2 Events in Unusual Time Intervals.
Events hospitalization in the selected intervals are
grouped in the four days in length. Hospitalization
factor is considered as a sum of number of
hospitalizations in the time window.
This follows from the assumption that weather
event causes a series of medical events. The rate in
the sample period is shown on Figure 7.
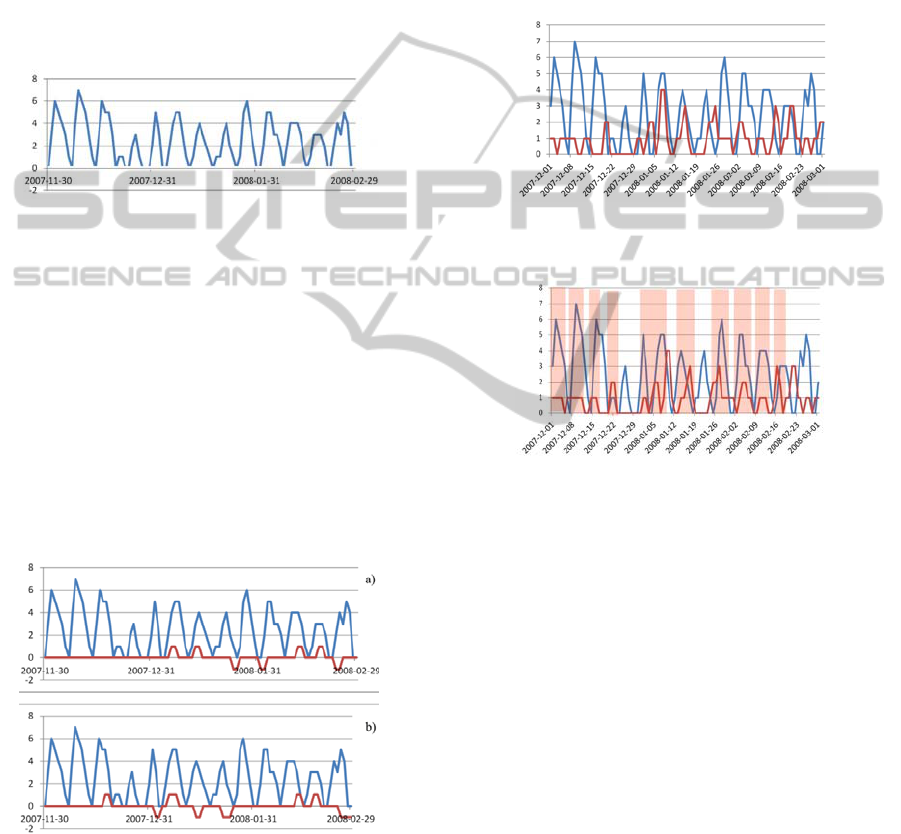
Figure 7: Number of hospital admissions in the selected
period of time.
5 CORRELATION ANALYSIS
We have looked for the correlations between
weather events and hospitalizations, precisely
hospital admissions related to the cardiac problems.
Examples of such correlation are shown in Figure 8.
Some of the cardiac events are not related to the
weather, but it can be seen that medical events occur
more frequently where weather changes are
detected.
Figure 8: Example correlation between hospital
admissions and a) humidity, b) temperature events.
Weather events are shown as a graph. The chart
has a value of 0 when there has been no event, 1 if
the event was due to significant increase in the value
of the parameter and -1 if the event was due to
significantly reduce the value of the parameter. The
time period presented is from 1 December 2007 to
28 February 2008 which corresponds to the time
with highest density of the cardiac events.
Correlation is most visible in the Figure 9
showing the general relationship of all weather
events and hospitalization events. In most cases, a
significant increase in the number of hospitalization
is associated with more than one type of weather
events. On the Figure 9 event values are presented as
number of event types at the moment.
Figure 9: Correlation between hospitalizations factor
overall weather events.
Figure 10: Correlation chart for two time windows. The
medical data is shifted in time by 3 days to emphase
correlations. Overlapping elements are selected.
The correlation between weather and health events
can be seen better if 3-days shift of medical data is
applied. In many places, the correlated rise in
weather events and hospitalization is visible.
Directly after occurrences of weather event, there is
increase of the number of the hospital admission due
to the cardiologic problems.
Such relationship was not possible to detect
using standard statistical methods, because the
analyzed data were too sparse.
The introduced solution allows to spot
relationships and opens the possibility of prediction
of increased number of cases on the basis of
forecasts.
6 PREDICTION PROCEDURE
The analysis showed that it is possible to look for
the relationship between the registered values of
SearchingofCorrelationofWeatherandCardiologicEvents-ComputerMethodsforRelationDiscoveryandEvents
Prediction
533

weather parameters and hospitalizations due to the
cardiac problems. The question of big practical
value is if one can find such a relationship between
hospitalization and data obtained from the numerical
weather forecasts.
We have compared several time periods of actual
weather parameters measured and weather forecast
which was prepared for a period of time.
We have used numerical weather forecast
provided by Interdisciplinary Centre for
Mathematical and Computational Modelling,
because of its high reliability (Figure 11).
Figure 11: Reliability of the numerical weather forecast
provided by the ICM (source www.meteo..pl) - chart for
the 86h prediction of the pressure values.
Figure 12: Forecasted and measured data (Temperature
(K)).
Figure 12 shows the actual and predicted values
for the first two weeks of 2008. This period was
marked by a Kohonen network and the recorded
values of weather parameters here are two
significant events.
Although the data from weather forecasts differs
from the actual data, there is a great similarity
between both graphs. For this reason, it is likely
concluded that the weather event points may be
determined based on the forecast. Therefore it is
possible to determine the risk of increased morbidity
and cardiac symptoms.
7 CONCLUSIONS
We have analyzed basic weather parameters and
correlated them with the hospital admissions due to
the cardiac problems. Using advanced methods we
have show existing correlations and present that
particular weather events cause increased risk of
cardiac related hospitalizations. The proposed
method allows to deal with the rare events and
correlate them to for example weather changes. This
method will be significantly improved with the use
of larger number of medical records. Based on data
from two hospitals and one region of Poland we
achieved encouraging results. These results,
however, should still be checked in at least a few
other regions to confirm the correctness of methods.
REFERENCES
Engel, D., Whitney P., Cramer N. 2010. Events and
Trends in Text Streams, In Text Mining. Applications
and Theory. John Wiley & Sons, Ltd.
Kohonen, T. (1998). The self-organizing map. Neurocom-
puting, 21(1-3):1–6.
Cavnar, W. B. and Trenkle, J. M., 1994. N-gram-based
text categorization. In Proceedings of SDAIR-94, 3rd
Annual Symposium on Document Analysis and Infor-
mation Retrieval, pages 161–175, Las Vegas, US.
Kohonen, T., Somervuo, P., 2002. How to make large self-
organizingmaps for nonvectorial data. Neural
Networks, 15(8- 9):945-952.
Finnoff, W., Zimmermann, H. G., 1994 Detecting
structure in small datasets by network fitting under
complexity constraints. In Proceedings of the
workshop o n Computational learning theory and
natural learning systems (vol. 2) : intersections
between theory and experiment, pages 113-131,
Cambridge, MA, USA. MIT Press.
Rojas R., 1996. Neural Networks: A Systematic
Introduction. Springer.
Gerber Y., Jacobsen S.J., Killian J. Weston S., Roger V.,
Seasonality and Daily Weather Conditions in Relation
to Myocardial Infarction and Sudden Cardiac Death
in Olmsted County, Minnesota, 1979 to 2002, m Coll
Cardiol. 2006;48(2):287-292.
Palmisano, P., Accogli M., Zaccaria M., Vergari A., De
Luca De Masi G., Negro L., De Blasi S,. Relationship
between seasonal weather changes, risk of
dehydration, and incidence of severe
bradyarrhythmias requiring urgent temporary
transvenous cardiac pacing in an elderly population,
International Journal of Biometeorology 2013.
Gerber Y., Jacobsen S.J., Killian J. Weston S., Roger V.,
Seasonality and Daily Weather Conditions in Relation
to Myocardial Infarction and Sudden Cardiac Death
in Olmsted County, Minnesota, 1979 to 2002, m Coll
Cardiol. 2006;48(2):287-292.
Zyglarski B., Genetic algorithms and dynamic neural
networks in data categorization, Artificial intelligence
methods : selected issues / scientific ed.: Andrzej
Piegat and Barbara Królikowska S. 39-50The
University of Szczecin, 2010.
Klot S., Zanobetti A., Schwartz, J., Influenza epidemics,
seasonality, and the effects of cold weather on cardiac
mortality, Environmental Health 2012, 11:74.
240
260
280
300
135791113
Forecast
Records
HEALTHINF2014-InternationalConferenceonHealthInformatics
534
