
Quantitative Study on a Multiscale Approach for OCT Retinal Layer
Segmentation
A. Gonz
´
alez, C. Ortigueira, M. Ortega and M. G. Penedo
Department of Computer Science, University of A Coru
˜
na, A Coru
˜
na 15071, Spain
Keywords:
OCT Retinal Images, Layer, Segmentation, Graph, Multiscale, Pyramidal.
Abstract:
OCT technique for retinal imaging is establishing itself as a relevant modality among ophthalmologists due
to its capacity to show more information than classical modalities. Nowadays, most image processing-based
applications are emerging to extract that information automatically. As previous step of any automatic method
to extract features from these images, the segmentation of the retinal layers has to be done. Graph-based me-
thods provide good results for this problem, although their efficiency is an important limitation. In this work,
a multiscale or pyramidal-based approach is studied in order to solve this problem. Different configurations
are proposed to determine the optimal method. It is remarkable that this approach means an improvement not
only in computation time, but also in segmentation results.
1 INTRODUCTION
Optical Coherence Tomography (OCT) images from
the retina are used by experts to diagnose diseases,
since their capture consists in a contact-less, non-
invasive method that gives a cross sectional image
of the retina in a real time fashion(Puzyeyeva et al.,
2011). OCT provides information of the morphology
in the retina in an effective way and it is useful to ex-
plain disease pathogenesis and heralding disease pro-
gression. In the recent years OCT has progressed, be-
ing the Spectral-domain (SD) OCT the current tech-
nique that ophthalmology experts use in their clinical
practice because of its extremely high sensitivity and
image-acquisition speed.
Several diseases can be diagnosed analyzing the
OCT retinal images, some of them associated to hu-
man eye, such as glaucoma(Bowd et al., 2000), ma-
cular degeneration (Keane et al., 2012) and diabetic
retinopathy(S
´
anchez-Tocino et al., 2002); but also di-
seases like multiple sclerosis(Albrecht et al., 2012),
whose presence is strongly correlated with high-speed
retinal thinning. In fact, several pathologies affect to
the retinal layer morphology, so its appropriate seg-
mentation is essential as a previous step in any diag-
nosing process.
The problem of the retinal layers segmentation has
been studied using different approaches. One of the
most effectives methods is that proposed in (Haeker
et al., 2007), where the segmentation task is trans-
formed into that of finding the minimum-closed-set
in a geometric graph. Even though dynamic pro-
gramming is proposed in (Chiu et al., 2010), the main
problem in these approaches is the time required for
graph computation. The fast graph-based method pre-
sented in (Garvin et al., 2009) introduces the idea of a
multiscale algorithm, showing that the idea of a pyra-
midal approach, used in several fields, seems effective
in this kind of problems.
At the present time, several graph-based ap-
proaches to this task can only work off-line, making
them not useful for the ophthalmologists in their
everyday clinical practice. For the faster and more
effective techniques, there is not any quantitative
study of the improvements in performance than can
be achieved in this problem. Therefore, establishing
where the efficiency can be improved in this task is
essential and this is what this work aims for, also
showing that it is useful not only to reduce the pro-
cessing time, but also to avoid segmentation mistakes.
The aim of this paper is, therefore, presenting an
multiscale approach for the layer segmentation algo-
rithm based on the min-graph-cut. For that purpose, a
pyramidal structure is built based on the original OCT
image, and after studying the optimal parameters to
design it, a study of time and memory efficiency is
presented. Different ways to tackle this approach are
evaluated too. The layers that have been included in
this work are the top boundaries of the Internal Li-
miting Membrane (ILM) and bottom boundary of the
715
González A., Ortigueira C., Ortega M. and G. Penedo M..
Quantitative Study on a Multiscale Approach for OCT Retinal Layer Segmentation.
DOI: 10.5220/0004925107150723
In Proceedings of the 6th International Conference on Agents and Artificial Intelligence (ICAART-2014), pages 715-723
ISBN: 978-989-758-015-4
Copyright
c
2014 SCITEPRESS (Science and Technology Publications, Lda.)

Retinal Pigment Epithelium (RPE). In the text that
follows, these layers will be referenced as layers 1
and 6. These layers have been chosen because they
are the first to be segmented in several automatic me-
thods applied on the retinal images, because they are
which delimit the main part of the retina. In addi-
tion, they present different characteristics: the first
one is evidently visible in the images, while the se-
cond one presents more difficulties, given that the se-
paration between the RPE and the choroid is not al-
ways clear, besides the ruptures or discontinuities that
can be found on the RPE. The approach presented in
this work can be adapted to segment the rest of the
layers of the retina.
This paper is organized as follows: In section 2, a
review of the graph-based segmentation is presented
and section 3 introduces the multiscale (or pyrami-
dal) approach. In section 4 experimental results are
shown, with a deep study in the configuration which
optimizes the levels in the pyramidal approach and,
finally, section 5 offers conclusions and future work.
2 GRAPH-BASED LAYER
SEGMENTATION
Graph-based approach transforms the problem of seg-
mentation into that of finding the minimum closed
set in a geometric graph. This graph satisfies some
smoothness and interaction constraints. The idea is
mapping each pixel in the image to a node in the
graph. The graph search is guided by some cost
functions extracted from the image in order to find
its minimum cut. The cost value is assigned to
each node, provided by the cost functions designed
previously and applied to the image. Therefore, nodes
that determine the minimum cut in the graph will co-
rrespond to pixels in the image that are interesting to
be found; in this case, those corresponding to the layer
that is being searched.
As a synthesis of this methodology, Figure 1
shows the phases required to tackle the segmentation
of generic a layer: Firstly, a preprocessing to enhance
and prepare the image (original images are bounded
by black square that must be automatically excluded);
after that, the segmentation itself, based on the graph
searching exposed before and finally, the representa-
tion of the layer over the image.
Applying cost functions
Graph building
Min-cuts searching
Figure 1: Main phases of the graph-based methodology.
It is necessary to consider that sometimes, the in-
formation that can be extracted from the image is not
enough, so adding information from adjacent ima-
ges in an OCT sequence could improve the perfor-
mance of the method. This is possible because the
graph can be designed to perform a 2-D or 3-D geo-
metric searching. Thus, in the 3-D approach, a layer
is segmented in an image considering not only va-
lues from cost functions applied to it, but also the
cost values from the adjacent images in the OCT se-
quence. This capability is useful in the case that the
layer presents discontinuities or low definition in the
image. Although the 3-D model seems to be the best
approach in the case of sequences of OCT images (al-
ways considering an appropriate number of images
per sequence), the main problem is the time required
for computation in the graph search. The pyramidal
structure can be also built in these situations in order
to reduce it.
Regarding the phases in the methodology, the
multiscale approach involves modifications in the seg-
mentation stage. As it was exposed, information ex-
tracted by the cost functions is used to guide the
graph searching. Therefore, these functions must be
suitably designed to reflect relevant information, in
this case, edges location and intensity distribution in
the image. In this work, not only cost functions from
(Haeker et al., 2007) and (Gonz
´
alez et al., 2013) are
included, but also additional terms that are needed in
some levels of the pyramid, as Section 3.2 presents.
Synthetically, the cost functions considered are the
following:
Edge-based functions, obtained using Sobel op-
erator with a previous Gaussian filtering and a non-
maximum suppression, to extract dark-to-light ( f
edge
)
and bright-to-dark ( f
edge
0
) transitions. Gradient dis-
tance f
g
is also considered, taking a distance f
d
as
value between adjacent pixels. Terms f
α
and f
β
select
the first and last edge in the image, respectively, using
thresholds t
α
and t
β
, whose definition is extended in
this work, to consider limits t
β
min
and t
β
max
. Term f
γ
erase very close edges in the same column with diffe-
rent direction, while f
Z
erase those with the same one.
A new term f
X
is added in this paper, penalizing the
first edge on the image (useful for layer 6 detection).
Intensity-based functions: f
δ
and f
ε
encourage
pixels with bright areas above and below, respectively.
Term f
ζ
uses similar information to f
δ
but encourag-
ing regions on the bottom part of the image. In order
to consider dark areas above instead of bright ones, f
0
ζ
is used.
ICAART2014-InternationalConferenceonAgentsandArtificialIntelligence
716
3 PYRAMIDAL APPROACH
As it was introduced before, the aim of this work
is presenting a deep study of a multiscale approach
for the graph-based segmentation algorithm, with the
purpose of reducing the computation requirements in
terms of time and memory. It is based on building
a pyramid for each OCT image, where its levels are
smaller versions of the original image. The main idea
is that the layer segmented in lower resolution ima-
ges is used in the original one to reduce the area of
searching of the graph-based algorithm. Improvement
is mainly given by the fact that, for smaller images,
smaller graphs are generated to apply the minimum
cut algorithm and as the problem in a single-scale has
not a linear complexity, linear changes in its dimen-
sions (image size, and therefore, graph size) provide
even bigger changes in performance.
In this context, the pyramid is a hierarchical struc-
ture consisting of the images resulting of applying
certain functions on the original one, whose dimen-
sions are reduced with each transformation. The ori-
ginal (and larger) image is the base of the pyramid,
and the successive levels are the resulting images of
these transformations. Thus, pyramidal basis con-
forms the level i = 0, whereas the peak corresponds
to the level i = h − 1, with h the pyramid height.
The construction of this pyramidal structure is the
first step in this method and it can be considered as an
ascent over the pyramid. Once the original image size
has been reduced, according to certain scale factor sc,
and the different levels of the pyramid have been built,
it is possible to descend it. In this descending pro-
cess, the layer detected in the level above is used in
the current level to bound the area of searching, so
the graph-based method is applied in a smaller image.
Both ascending and descending processes involved in
the pyramidal approach are reflected in Figure 2.
Downsampling
Bounding area
of searching
and segmentation
S
S = * sc
1
0
S
0
S = * sc
2
S
1
S = * sc
3
S
2
Figure 2: Schema for pyramidal algorithm. At each level i,
image size S
i
is obtained applying the scale factor sc to its
dimensions in level i − 1.
3.1 The Pyramidal Ascent
The loss of information caused by the resolution re-
duction must be considered in the ascending process,
because at the time that pyramidal height increases, it
is more accused. Therefore, it determines the pyra-
midal height, since the location of the layers becomes
more difficult as the structure is ascent. Even though
a precise segmentation in the middle levels is not
needed, information in the image should be enough
to obtain an appropriate detection.
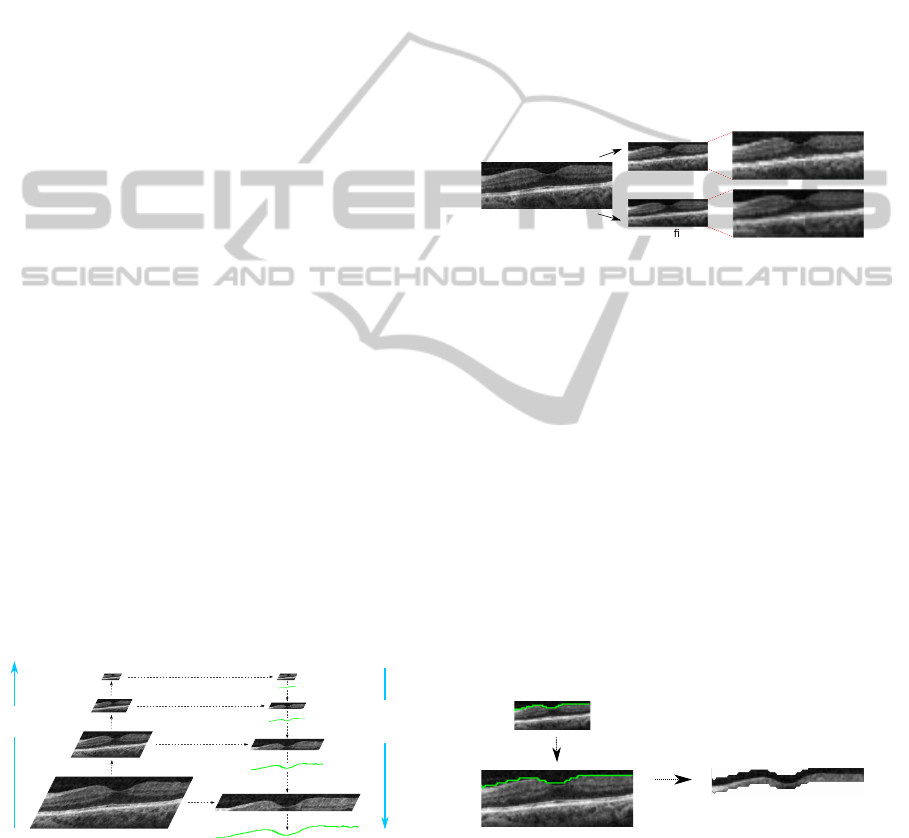
In order to minimize the loss of information, the
transformation applied to the images to generate the
upper level includes not only a sub-sampling, but
also a previous low-pass filtering, making possible
that each pixel in the reduced image is influenced
by the information of its neighbors. Difference be-
tween results obtained with this process and only sub-
sampling are presented in Figure 3.
Subsampling
Low-pass ltering
+
Subsampling
Figure 3: Image obtained during an ascent step using only
a sub sampling process and that with a previous low-pass
filtering. Zoom has been applied to make the difference
more appreciable.
3.2 The Pyramidal Descent
Regarding the descending stage, two basic tasks are
needed in each level of the pyramid: firstly, the area
of searching is delimited in the current image using
the segmentation obtained in the level immediately
above (the image is cut and a mask is built based
on that, considering flexibility thresholds t
sup
and
t
in f
), allowing to exclude irrelevant areas in the OCT
image. Then, the graph-based method is applied to
segment the layer in this level. As the area of interest
has been reduced, the number of nodes in the graph
is now lower and, therefore, computing time too. The
process is reflected in Figure 4.
Extrapolation
Bounding area
Figure 4: Bounding the area of searching: Layer 1 detected
in the image immediately above is extrapolated to the image
in the current level and the area of searching is bound.
Once the area of searching is determined and the
cost functions have been applied, the graph-based al-
gorithm is used to detect the layer of interest. This
entire process is repeated from the peak of the pyra-
mid (where the area of searching is the whole image,
QuantitativeStudyonaMultiscaleApproachforOCTRetinalLayerSegmentation
717

with reduced dimensions) to its base, where the final
layer is detected in the original OCT image.
When using a 3-D model, the process is analo-
gous: pyramid is built with 3-D OCT images, and
the layer is detected in all of them during the descent
stage. In the base of the structure, only the layer seg-
mented in the central image of the group is preserved,
since it has the contribution of its adjacent images.
4 RESULTS AND DISCUSSION
Different experiments have been designed in order to
find the best pyramidal structures for the segmenta-
tion of first and sixth layers and compare its results
with those obtain with the original graph-based seg-
mentation method. The data set used in the experi-
ments is composed by 18 OCT sequences, including
both healthy and diabetic retinopathy patients. Each
sequence consists of 128 images, which makes a total
of 2304 images.
These images were captured using Cirrus HD-
OCT, with Spectral Domain Technology (Zeiss), at
a resolution of 334x334 pixels. All the results have
been obtained using an Intel Core TM 2 Duo proces-
sor (2,4 GHz) and a RAM of 2 GB.
Three experiments have been designed for each
layer separately, since their detection is independent.
The first one has the purpose of studying the pyrami-
dal height, in order to determine the number of levels
that achieves a successful segmentation with mini-
mum cost. In the second experiment, the feasibility
of a descending method without intermediate levels
is studied, avoiding the segmentation in certain levels
of the structure with the aim of optimizing even more
the pyramidal process. Finally, in the last experiment,
results of the best pyramids obtained previously are
compared with those provided by the original seg-
mentation method.
Given that the aim of this work is optimizing the
efficiency of the graph-based segmentation method,
maintaining the accuracy in the segmentation results
is essential. With that purpose, experiments 1 and
2 are done in two steps: firstly the feasible pyrami-
dal heights are studied, in order to consider pyramids
with enough number of levels (but not excessive) to
achieve appropriate segmentation results. After that,
efficiency is studied for those structures. Thus, at each
experiment, both effectiveness (successful segmenta-
tion) and efficiency (in terms of consumed time and
memory) are considered.
It is necessary to take into account that, in these
experiments, layer 1 is segmented using a 2-D graph,
since its location is evident in the images, and the in-
formation from adjacent images is not needed. Re-
garding layer 6, a 3-D graph is needed, due to the dis-
continuities in this layer, in addition to the fact that the
borderline between RPE and Choroids is not well de-
fined in the images. The 3-D graph for layer 6 is built
with overlapping groups of 3 consecutive images.
Parameters involved in the methodology have
been extracted empirically. The factor scale sc used
in this work is set to 0.5, so dimensions for the image
located in the level i of the pyramid are the half of the
image immediately below (level i − 1).
4.1 Experiment 1: Determining the
Optimal Pyramid Height
In this set of experiments, pyramids of different height
are evaluated, in order to determine the number of le-
vels that allows to obtain a successful segmentation
of each layer with minimum computational cost. This
task is done in two steps: firstly, a coarse study of the
heights than be considered to built pyramids for both
layers is done. After that, time and memory required
by the pyramid-based approach using these heights to
detect layers 1 and 6 is deeply studied.
Regarding layer 1, preliminary experiments show
that segmentation does not present mistakes for pyra-
mids of up to 4 levels, whereas layer 6 can not be cor-
rectly segmented with structures higher than 3 levels.
Once that the maximum number of levels for each
pyramid is known, performance is studied to select
the most appropriate structure. Table 1 shows results
obtained, while Figure 5 reflects them graphically.
Table 1: Time and memory consumed in the segmentation
task using pyramids of different heights, both expressed
as mean (standard deviation). Best time results have been
highlighted.
h = 2 h = 3 h = 4
Layer 1
Time (s) 58.44 (12.88) 30.22 (6.03) 29.67 (5.57)
Memory (MB) 103.22 (1.56) 103.83 (1.86) 104.00 (1.88)
Layer 6
Time (s) 1216.94 (557.36) 562.17 (93.10) –
Memory (MB) 115.11 (4.79) 123.22 (4.87) –
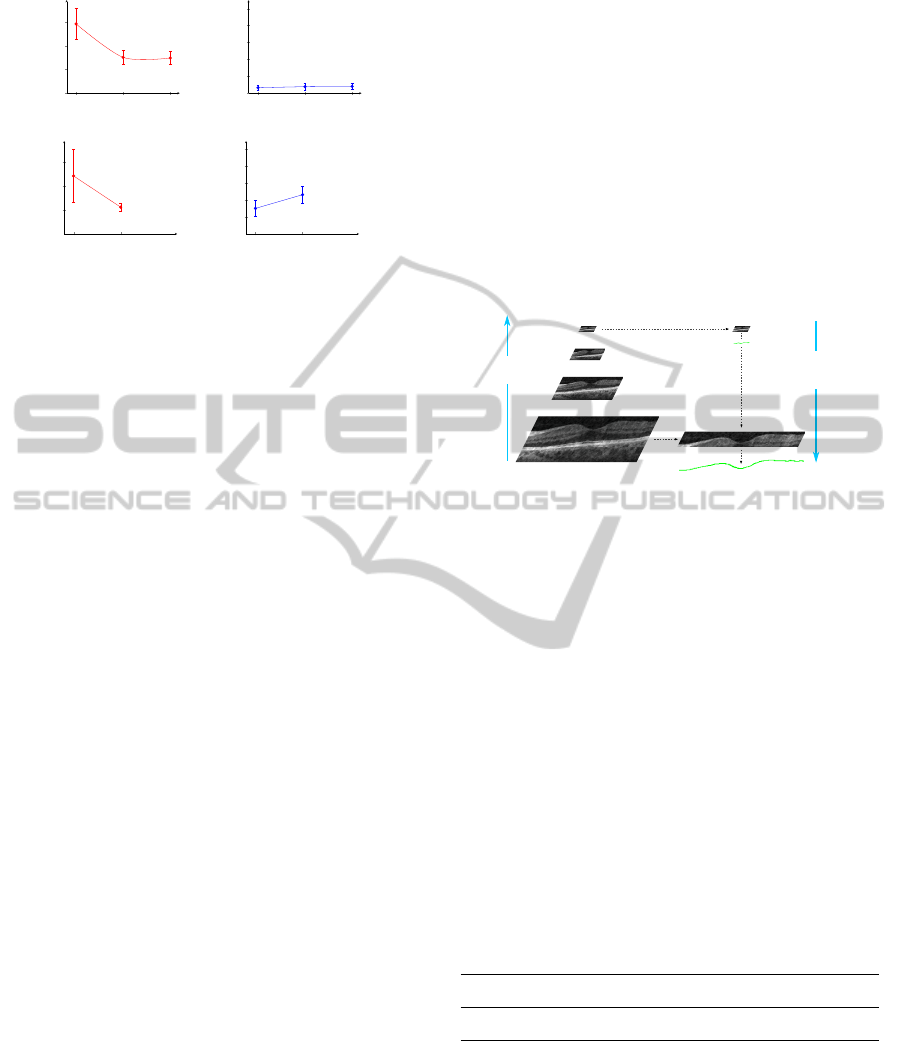
4.1.1 Discussion
First aspect to be observed is that the consumed me-
mory does not change significantly using different le-
vels in the pyramid, so it is not a decisive factor in the
selection of the best structure. However, it is observed
that layer 6 requires more memory than the layer 1.
Obviously, this is because of the 3-D model used to
detect that layer.
The number of levels has more evident repercus-
sions in the computation time. As Figure 5 (a) ex-
poses, time required to detect layer 1 decreases con-
siderably when h = 3 , whereas the small difference
ICAART2014-InternationalConferenceonAgentsandArtificialIntelligence
718
2 3 4
0
20
40
60
h
Time(s)
2 3 4
100
110
120
130
140
150
h
Memory (MB)
(a)
2 3
0
500
1000
1500
h
Time (s)
2 3
100
110
120
130
140
150
h
Memory (MB)
(b)
Figure 5: Time and memory consumed using pyramids of
different heights to segment layer 1 (a) and 6 (b).
in performance with h = 3 and h = 4 indicates that
this extra level does not provide relevant informa-
tion to bound the area of searching in the lower le-
vels. This is due to the fact that some margins are
needed in the processes of cutting and mask extrac-
tion. Therefore, although segmentation with higher
pyramids may be possible, their contribution to re-
duce computation time is not relevant.
Time consumed to detect layer 6, shown in Figure
5(b), also experiments an evident decreasing when
the number of levels increases. In addition, it is ob-
served that improvement using h = 3 regarding h = 2
is higher than the obtained for layer 1. This is caused
by the 3-D model used to detect layer 6, which is more
sensitive to the different sizes of the image (and con-
sequently, the associated graph) than a 2-D model. In
a intuitive way, the number of arcs between nodes is
higher in the 3-D model, making the searching harder.
Therefore, when they are reduced, computation time
changes in a more accused way.
With regards to the standard deviation in the pre-
sented measures, it is remarkable that the variability
is mainly caused by the operations performed in the
preprocessing stage of the methodology. In this first
phase, the dimensions of the input OCT image are op-
timized, removing the dark top and bottom, which do
not provide useful information. The different shape
of the retinal structure in the OCT images of the va-
lidation set causes a variation in the size of the in-
put image for the segmentation stage, which thereby
require different execution times. Results, however,
show that standard deviation does not affect in a sig-
nificant way to the efficiency, compared to the other
factors do.
4.2 Experiment 2: Optimizing the
Pyramidal Descent
Previous experiments have determined the optimal
height for the pyramidal structure for both layers 1
and 6. Thus, after optimizing the process of ascen-
ding the pyramid, an improvement in the descent can
be suggested, studying if the levels between the peak
of the pyramid and its base are needed or instead,
the application of the algorithm in all of them can be
avoided, as depicted in Figure 6. This method will
be referenced as direct descent, because it intends to
extrapolate directly the layer segmented in the peak
of the pyramid to the image in its base, instead of ex-
ploring all the levels to bound the area of searching at
each one. Thus, the min-cut searching is only applied
in these two levels.
Bounding area
of seaching
and segmentation
Downsampling
Figure 6: Schema for the pyramidal-based algorithm, in-
cluding the direct descent method.
This experiment is developed following an analo-
gous scheme to the previous one: firstly, the optimal
height for the pyramids is studied and then, the perfor-
mance for each possible structure is evaluated. Pre-
liminary results show that an appropriate segmenta-
tion of layer 1 with structures with height h more than
3 is not possible, so results for the feasible structures
are presented in Table 2 and Figure 7. Computation
times required in this experiment are also compared
with those obtained in the previous one (Figure 8),
because determining if the direct descent is possible
is not enough, but also if it provides an improvement
with regards to the best performance obtained in the
previous set of experiments.
Table 2: Time and memory consumed in the segmentation
task using the direct descent, both expressed as mean (stan-
dard deviation). Best time results have been highlighted.
h = 2 h = 3
Layer 1
Time (s) 58.44 (12.88) 26.78 (5.00)
Memory (MB) 103.22 (1.56) 104.22 (1.66)
Layer 6
Time (s) 1216.94 (557.36) 2988.17 (336.62)
Memory (MB) 115.11 (4.79) 129.89 (3.74)
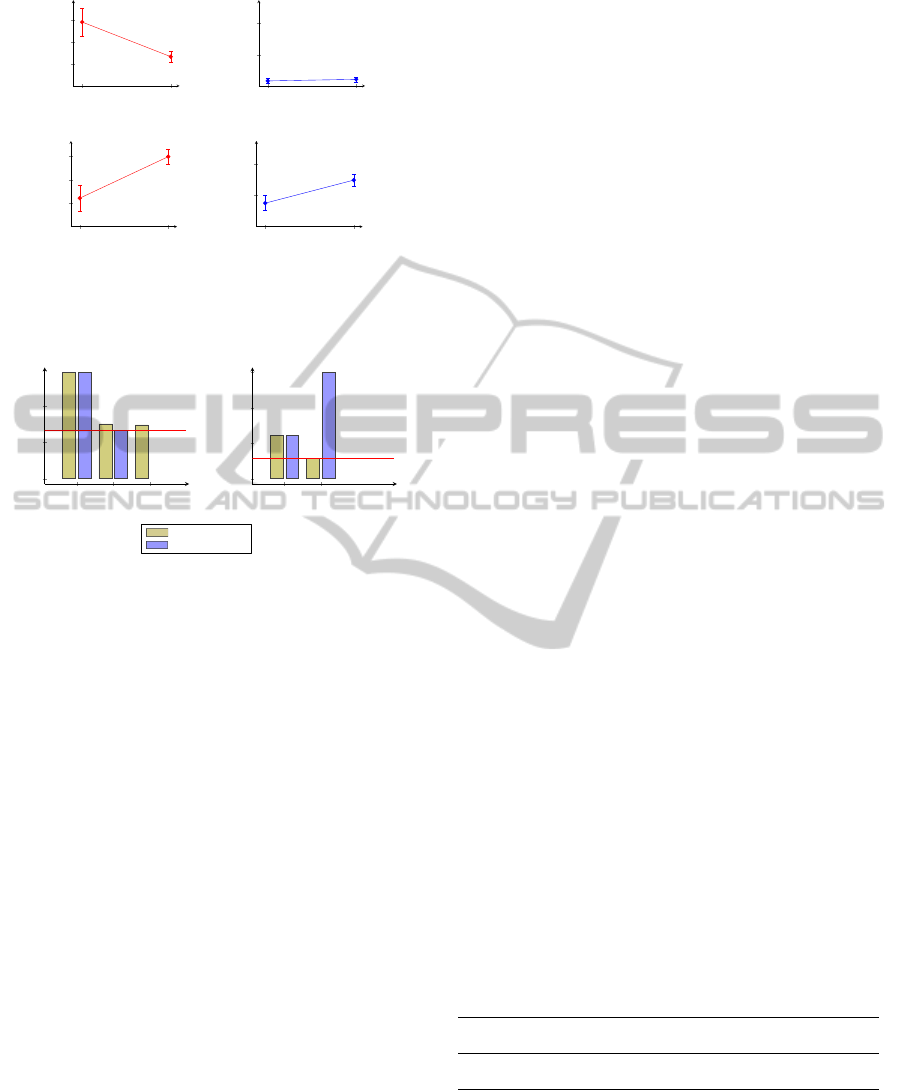
4.2.1 Discussion
In contraposition to results obtained in the previous
experiment, in this case, a suitable segmentation of
layer 1 can not be obtained using structures higher
that h = 3. This is due to the detection mistakes
present in the top of the pyramid caused by the loss of
information inherent to the downsampling. In the ori-
QuantitativeStudyonaMultiscaleApproachforOCTRetinalLayerSegmentation
719
2 3
0
20
40
60
h
Time (s)
2 3
100
120
140
h
Memory (MB)
(a)
2 3
0
1000
2000
3000
h
Time (s)
2 3
100
120
140
h
Memory (MB)
(b)
Figure 7: Time and memory consumed using the direct de-
scent method to segment layer 1 (a) and 6 (b).
2 3 4
0
20
40
60
26.78 s
h
Time (s)
Layer 1
2 3
0
1000
2000
3000
562.17 s
h
Time (s)
Layer 6
Experiment I
Experiment II
Figure 8: Comparison in time between both experiments to
segment layer 1 and layer 6.
ginal descending method, these deficiencies are cor-
rected gradually at each level, so the area of searching
in the base is the appropriate. In the direct descent
proposed in this experiment, these small errors at the
peak of the structure are transferred directly to its
base, and also magnified due to the larger scale of ex-
trapolation.
Results show that, for layer 1, consumed memory
is approximately stable, whereas for layer 6 slightly
increases, mainly due to the larger areas of searching
required by this layer, given the difficulties to de-
termine its precise location. However, it is not a
critical factor in the selection of one or another me-
thod. Regarding execution time, it is observed that,
while using the direct descend method involves an
improvement to segment layer 1, it does not to layer
6. Once again, this is related to the larger areas of
searching used to detect this layer. Thus, it is possible
to affirm that the middle levels in the pyramidal struc-
ture are not essential for layer 1, but they are needed
for layer 6.
Having analyzed the performance of the pyrami-
dal structures with the direct descent approach, a
comparison between these results and those obtained
Experiment 1 is necessary. Since consumed memory
remains fairly stable, execution time comparison (Fi-
gure 8) determines the best structure and the method
used to descend it for each layer.
As it was explained before, the information avail-
able in the peak of the pyramid with h = 3 is enough
to avoid using the intermediate levels in the segmen-
tation of layer 1. On the other hand, detecting layer
6 with the direct descent method is not profitable in
terms of performance, because of the complex loca-
tion of this layer. Not considering the information of
the intermediate levels to correct the deficiencies of
the segmentation in the peak of the structure involves
using a larger area of searching in the basis. There-
fore, computation time increases, specially using a
3-D model. Thus, unlike layer 1, the best approach
to detect layer 6 consist in applying the algorithm in
all the levels of the structure, as it was presented in
Experiment 1.
4.3 Experiment 3: Comparison with the
Single-scale Approach
Experiments exposed previously have provided the
best configurations for the pyramidal approach pro-
posed to detect layers 1 and 6. Now, a comparison
between original single-scale approach and the new
pyramidal multiscale one is presented, considering
not only terms of performance but also effectiveness
(accuracy in the segmentation obtained).
Table 3 shows performance results obtained for
both options (results presented for the pyramid-based
method are those obtained with the best structures an-
alyzed the previous experiments). With regards to the
segmentation accuracy, most test show that both ap-
proaches provide similar results (some samples ob-
tained with each method are presented in Figure 9).
The most interesting fact is that multiscale approach
solves some mistakes made by the single-scale me-
thod, as Figure 10 shows, although this will be com-
mented in detail in the discussion.
Table 3: Consumed time and memory comparison between
the simple-scale method and the pyramidal-approach. Re-
sults are expressed as: mean (standard deviation). Percent
of improvement in time has been highlighted.
Original Pyramidal
Improvement(%)
Method Approach
Layer 1
Time (s) 1795.28 (873.55) 26.78 (5.00) 98.51
Memory (MB) 148.61 (11.71) 104.22 (1.66) 29.87
Layer 6
Time (s) 24499.39 (13259.34) 562.17 (93.10) 97.71
Memory (MB) 162.78 (6.31) 123.22 (4.87) 24.30
4.3.1 Discussion
Figure 9 shows that the quality obtained with the
single-scale method is maintained with the proposed
multiscale approach. Despite the similarity between
both segmentations, there are situations in which the
ICAART2014-InternationalConferenceonAgentsandArtificialIntelligence
720
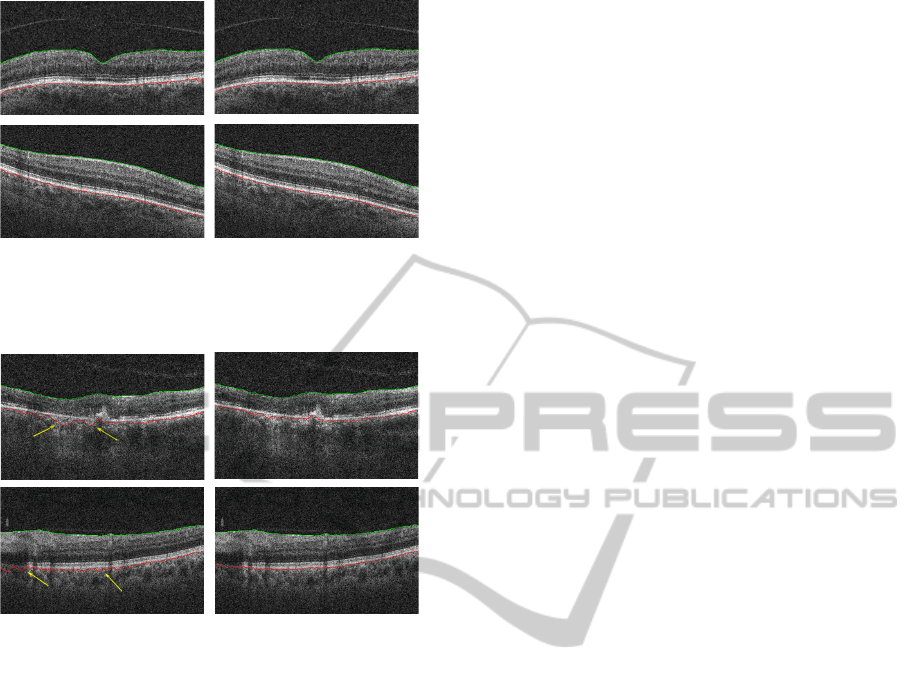
(a) (b)
Figure 9: Segmentation samples obtained for layer 1, in
green, and 6, in red: (a) single-scale method; (b) pyramidal
approach.
(a) (b)
Figure 10: Segmentation results obtained for layer 1 and
6: (a) single-scale method; (b) pyramidal approach. Yellow
arrows indicate the mistakes using the single-scale method,
which are avoided using the pyramidal structure.
pyramid-based method provides better results. Thus,
it is possible to affirm that the loss of information
inherent to the pyramidal process and the downsam-
pling, as well as the bounded area of searching ob-
tained, are really relevant. In particular, these terms
allow correcting some mistakes caused by the infor-
mation present in the original image. This is spe-
cially remarkable in the case of layer 6, given that the
choroid, located below it and with similar properties,
can involve wrong segmentation in some parts of the
image. As samples in Figure 10 show, these errors are
not made using the pyramidal approach.
On the other hand, comparison between both so-
lutions in terms of performance presented in Table 3
show that, as it was mentioned before, the most sig-
nificant factor to take into account is the computation
time. It is remarkable that a relevant leap in time is
done (even in magnitude order, considering terms of
hours in the single-scale problem to minutes and se-
conds in the multiscale approach).
Results show the high computation time required
by the single-scale method, which make it nonviable,
specially for layer 6 detection (mean time required
over six hours). Proposed optimization, with con-
figurations for pyramidal structures exposed in the
previous experiments, achieves a significant improve-
ment in time for each layer over the 97%. Addi-
tionally, although consumed memory is not excessive
in any of the approaches, pyramid-based solution re-
duces it in more than a 20% in each layer. For layer
1, segmentation using three-level pyramidal structure
and the direct descend from the peak to the base is
67 times faster than the original procedure, as Table
3 presents. However, the improvement is lower for
layer 6, whose proposed approach is 43 times lower
than the original. This difference is mainly caused by
the higher difficulty in the location of this layer, as
well as the use of 3-D model, as it was introduced in
the previous experiments.
Pyramid-based approach also involves an im-
provement in the variability of the consumed time.
For instance, results in Table 3 show that segmenta-
tion of layer 1 with the original method can vary in
function of the patient until a 48% of the mean time
(approximately 14 minutes), whereas the pyramidal
method presents a dispersion of 18.6% with respect
to the mean value (5 seconds). Regarding layer 6, re-
duction is analogous.
This improvement in the standard deviation is
mainly provided by the bounding area process (Sec-
tion 3.2), which has a direct repercussion in the graph
size generated in the detection. In this step, cutting
process affects mainly to the number of rows in the
image located on the pyramidal peak (lower levels
use a mask to bound even more the area of interest).
In addition, segmentation process in the peak of the
pyramid barely affects in the global time required to
detect a layer. Therefore, as variability between pa-
tients is caused by the cutting in the descent stage and
it affects specially to the image on the highest level
in the pyramid (whose segmentation time is short), it
seems obvious that the influence in the total time will
be also small. In contraposition to that, in the origi-
nal methodology the difference in size between two
images has a more relevant repercussion, because the
number of nodes (and therefore, the number of arcs)
erased in the cutting is much higher than that done in
the peak of a pyramid. Therefore, changes in terms
of dispersion are which should be expected and, as it
was determined in Experiment 1, this difference is not
a significant factor to take into account.
As a synthesis of the results obtained in this expe-
riment, it is shown that the pyramid-based approach
provides better results than the single-scale method in
terms of computation time, at the time that maintains,
and also improves, segmentation obtained with this
QuantitativeStudyonaMultiscaleApproachforOCTRetinalLayerSegmentation
721

Table 4: Parameters used to segment layer 1. They correspond to the best configuration obtained after the experiments
(three-level pyramid, with the direct descent method).
Level (i)
Parameter
f
1
w
edge
w
g
w
α
w
β
w
Y
w
ζ
0
f
d
t
α
t
β
min
t
β
max
t
sup
t
in f
2 f
edge
+ f
g
+ f
α
+ f
β
+ f
ζ
0
N
1000 2000 1000 1000 - 1000 20 5 0 2 - -
0 f
edge
+ f
g
+ f
α
+ f
Y
1000 2000 1000 - 1000 - 20 10 2 10 15 10
Table 5: Parameters used to segment layer 6. They correspond to the best configuration obtained after the experiments
(three-level pyramid, with the original descent method).
Level (i)
Parameter
f
6
w
edge
0
w
g
w
δ
w
ε
w
ζ
0
w
X
f
d
ws
δ
ws
ε
t
X
t
sup
t
in f
2 f
edge
0
+ f
g
+ f
δ
+ f
X
1000 2000 1000 - - 1000 20 1 - 5 - -
1 f
edge
0
+ f
g
+ f
δ
+ f
ε
+ f
ζ
0
N
+ f
X
2000 2000 2000 1500 1000 1000 20 1 1 5 15 5
0 f
edge
0
+ f
g
+ f
δ
+ f
ε
+ f
ζ
0
2000 2000 1500 1000 1000 - 20 1 1 - 7 7
method.
5 CONCLUSIONS AND FUTURE
WORK
This paper presents a study of a multiscale approach
for a graph-based method to segment retinal layers in
OCT images. This approach is evaluated on two reti-
nal layers, considering terms of computing time and
memory. Three experiments have been designed to
evaluate the different configurations that can be taken
into account in this problem, in order to achieve the
most successful results. Values for parameters in the
graph-based method are presented in Tables 4 and 5,
corresponding to the best configuration obtained in
the experiments. Quantitative measures show that this
approach improves considerably the performance of
the original method. They also determines the me-
thod that should be applied in each layer during the
pyramidal descent. Accuracy has been evaluated too,
because segmentation results obtained by the single-
scale method must be maintained. This approach
achieves not only the same results, but also improve
them, obtaining successful segmentation in situations
where the single-scale method makes mistakes.
ACKNOWLEDGEMENTS
This paper has been partly funded by the Ministe-
rio de Ciencia e Innovaci
´
on under TIN2011-25476
project of the Spanish Government (A. Gonzalez ac-
knowledges the support of Secretar
´
ıa de Estado under
FPI Grant Program).
REFERENCES
Albrecht, P., Ringelstein, M., Mueller, A., Keser, N., Di-
etlein, T., Lappas, A., Foerster, A., Hartung, H., Ak-
tas, O., and Methner, A. (2012). Degeneration of
retinal layers in multiple sclerosis subtypes quantified
by optical coherence tomography. Multiple Sclerosis
Journal.
Bowd, C., Weinreb, R., Williams, J., and Zangwill, L.
(2000). The retinal nerve fiber layer thickness in ocu-
lar hypertensive, normal, and glaucomatous eyes with
optical coherence tomography. Archives of Ophthal-
mology, 118(1):22–26.
Chiu, S. J., Li, X. T., Nicholas, P., Toth, C. A., Izatt,
J. A., and Farsiu, S. (2010). Automatic segmenta-
tion of seven retinal layers in sdoct images congru-
ent with expert manual segmentation. Optics Express,
18(18):19413–19428.
Garvin, M. K., Abr
`
amoff, M. D., Wu, X., Russell, S. R.,
Burns, T. L., and Sonka, M. (2009). Automated 3-
d intraretinal layer segmentation of macular spectral-
domain optical coherence tomography images. IEEE
Trans. Med. Imaging, 28(9):1436–1447.
Gonz
´
alez, A., Penedo, M. G., V
´
azquez, S. G., Novo, J.,
and Charl
´
on, P. (2013). Cost function selection for a
graph-based segmentation in OCT retinal images. In
LNCS: Computer Aided Systems Theory, Revised Se-
lected Papers EUROCAST 2013.
Haeker, M., Sonka, M., Kardonc, R., Shah, V. A., Wu, X.,
and Abrmoff, M. D. (2007). Automated segmentation
of intraretinal layers from macular optical coherence
tomography images. Proc. SPIE: Medical Imaging,
6512.
Keane, P. A., Patel, P. J., Liakopoulos, S., Heussen, F. M.,
Sadda, S. R., and Tufail, A. (2012). Evaluation of age-
related macular degeneration with optical coherence
tomography. Survey of Ophthalmology, 57(5):389–
414.
Puzyeyeva, O., Lam, W. C., and Flanagan, J. e. a. (2011).
High-resolution optical coherence tomography retinal
ICAART2014-InternationalConferenceonAgentsandArtificialIntelligence
722

imaging: A case series illustrating potential and limi-
tations. J. Ophthalmology.
S
´
anchez-Tocino, H.,
´
Alvarez-Vidal, A., Maldonado, M. J.,
Moreno-Monta
˜
nes, J., and Garc
´
ıa-Layana, A. (2002).
Retinal thickness study with optical coherence tomog-
raphy in patients with diabetes. Investigative Ophthal-
mology & Visual Science, 43(5):1588–94.
QuantitativeStudyonaMultiscaleApproachforOCTRetinalLayerSegmentation
723
