
A Framework for High-throughput Gene Signatures with
Microarray-based Brain Cancer Gene Expression Profiling Data
Hung-Ming Lai
1
, Andreas Albrecht
2
and Kathleen Steinhöfel
1
1
Algorithms and Bioinformatics Research Group, Department of Informatics, King’s College London,
Strand, London WC2R 2LS, U.K.
2
School of Science and Technology, Middlesex University, Burroughs, London NW4 4BT, U.K.
Keywords: Brain Cancer, Feature Interdependence, Feature Selection, Gene Signature Selector, Microarray Data
Analysis.
Abstract: Cancer classification through high-throughput gene expression profiles has been widely used in biomedical
research. Most recently, we portrayed a multivariate method for large scale gene selection based on
information theory with the central issue of feature interdependence, and we validated its effectiveness
using a colon cancer benchmark. The present paper further develops our previous work on feature
interdependence. Firstly, we have refined the method and proposed a complete framework to select a gene
signature for a certain disease phenotype prediction under high-throughput technologies. The framework has
then been applied to a brain cancer gene expression profile derived from Affymetrix Human Genome
U95Av2 Array, where the number of interrogated genes is six times larger than that in the previously
studied colon cancer data set. Three information theory based filters were used for comparison. Our
experimental results show that the framework outperforms them in terms of classification performance
based upon three performance measures. Additionally, to demonstrate how effectively feature
interdependence can be tackled within the framework, two sets of enrichment analysis have also been
performed. The results also show that more statistically significant gene sets and regulatory interactions
could be found in our gene signature. Therefore, this framework could be promising for high-throughput
gene selection around gene synergy.
1 INTRODUCTION
In recent biomedical research, transcriptome
analysis using high-throughput screening (HTS)
technologies, such as microarrays, has been a
prevailing approach to obtain gene expression
profiles of cells of interest in response to
physiological and genetic changes in several tissues.
Since HTS is capable of interrogating many
thousands of oligonucleotide probes simultaneously,
the analysis of expression profiling data has shown
enormous potential for the discovery of biological
markers in carcinogenesis studies and in the
diagnoses of diseases (Nevins and Potti, 2007).
Different types of tumor cells can be marked by
discriminating genes at expression level. Thus,
biomarkers for distinct tumorigenesis stages and
cancer classification under HTS experiments could
be explored by selecting discriminating genes. The
identification of subsets of these genes contributing
to the predictive power is the process of finding so-
called gene signatures and is subject to change (Kim,
2009). Out of an abundance of transcripts in a tissue,
a few genes are differentially expressed, while a
tremendous amount of mRNAs would be regarded
as noise. Also, biologists favor a small number of
candidate genes to achieve greater efficiency for in
vitro validation.
Identification of differentially expressed genes in
bioinformatics can be referred to as feature
selection, the domain of dimensionality reduction
techniques, commonly termed in the context of data
mining, machine learning and pattern recognition
(Saeys et al., 2007). In particular, feature subset
selection is a technique not only to reduce the
feature dimension of data points without changing
their initial representation, but also to select the
minimal subset that maximizes the classification
performance. In terms of knowledge discovery, this
is actually based on the principle of parsimony (Bell
211
Lai H., Albrecht A. and Steinhöfel K..
A Framework for High-throughput Gene Signatures with Microarray-based Brain Cancer Gene Expression Profiling Data.
DOI: 10.5220/0004926002110220
In Proceedings of the 6th International Conference on Agents and Artificial Intelligence (ICAART-2014), pages 211-220
ISBN: 978-989-758-015-4
Copyright
c
2014 SCITEPRESS (Science and Technology Publications, Lda.)

and Wang, 2000), leading to a preferred model
having as few as possible variables that sufficiently
fit with the data – this is very similar to the need of
gene signature determination. Unfortunately, a
typical microarray-based cancer experiment might
only consist of tens to a hundred of clinical samples,
but each sample has thousands to tens of thousands
of genes to be questioned (Ein-Dor et al., 2006). The
presence of experimental noise is another widely
criticised issue in the experimental design of
microarrays. The noise is unavoidable and doomed
to existence from the early stages of sample
preparation, extraction and hybridization, largely
due to the principles of microarray technology.
Feature subset selection is known to be an NP-
complete problem (Davies and Russell, 1994), and
the curse of dimensionality and the common
occurrence of experimental noise would make the
procedure of discriminating gene selection and the
process of finding a parsimony model even more
challenging.
Over the past decade, one can categorize feature
selection methods into three groups: filters, wrappers,
and embedded techniques, depending on how they
interact with a classification method (Saeys et al.,
2007). A filter method measures features with
respect to different phenotypes by considering the
intrinsic properties of the data and does not make
use of a classification algorithm within its selection
scheme. There are two types of filters, univariate
and multivariate methods. Univariate filters
disregard feature interaction and evaluate features
individually. Both parametric statistics (e.g.
paired/unpaired student t-test & ANOVA) and
nonparametric statistical tests like Wilcoxon rank
sum are univariate. On the other hand, multivariate
filters that consider feature-feature correlations to
some extent are sometimes referred to as space
search methods (Lazar et al., 2012). A wrapper
employs a classification method to evaluate the
prediction performance of a selected feature subset
and an iterative selection process is wrapped around
the classifier. The procedure is terminated with a
stop criterion in order to obtain the best predictive
model. Although the wrapper is able to manage
feature-to-class relevance and feature-to-feature
dependence, it seems prone to overfitting and is
computationally time-consuming because of a small
sample size and a large feature dimension.
According to search strategies, the wrapper can be
deterministic or randomized. Sequential forward
selection and sequential backward elimination are
two typical examples of deterministic wrappers,
whereas simulated annealing or genetic algorithms
serve as an illustration of randomized ones (Albrecht
et al., 2003, Gheyas and Smith, 2010). Similar to the
wrapper, an embedded approach is also dependent
on a classification method and takes feature
correlations into account. However, the embedded is
less computationally intensive than the wrapper as
feature subset selection is embedded in a base
classifier. As soon as a classifier is built, features are
about to be ranked or weighted. SVM-RFE and its
variants are one of the most representative examples
of embedded feature selection (Guyon et al., 2002,
Zhou and Tuck, 2007, Mundra and Rajapakse, 2010).
The main idea is to rank features by the weight
vector of a linear SVM hyperplane and to select
features using a recursive feature elimination
strategy.
In recent years, several feature selection methods
based on information theory have been developed to
deal with feature-to-feature dependence and the
correlation between a feature and the selected
feature subset in large scale gene expression data.
Moreover, more recently a probabilistic
interpretation has been established, derived from
optimizing the conditional likelihood, for unifying
information theoretic feature selection (Brown et al.,
2012). Three space search feature selection methods
are now briefly described and then compared to a
new gene selection filter proposed in the present
paper. The three multivariate methods are all based
on information theory and focus on the issue of
feature-feature dependence and feature-phenotype
correlation. Ding and Peng proposed the minimum-
Redundancy and Maximum-Relevance framework
(mRMR) to explore high order gene interactions
(Ding and Peng, 2005). This method uses mutual
information to cope with a tradeoff between the
reduction of feature redundancy within a feature
subset and the strength of feature-to-class correlation.
Their experimental results show that the defined
criterion could lead to features with least redundancy.
Using conditional mutual information as an
evaluation criterion, Fleuret proposed a fast binary
feature selection (cmim) to select features having the
largest association with respect to sample classes
conditioned on the selected feature subset (Fleuret,
2004). As the cmim criterion would select features
having more information about sample classes
evaluated only by pairwise feature statistics, some
informative features, in which biologists could be
interested, would be removed, even though the
author claims that the selected features are
informative and weakly pairwise dependent. The
third feature selector, fcbf, was designed by Yu and
Liu to efficiently eliminate a considerable number of
ICAART2014-InternationalConferenceonAgentsandArtificialIntelligence
212

irrelevant and redundant features (Yu and Liu, 2004).
While mRMR and cmim define evaluation criteria,
fcbf introduces an approximate Markov blanket as a
search strategy for an efficient feature removal by
using symmetrical uncertainty. This method
therefore selects much fewer features than mRMR
and cmim and is very prone to removing 'less
informative' but important features that might be of
interest to the domain expert. Although feature
relevance and feature redundancy are well addressed
by the three multivariate filters just discussed,
feature interdependence is discarded in favour of
reduced computational complexity. Feature inter-
dependence may point to an important feature that is
strongly discriminative together with other features
in the selected feature subset, but is individually less
informative relative to a class. The approach could
be biologically meaningful within gene signatures in
post-genomics.
Most recently, we portrayed a multivariate gene
selection method around feature interdependence by
using information theoretic measures and validated
its effectiveness with colon cancer classification data
(Lai et al., 2013). Based on the preliminary results,
we have now refined the method by appropriately
fine-tuning parameter settings, by establishing an
aggregation scheme for gene signatures, and by
proposing an RC plot to demonstrate how gene pairs
could bring more information about sample classes
than individual genes can do. Finally, we present a
complete framework for identifying high-throughput
gene signatures for a certain disease phenotype
prediction, based on brain cancer gene expression
profiles (Nutt et al., 2003) using Affymetrix Human
Genome U95Av2 Array, in which the dimension of
features is six times larger than that in the colon
cancer data matrix (Alon et al., 1999) examined in
our previous work. It implies that the discovery of
biologically discriminative genes based on the brain
experiment would be more demanding than that in
the colon expression matrix.
2 PRELIMINARIES
2.1 Domain Description
In this section, the domain of HTS gene selection for
phenotype prediction is briefly described. Given a
gene expression dataset
∈
,∈
,
, where includes n samples labeled
by a class vector C, and each sample is profiled
over m gene expressions, i.e.
,⋯,
,
≫. The domain expert expects to find a small
number of discriminating genes (from tens to a
hundred) for clinical classification to be validated in
vitro and to identify a gene signature for a specific
disease. To address the issue of HTS-based gene
signatures, we can refer to it as a feature selection
problem. Let F be a full set of features (genes)
, then feature selection aims at choosing
a feature subset ⊂ that maximizes the prediction
performance; moreover, if G is aimed at a minimum,
a parsimonious subset is sought for.
2.2 Information Theory Basics
Entropy is the rationale behind information theory
and is an intuitive measure to evaluate the
uncertainty of a random variable. Given a variable, it
is computed at the level of probability distributions
(Cover and Thomas, 2012). Let X be a nominal
random variable, Shannon entropy is defined as
H
X
∑
log
∈
,
(1)
where x denote the values of the random variable X
over its alphabet (the domain), and is the
marginal probability distribution of X. Without loss
of generality, the domain will be ignored in the
rest of the paper. Unlike conventional statistics, an
entropy-based measure does not make any a priori
assumption. For instance, one is required to ask
whether data is normally distributed before using the
student’s t-test. Additionally, other information
quantities can also be defined through applying
probability theory to entropy. The conditional
entropy of X given Y is represented as
H
X
|
Y
∑
∑
|log|,
(2)
where | is the conditional probability of X
given the observed values of Y. This quantity
evaluates how much uncertainty of X is left given
that the value of another random variable Y is
known. Similarly, the joint entropy of two random
variables X and Y is denoted as
H
X,
Y
∑∑
,log,,
(3)
where , is the joint probability distribution of
X and Y. It quantifies the amount of information
needed to describe the outcome of two jointly
distributed random variables. Another important
information theoretic measure, mutual information,
quantifies the amount of information shared by two
random variables X and Y, and can be obtained by
the definition of entropy and conditional entropy
MI
X,
Y
H
X
H
X
|
Y
.
(4)
The mutual information is the reduction of entropy
of one variable, if the other is known. This measure
AFrameworkforHigh-ThroughputGeneSignatureswithMicroarray-basedBrainCancerGeneExpressionProfiling
Data
213

is symmetric and non-negative, and the value of zero
implies that the two variables are statistically
independent. The mutual information of X and Y
can also be conditioned on Z, conditional mutual
information, and defined by
CMI
X,
Y
|Z
H
X|Z
H
X
|
Y
,Z
.
(5)
The quantity measures the information amount
shared between X and Y, if Z is known. Finally, we
introduce symmetrical uncertainty that will be
heavily utilized in our gene selection framework
throughout the paper. The measure could be viewed
as one type of normalized mutual information and
defined as
,
2
|
.
(6)
If X is a joint random variable, the joint symmetrical
uncertainty could be acquired by exactly the same
idea as the joint entropy.
2.3 Feature Relevance
Given a full set of features F and a feature
, then
let
\
denote that the feature
is removed
from the set F. Kohavi and John (hereafter KJ)
defined three feature types of relevance to sample
classes via the probability distribution of the class C
conditioned on the features of
and
, as in the
following Definition 1-3 (Kohavi and John, 1997).
Definition 1: KJ-Strong Relevance:
A feature
is strongly relevant to C iff
C|
,
|
.
(7)
Definition 2: KJ-Weak Relevance:
A feature
is weakly relevant to C iff
C
|
,
|
and
∃
⊂
such that C|
,
|
.
(8)
Definition 3: KJ-Irrelevance:
A feature
is irrelevant to C iff
∀
⊆
,
C
|
,
|
.
(9)
The three definitions imply that an ideal feature
subset should include all strongly relevant features
and some weakly relevant features with least feature
redundancy, and all irrelevant features should be
removed. Given two jointly distributed random
variables
(or
), similar to KJ definitions, we
can define a strongly relevant feature pair
by the
conditional probability distribution of the class C.
Definition 4: Strongly Relevant Feature Pair:
A feature pair
is strongly relevant to C iff
C|
,
|
,
(10)
where
denotes the feature set F with the features
and
both together eliminated from F. Therefore,
a feature pair is referred to as a united-individual
(feature fusion) and must be selected or removed
together during the process of selection. The strong
relevance of a feature pair will be the basis for the
framework presented in our paper for finding HTS
gene signatures.
2.4 Feature vs Feature Fusion
We propose a ‘Ratio by Correlation’ (RC) plot in
order to demonstrate if feature pairs can reveal more
information about the class C than single features
could do and whether or not feature fusion can
provide insight into feature interdependence,
revealing potentially some genetic regulatory
interactions between features. Out of the probe-sets
(features) designed in the Affymetrix Human
Genome U95Av2 Array with a real gene expression
data set (Nutt et al., 2003), ten thousand feature pairs
f
ij
were randomly selected to generate the RC plot as
shown in Figure 1. Given the population of the
selected pairs and a gene expression matrix with the
corresponding sample class vector, we used
symmetrical uncertainty to calculate two correlation
measures between two features and C (SU
i,c
and
SU
j,c
, respectively), and additionally one correlation
value between a feature fusion and C (SU
ij,c
). Then
the mean of SU
i,c
and SU
j,c
was computed and
represented by M, followed by three computations
displayed below:
,
log
;
(11)
,
log
,
;
(12)
log
,
log
.
(13)
The RC plot is constructed by plotting R against
,
and against
,
, respectively. Here,
,
represents the average correlation between
individual feature and C, whereas
,
denotes
correlation between feature fusion and C. Thus, R is
the ratio between feature fusion correlation and
individual feature correlation. For the convenience
of visualization, a logarithmic scale is used, with
twofold changes for the ratios and tenfold increases
for correlations.
While most feature fusions have a significantly
increased joint effect, there still exist many cases
where two features coupled together do not provide
more information about a class, and this happens
especially for those features that might potentially be
considered as strongly relevant to the class.
ICAART2014-InternationalConferenceonAgentsandArtificialIntelligence
214

Figure 1: Ratio by Correlation Plot.
Moreover, a few cases have been found where a
feature fusion has a decrementing joint effect if two
strong features are joined together. It might imply a
common phenomenon in gene regulation where one
gene can be silenced or deactivated by another gene
or its products. On the other hand, there are only a
few feature fusions from very weak features having
exceptionally high strength of association between
them and the class due to some kind of their
underlying interdependence. Overall, we observe
that single features (red scatter plot) move
rightwards towards feature fusions (blue scatter plot)
in Figure 1. It means that there is a clear tendency
for features to combine to stronger pairs. Therefore,
we believe that feature pairs would play more
important roles than individual features in gene
selection based on high-throughput gene expression
profiles. Feature fusion could either bring more
information about C or have a potential for dealing
with feature interdependency that could take more
gene synergy into account.
3 iRDA – A FRAMEWORK FOR
FINDING GENE SIGNATURES
A complete framework for selecting high-throughput
gene signatures is shown in Algorithm 1. This novel
gene selector is named iRDA, abbreviated by gene
selection guided by interdependence with redundant-
dependent analysis and a gene aggregation. The
framework is based on information-theoretic
measures, an appropriate search strategy, a suitable
parameter estimation criterion, a mixture of forward-
backward phases, and a simple aggregation scheme.
The rationale for devising such a framework is to
select a gene signature around gene synergy that
could potentially discover genetic regulatory
modules or disease-related factors. Interdependence
between features is, therefore, a matter of concern.
The proposed gene selection method is a four-
step framework with a vast body of feature pairs,
including a set of analyses of feature relevance,
feature interdependence, feature redundancy and
Algorithm 1: iRDA Gene Selector.
Given:
∈
,∈
,
and
Parameter:
Find:genesignatureG
RELEVANCE:
1∀
,calculate
,
2Sort
,
intodescendingorder
3Performk‐meanclustering(k=5)onthesorted
,
4Label5clustersR
1
‐R
5
whosecentroidsarein
descendingorder
INTERDEPENDENCE:
5ForwardPhase
6t=1
7fori=1tosup(R
1
)
8
∅
9forj=i+1tosup(R
4
)
10if
,
>,whereisestimatedbyEq.(14)
11addfeaturepairs
to
,
followedby
12where
isaseed(
)andaddedonce
only
13end
14t=t+1
15end
16Let
|
∅,
ledby
REDUNDANCYANDDEPENDENCE:
17BackwardPhase
18foreach
do
19foreach
∈
dofirstinlastcheck
20
isremovedinstantlyif
,|
=0
21
∅if
,|
=0
22end
23end
24InsertionPhase
25∀
,
∈
,add
to
ifapplicable
26
isthenestablished
27performbackwardphaseon
28Let
∅,#
1,
,
,
AGGREGATION:
29t=1,G=∅
30do
31G=G∪
32t=t+1
33whileG=
orGisdefined
dependence, and feature aggregation. Features
relevant to C defined by KJ looks sensible in theory,
but it would hardly work in practice, specifically for
the analysis of large-scale gene expression profiles.
In general, high throughput gene expression
profiling has only a relatively small number of
AFrameworkforHigh-ThroughputGeneSignatureswithMicroarray-basedBrainCancerGeneExpressionProfiling
Data
215

differentially expressed genes, and correlations
between features and labels are exponentially
distributed. In this paper, we estimate the degree of
features relevant to a target class via an analysis of a
partition method working on a selected correlation
measure. Given a random value for feature f
i
,
symmetrical uncertainty SU
i,c
is used to quantify the
strength of association between features and labels.
After sorting all of the calculated correlations in
descending order, k-mean clustering is proceed upon
the sorted list of SU
i,c
to partition features into five
groups. We label the five clusters as
⋯
in
descending order according to their centroids, to
gradually make the way down the scale of KJ-
relevance/-irrelevance to C. These feature types will
be a prerequisite to conduct our main idea of feature
interdependent analysis.
The consideration of multi-way gene interactions
would have the potential for a road map of feature
interdependence. However, because of the immense
complexity of gene regulatory mechanisms, it would
not be a good strategy to infer multi-way feature
interdependence in a direct way. Unlike traditional
feature selection filters working on a search space of
individual features, feature pairs will be our main
body throughout the framework and individual
features with various scale of relevance to sample
classes will only be an indicator in the subsequent
analyses. It is impractical to perform exhaustive
search for visiting all feature pairs if the number of
features is very large. Therefore, feature relevance
partitions from the previous step could be an
indicator to produce potential feature fusions that are
KJ relevant to C. In the second step, given a joint
random variable of two features f
i
f
j
(or f
ij
), joint
symmetrical uncertainty SU
ij,c
is used to measure the
strength of correlation between a feature fusion and
a class variable. The aim of this step is to search for
those strongly relevant feature pairs whose joint
symmetrical uncertainty values are greater than a
threshold . We assume that one feature in
partition colliding with the other feature in the
partitions of
,
,
and
might have a positive
joint effect for producing potential feature fusions.
Based on this assumption, an estimation of the
threshold will be a critical task for exploring
feature pairs. We propose to estimate the critical
value by the following equation:
ε
,
,
(14)
where
∈Ω,
Ω
=
1,⋯,
∗
;
,
,
;
,
,
.
Given the number of trials
T
, two features (f
i
, f
j
) in
the sorted list of SU
i,c
are coupled in turn, where
SU
i,c
> SU
j,c
, to test if the conditions of
,
,
and
,
,
are satisfied. Then when
∗
successful feature fusions that meet the conditions
are executed, the mean of their SU
ij,c
is computed to
be the estimation of the threshold . The conditions
reveal that a feature fusion has positive joint effect
and less redundancy between the two coupled
features even though a feature correlation sometimes
does not necessarily mean redundancy. Once a
feature fusion succeeds in the examination of SU
ij,c
>
, the feature is then added to a subset of
led by a
seed feature f
s
. It means, every feature fusion f
sj
in
has the same feature f
s
, and every feature belongs to
the subset in the order of its relevance to C. Finally,
there could be a collection of
s led by various seed
features. Through the approximation of high-order
feature interdependence led by seed features and
their feature fusions, feature interdependence could
be extended from mutual dependence on feature
pairs to high dimensional gene interactions.
If a subset is formed, it is necessary to ask if
there are any redundancies among features within a
selected feature subset. A minimal feature subset
must include the most discriminative features, but
avoid redundant features. Thus the third step is
mainly to check and remove redundant features as
many as possible to form a parsimonious set of
features. Given a collection of subsets derived from
interdependent analysis, G
pre
, the conditional mutual
information CMI
,|
of a feature
and label C
conditioned on a subset
∈
is used for this
purpose by using an approximation of backward
elimination with first in last check policy. For any
,
we test if the value of CMI
,|
is zero for every
feature checked one by one and from the end of
to the beginning of
. A feature whose CMI value
is zero will instantly be removed and the next less
relevant feature will then be checked until the
features in
have all been tested. If a seed feature
is eliminated, the subset
led by this feature will
be discarded; otherwise, features that remain in a
retained subset are considered to be dependent on
the seed feature. When redundancy analysis of G
pre
is finished, for any feature fusions with seed features
(f
sj
) in G
pre
, a seed feature f
s
might be added to the
subset led by feature f
j
if applicable. This procedure
is in order to complement the greedy formulization
of
. Therefore, we might have a new collection of
subsets
so that a second round of redundant
analysis would be required for
. iRDA actually
includes a forward phase and a backward phase.
Interdependent analysis carries out forward addition
ICAART2014-InternationalConferenceonAgentsandArtificialIntelligence
216

and more false positive features might be selected in
this phase while redundant and dependent analysis
performs backward elimination to identify and to
remove false positive features. An insertion phase
included in redundant and dependent analysis
increases a chance that true positive features might
enter some potential subsets. Through these phases,
a final collection of parsimonious subsets G
post
is
able to safely accomplish.
As biomedical researchers are always more
interested in candidate genes regarding a specific
disease, in a word, a gene signature is a main issue
to find potentially biomarkers, biological process,
molecular function, cellular mechanism, and
regulatory motifs. Conventional gene selectors
usually allow people select genes as many as they
can to define a gene signature so the final step of our
method is to aggregate genes to establish a gene list
where an appropriate gene signature might be found.
Since each subset
∈
is built by a seed
feature f
s
, the strength of relevance between f
s
and C
is able to use as an indicator for gene aggregation.
We first select a subset having the most relevant
seed feature, and aggregating genes by considering
next subset whose seed feature is the next most
relevant to C. This procedure proceeds until no
genes can be accumulated (G=G
post
) or a preferred
gene signature G is defined.
4 EXPERIMENTAL RESULTS
To show the proposed framework is potentially
capable of selecting the most discriminative gene
signature for phenotype prediction and of finding
significant genetic regulation within the selected
signature, a publicly available microarray-based
brain cancer classification data was used (Nutt et al.,
2003). The experiment was designed to investigate
whether high-throughput gene expression profiling
could classify high grade gliomas better than
histological classification. The data set consists of
50 samples and 12,625 probe-sets using Affymetrix
Human Genome U95Av2 Array. Out of 50 high
grade gliomas, there are 28 glioblastomas (GBM)
and 22 anaplastic oligodendrogliomas (AO). Upon
this gene expression matrix, features were
discretized to three bins as suggested by (Ding and
Peng, 2005) and each bin was then designated by a
discrete value such as 1, 3 and 5 for the better
calculation of information theoretic measures. We
evaluated the proposed framework with three model-
free feature selection filters (mRMR, cmim and fcbf)
to know the capacities of four gene selectors in
terms of classification performance and enrichment
analysis. While classification performance reveals
how good a selected model could predict,
enrichment analysis could display whether a gene
signature actively involves gene synergy.
Because of the curse of dimensionality, the
conventional training-test data partition given a ratio
(say 60-40%) is not very appropriate for the
assessment of gene selection approaches in the
domain of high-throughput gene expression data.
Thus, the procedure of leave-one-out cross-
validation (LOOCV) was used in our experiments.
Three performance measures were chosen to assess
the predictive power of selectors. They are the
number of misclassification (ERR), the area under a
receiver operating characteristic curve (AUC) and
the Matthews correlation coefficient (MCC).
Besides, a reference classifier is required to induct
filter-based feature selectors into a learning process.
This is due to their independence of learning
methods. We utilized the k-nearest-neighbour (k-NN)
classifier (k=3) to establish classification models
after gene selectors had been performed.
There were three feasible subsets generated by
iRDA for the binary classification of the brain
dataset and 8 unique features in total were involved
in these subsets. Hence, three sets of features were
established by mRMR, cmim and fcbf and each set
had eight features to be compared with iRDA. From
the viewpoint of parsimony, a minimal feature
subset is selected to evaluate how well the chosen
features could dedicate themselves to a class versus
those features of the other three selectors, results
shown in Table 1. The optimal subset was the one
led by the first seed feature and its cardinality was
just three. The misclassification rate was 0.4 that
was also the lowest one and only fcbf could reach
the same level using four genes. In addition, the
four-gene set of fcbf had the highest of MCC
performance, 92.26%, very slightly better than the
Table 1: Prediction performance in terms of parsimony.
iRDA mRMR cmim fcbf
% #Gene % #Gene % #Gene % #Gene
ERR 4.00 3 6.00 4 6.00 6 4.00 4
AUC 99.68 3 98.54 8 100 7 94.72 5
MCC 92.11 3 87.96 4 88.32 6 92.26 4
AFrameworkforHigh-ThroughputGeneSignatureswithMicroarray-basedBrainCancerGeneExpressionProfiling
Data
217
three-gene set of iRDA by 0.15%. The best AUC
performance went to the cmim gene signature at the
level of 100% whereas the minimal gene set of
iRDA had nearly approached the same level by
0.32%; however, cmim had employed seven genes
more than twice the features produced by iRDA. In
sum, a parsimony model of the three-gene set built
by iRDA had very good predictive power from all
aspect of performance measures.
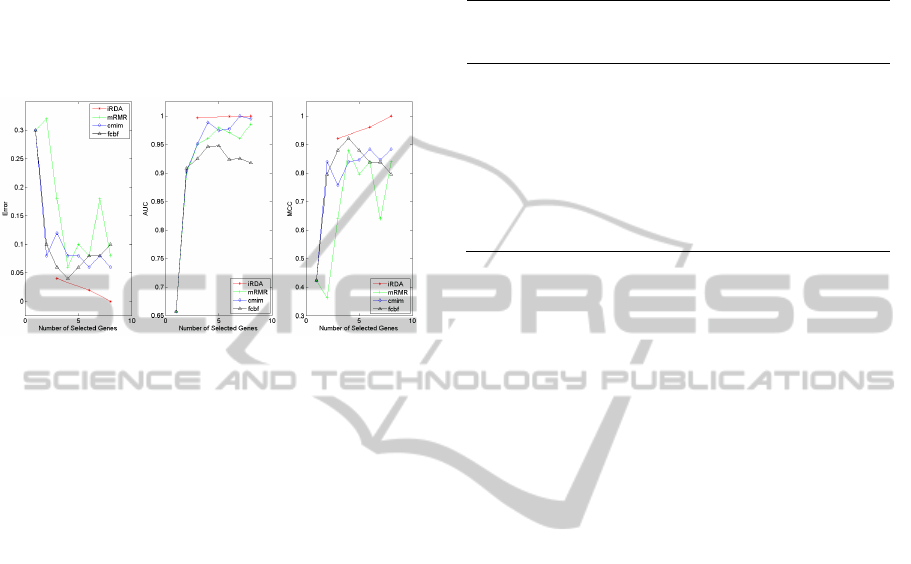
Figure 2: Classification performance in four sets of gene
signatures.
Other than the selection of a parsimonious subset,
it is also an essential matter to select one of the best
gene signatures with a reasonable gene size that
could have the strongest classification performance
and a strong possibility for biological findings
regarding a certain disease or cancer such as
biomarkers or regulatory modules. To do so, three
feature subsets of iRDA were aggregated in order of
the seed feature relevance to C and eventually an
eight-gene signature could be established. We then
compared our gene sets with those of mRMR, cmim
and fcbf to know the performance among them and
to see what the best gene signature would be. Figure
2 shows that when iRDA aggregated the other
features led by the other seeds into a parsimony
model, classification performance was stronger and
stronger, finally leading to no misclassification.
Meanwhile, both AUC & MCC performance could
also approach the highest level of 100% even though
the parsimony model initially could not greatly
outperform all of the other methods as discussed in
Table 1. Furthermore, it is observed that except the
proposed method no the other selectors here were
able to dominate all of the three performance
measures. For instance, when we only compared
mRMR, cmim and fcbf, fcbf could have the best
level of error and the MCC performance but its AUC
level was undoubtedly the lowest. Similarly, cmim
was able to reach the AUC value at 100% but was
decidedly inferior to fcbf in either error or MCC. In
a word, iRDA was far superior to the compared gene
filters in terms of classification error and
performance and an eight-gene signature (the full
feature set of iRDA) was recognised as the best one.
Table 2: Gene Set Enrichment Analysis.
iRDA mRMR cmim fcbf
Native Features 8 8 8 8
Collapsed Features 7 8 7 8
Enrichment in GBM
FDR<25% 3 0 0 0
p-value<5% 6 0 0 1
Enrichment in AO
FDR<25% 3 1 1 0
p-value<5% 4 1 2 0
Enrichment in total
FDR<25% 6 1 1 0
p-value<5% 10 1 2 1
Since the proposed method has paid attention to
feature interdependence, it is an essential issue to
know if there is any molecular information extracted
from a gene signature that is generated by gene
selectors. This relates to enrichment analysis that
might provide an insight as to how genes inter-
actively work together about biological process. A
tool of gene set enrichment analysis, GSEA
(Subramanian et al., 2005), was employed in this
paper to see how many gene sets are statistically
significantly enriched based on a collection of a
priori annotated gene sets, here MSigDB database
was considered. We generated four sets of eight-
gene signatures from four gene selectors, the same
as we mentioned in Figure 2, to be studied on GSEA
with MSigDB. After the process of collapsing
original features into gene symbols, there were 7
genes in iRDA and cmim signatures and 8 genes in
mRMR and fcbf signatures. Based on these
collapsed features, Table 2 shows that given an
iRDA gene signature, there were 6 and 4 gene sets
recognised as statistically significant enrichment in
two phenotypes of GBM and AO respectively (p-
value<0.05) while the other three gene signatures
had far fewer enriched gene sets. Moreover, out of
up-regulated gene sets in two phenotypes, 6 gene
sets were statistically significantly enriched in total
(FDR<0.25) for the iRDA gene signature – by far
the most number of enrichment in this study.
In addition to GSEA, we have also adopted
WebGestalt (Wang et al., 2013) to carry out a
functional genomic enrichment analysis that
biological themes of gene lists could be open to
interpretation. The same sets of four gene signatures
as used in GSEA were once again submitted to
WebGestalt. After transferring probe-set id into gene
symbol, the number of gene remained in their
ICAART2014-InternationalConferenceonAgentsandArtificialIntelligence
218

Table 3: Functional Genomic Enrichment Analysis.
iRDA mRMR cmim fcbf
Selected Probe-Sets 8 8 8 8
Mapped Genes 7 7 6 8
#Gene #Factor #Gene #Factor #Gene #Factor #Gene #Factor
Transcription Factor 5 5 0
2 2 0
MicroRNA 5 8 2 1 2 1 2 1
Disease 2 1 0
0
0
p-value<0.05
original gene sets was 7, 7, 6 and 8 for the signatures
of iRDA, mRMR, cmim and fcbf, respectively.
These remained genes would be the basis to see how
many functional factors could be found and how
many genes have been involved in those identified
biological factors at the statistical significance level
of 0.05. Gene synergy is initially one of our main
ideas to develop a new gene selector; therefore it is
important to understand if there are any relationships
between gene regulatory modules and a gene set. We
have found that 5 genes in iRDA seven-gene
signature were connected to five transcription
factors and eight microRNA targets, respectively;
and there were only two interactions found between
two transcription factors and two genes within the
cmim six-gene signature while no interactive
relationships with transcription factor were found in
the gene signatures of mRMR and fcbf (see Table 3).
Although one microRNA-mRNA interaction was
found with two genes in the gene lists of mRMR,
cmim and fcbf, the discovered interaction was
actually the same one and included in iRDA
microRNA-mRNA findings. To reveal cancer-
related genes, disease association analysis was
performed. Out of the iRDA selected genes, a report
has statistically significantly related two genes to the
disease of inflammation – one of key factors in
tumour development (Coussens et al., 2013).
5 CONCLUSIONS
A framework for high throughput gene signatures,
named iRDA, is presented in this paper. Whereas
individual features are searched in conventional
gene selection in a either univariate or multivariate
manner, the proposed filter is mainly focused on
feature fusion. Single feature relevance to a class
variable is just used as an indicator throughout the
framework. By using a number of information
theoretic measures and through a series of analysis
of feature characteristics including relevance,
interdependence, redundancy and dependence, the
iRDA gene selector is devised around gene synergy
based on feature pairs and seed features that lead to
various possible parsimonious set of feature. With a
simple aggregation scheme, a gene signature is
eventually able to be defined for finding biological
information related to a certain disease in different
phenotypes.
To demonstrate the effectiveness of this newly
developed gene selector in the domain of high-
throughput gene signatures, a brain cancer gene
expression profiling data was examined. This
expression matrix was derived from Affymetrix
Human Genome U95Av2 Array, and having 50
labelled samples and 12,625 interrogated genes. The
curse of dimensionality implicates that the task of
gene selection is an enormous computing challenge.
Based on the brain cancer data set, we have
compared iRDA with three filters (mRMR, cmim
and fcbf) that are widely discussed in the research
community. Also, these methods all use information
theoretic measures. The experimental results show
that an 8-gene signature was defined by iRDA and it
outperformed the other three methods in terms of
classification performance with three performance
measures. Meanwhile, we performed two sets of
enrichment analysis to see how effectively feature
interdependence has been tackled in the framework.
The results also show that more statistically
significant gene sets and genetic regulatory
interactions could be found in our gene signature.
Furthermore, within the iRDA 8-gene signature,
there were two genes associated with a disease of
inflammation at the statistical significance level.
And no the other filters could find disease-related
genes. The rationale behind these significant
findings is that our method is able to find an
important feature which is individually weakly
relevant to a class but might have strong
interdependence between features. This type of
genes accompanied by other genes in a selected gene
list would more contribute to the phenotype than
they appear solely at the expression level. Except for
iRDA, however, most recent filter-based feature
selectors could not search for these features that may
attract the interest of the domain user.
AFrameworkforHigh-ThroughputGeneSignatureswithMicroarray-basedBrainCancerGeneExpressionProfiling
Data
219

We think that our iRDA framework can have the
capacity of finding small size gene signatures with a
potentially high predictive power that, in turn, could
disclose biological information regarding gene
synergy.
REFERENCES
Albrecht, A., Vinterbo, S. A. & Ohno-Machado, L. 2003.
An Epicurean learning approach to gene-expression
data classification. Artificial Intelligence in Medicine,
28, 75-87.
Alon, U., Barkai, N., Notterman, D. A., Gish, K., Ybarra,
S., Mack, D. & Levine, A. J. 1999. Broad patterns of
gene expression revealed by clustering analysis of
tumor and normal colon tissues probed by
oligonucleotide arrays. Proceedings of the National
Academy of Sciences, 96, 6745-6750.
Bell, D. A. & Wang, H. 2000. A formalism for relevance
and its application in feature subset selection. Machine
Learning, 41, 175-195.
Brown, G., Pocock, A., Zhao, M.-J. & Luj N, M. 2012.
Conditional likelihood maximisation: A unifying
framework for information theoretic feature selection.
The Journal of Machine Learning Research, 13, 27-66.
Coussens, L. M., Zitvogel, L. & Palucka, A. K. 2013.
Neutralizing tumor-promoting chronic inflammation: a
magic bullet? Science, 339, 286-291.
Cover, T. M. & Thomas, J. A. 2012. Elements of
Information Theory, John Wiley & Sons.
Davies, S. & Russell, S. NP-completeness of searches for
smallest possible feature sets. Proceedings of the 1994
AAAI Fall Symposium on Relevance, 1994. 37-39.
Ding, C. & Peng, H. 2005. Minimum redundancy feature
selection from microarray gene expression data.
Journal of Bioinformatics and Computational Biology,
3, 185-205.
Ein-Dor, L., Zuk, O. & Domany, E. 2006. Thousands of
samples are needed to generate a robust gene list for
predicting outcome in cancer. Proceedings of the
National Academy of Sciences, 103, 5923-5928.
Fleuret, F. 2004. Fast binary feature selection with
conditional mutual information. The Journal of
Machine Learning Research, 5, 1531-1555.
Gheyas, I. A. & Smith, L. S. 2010. Feature subset
selection in large dimensionality domains. Pattern
Recognition, 43, 5-13.
Guyon, I., Weston, J., Barnhill, S. & Vapnik, V. 2002.
Gene selection for cancer classification using support
vector machines. Machine Learning, 46, 389-422.
Kim, S.-Y. 2009. Effects of sample size on robustness and
prediction accuracy of a prognostic gene signature.
BMC Bioinformatics, 10, 147.
Kohavi, R. & John, G. H. 1997. Wrappers for feature
subset selection. Artificial Intelligence, 97, 273-324.
Lai, H.-M., Albrecht, A. & Steinhofel, K. 2013. Gene
selection guided by feature interdependence. World
Academy of Science, Engineering and Technology
(WASET), 1432-1438.
Lazar, C., Taminau, J., Meganck, S., Steenhoff, D.,
Coletta, A., Molter, C., De Schaetzen, V., Duque, R.,
Bersini, H. & Now , A. 2012. A survey on filter
techniques for feature selection in gene expression
microarray analysis. IEEE/ACM Transactions on
Computational Biology and Bioinformatics (TCBB), 9,
1106-1119.
Mundra, P. A. & Rajapakse, J. C. 2010. SVM-RFE with
MRMR filter for gene selection. NanoBioscience,
IEEE Transactions on, 9, 31-37.
Nevins, J. R. & Potti, A. 2007. Mining gene expression
profiles: expression signatures as cancer phenotypes.
Nature Reviews Genetics, 8, 601-609.
Nutt, C. L., Mani, D., Betensky, R. A., Tamayo, P.,
Cairncross, J. G., Ladd, C., Pohl, U., Hartmann, C.,
Mclaughlin, M. E. & Batchelor, T. T. 2003. Gene
expression-based classification of malignant gliomas
correlates better with survival than histological
classification. Cancer Research, 63, 1602-1607.
Saeys, Y., Inza, I. & Larra Aga, P. 2007. A review of
feature selection techniques in bioinformatics.
Bioinformatics, 23, 2507-2517.
Subramanian, A., Tamayo, P., Mootha, V. K., Mukherjee,
S., Ebert, B. L., Gillette, M. A., Paulovich, A.,
Pomeroy, S. L., Golub, T. R. & Lander, E. S. 2005.
Gene set enrichment analysis: a knowledge-based
approach for interpreting genome-wide expression
profiles. Proceedings of the National Academy of
Sciences, 102, 15545-15550.
Wang, J., Duncan, D., Shi, Z. & Zhang, B. 2013. WEB-
based GEne SeT AnaLysis Toolkit (WebGestalt):
update 2013. Nucleic Acids Research, 41, W77-W83.
Yu, L. & Liu, H. 2004. Efficient feature selection via
analysis of relevance and redundancy. The Journal of
Machine Learning Research, 5, 1205-1224.
Zhou, X. & Tuck, D. P. 2007. MSVM-RFE: extensions of
SVM-RFE for multiclass gene selection on DNA
microarray data. Bioinformatics, 23, 1106-1114.
ICAART2014-InternationalConferenceonAgentsandArtificialIntelligence
220
