
A Composed Confidence Measure for Automatic Face Recognition in
Uncontrolled Environment
Pavel Kr´al
1,2
and Ladislav Lenc
1,2
1
Department of Computer Science and Engineering, University of West Bohemia, Plzeˇn, Czech Republic
2
NTIS - New Technologies for the Information Society, University of West Bohemia, Plzeˇn, Czech Republic
Keywords:
Face Recognition, Czech News Agency, Confidence Measure, Multi-layer Perceptron, Scale Invariant Feature
Transform (SIFT).
Abstract:
This paper is focused on automatic face recognition in order to annotate people in photographs taken in com-
pletely uncontrolled environment. Recognition accuracy of the current approaches is not sufficient in this
case and it is thus beneficial to improve the results. We would like to solve this issue by proposing a novel
confidence measure method to identify the incorrectly classified examples at the output of our classifier. The
proposed approach combines two measures based on the posterior probability and two ones based on the
predictor features in a supervised way. The experiments show that the proposed approach is very efficient,
because it detects almost all erroneous examples.
1 INTRODUCTION
Automatic face recognition consists in the use of
a computer for identification of a person from a digital
photograph. This area has been focused on by many
researchers and many algorithms have been proposed
during the past two decades. Nowadays, face recog-
nition can be seen as one of the most progressive bio-
metric authentication methods and represents a key
task in several commercial or law enforcement ap-
plications as for example surveillance of wanted per-
sons, access control to restricted areas, automatic an-
notation of the photos used in the recently very pop-
ular photo sharing applications or in the social net-
works, etc.
The majority of the proposed methods achieves
high recognition accuracy only in the particular con-
ditions (sufficiently aligned faces, similar face pose
and lighting conditions, etc.). Unfortunately, their
recognition results are significantly worse when the
above mentioned constraints are not fulfilled. Many
approaches to resolve this issue have been proposed,
however only few of them perform well in a fully un-
controlled environment.
In our previous work, we proposed the SIFT based
Kepenekci face recognition method (Lenc and Kr´al,
2013) and showed that it significantly outperforms
other approaches particularly on the uncontrolled face
images. However, its recognition accuracy is still not
perfect. Therefore, we proposed in (Lenc and Kr´al,
2011) two Confidence Measure (CM) approaches in
order to detect and handle incorrectly recognized ex-
amples. These approaches are based on the pos-
terior class probability. We experimentally showed
that these approaches are very promising in our task.
However, it is beneficial a further improvement of the
results.
The main goal of this paper thus consists in
proposing a novel composed confidence measure ap-
proach which would improve the results of the meth-
ods proposed previously. This approach combines
two previously proposed measures with two novel
ones in a supervised way using a multi-layer percep-
tron classifier. The novel measures are based on the
predictor features which characterize our face model.
The results of this work will be used by the Czech
News Agency (
ˇ
CTK
1
) to annotate people in pho-
tographs during insertion into the photo-database
2
.
The following section gives a brief overview of
important face recognition and confidence measure
approaches. Section 3 describes our face recognition
method. This section also details the proposed con-
fidence measure approach. Section 4 evaluates and
compares the performance of our confidence measure
on the
ˇ
CTK corpus. In the last section we discuss the
1
http://www.ctk.eu
2
http://multimedia.ctk.cz/en/foto/
230
Král P. and Lenc L..
A Composed Confidence Measure for Automatic Face Recognition in Uncontrolled Environment.
DOI: 10.5220/0004926202300237
In Proceedings of the 6th International Conference on Agents and Artificial Intelligence (ICAART-2014), pages 230-237
ISBN: 978-989-758-015-4
Copyright
c
2014 SCITEPRESS (Science and Technology Publications, Lda.)

achieved results and give some further research direc-
tions.
2 RELATED WORK
This section is composed of two parts. The success-
ful face recognition approaches are described in the
first part, while the second part is focused on the con-
fidence measure task itself.
2.1 Face Recognition
One of the first successful approaches is Eigen-
faces (Turk and Pentland, 1991). This approach is
based on the Principal Component Analysis (PCA).
Unfortunately, it is sensitive on variations in lighting
conditions, pose and scale. However, the PCA based
approaches are still popular, as shown in (Poon et al.,
2011).
Another method, the Fisherfaces (Belhumeur
et al., 1997), is derived from Fisher’s Linear Discrim-
inant (FLD). According to the authors, this approach
should be less sensitive to changing lighting condi-
tions than Eigenfaces.
Independent Component Analysis (ICA) can be
also successfully used in the automatic face recog-
nition field (Bartlett et al., 2002).Contrary to Eigen-
faces, ICA uses higher order statistics. It thus pro-
vides more powerful data representation. The authors
showed that ICA performs slightly better than PCA
method on the FERET corpus.
Another efficient face recognition approach is
the Elastic Bunch Graph Matching (EBGM) (Bolme,
2003). This approach uses features constructed by
the Gabor wavelet transform. Several other suc-
cessful approaches based on Gabor wavelets have
been introduced (Shen and Bai, 2006). Some ap-
proaches (Shen, 2005) combine the pre-processing
with Gabor wavelets with well-established methods
such as Eigenfaces, Fisherfaces, etc.
Kepenekci proposes in (Kepenekci, 2001) an al-
gorithm that addresses the main issue of Elastic
Bunch Graph Matching, manual labelling of the land-
marks. The proposed method outperforms the classi-
cal EBGM.
Recently, the Scale Invariant Feature Transform
(SIFT) is successfully used for face recognition (Aly,
2006). The main advantage of this approach is the
ability to detect and describe local features in images.
The features are invariant to image scaling, transla-
tion and rotation. Moreover, they are also partly in-
variant to changes in illumination. Therefore, this ap-
proach is beneficial for face recognition in real con-
ditions where the images differ significantly. Another
approach based on the SIFT, called Fixed-key-point-
SIFT (FSIFT), is presented in (Krizaj et al., 2010).
For further information about the face recognition,
please refer to the survey (Beham and Roomi, 2013).
2.2 Confidence Measure
Confidence measure is used as a post-processing of
the recognition to determine whether the result is
correct or not. The incorrectly recognized samples
should be removedfrom the recognition set or another
processing (e.g. manual correction) can be further re-
alized.
This technique is mainly used in the automatic
speech processing field (Senay et al., 2011; Wessel
et al., 2001) and is mostly based on the posterior class
probability. However, two other groups of approaches
exist (Jiang, 2005). The first one uses a classifier in
order to decide whether the classification is correct or
not. This classifier uses a set of the so-called predictor
features which should have a maximal discriminabil-
ity between the correct and incorrect classes. The
second group uses a likelihood ratio between the null
(a correct recognition) and the alternative (an incor-
rect recognition) hypotheses.
The confidence measure can be successfully used
in other research areas as shown in (Servin et al.,
2010) for genome maps construction, in (Hu and Mor-
dohai, 2012) for stereo vision or in (Marukatat et al.,
2002) for handwriting sentence recognition.
Another approach related to the confidence mea-
sure is proposed by Proedrou et al. in the pattern
recognition task (Proedrou et al., 2002). The authors
use a classifier based on the nearest neighbours algo-
rithm. Their confidence measure is based on the al-
gorithmic theory of randomness and on transductive
learning.
Unfortunately, only few works about the confi-
dence measure in the face recognition domain exist.
Li and Wechsler propose a face recognition system
which integrates a confidence measure (Li and Wech-
sler, 2003) in order to reject unknown individuals or
to detect incorrectly recognized faces. Their confi-
dence measure is, as in the previous case, based on
the theory of randomness. The proposed approaches
are validated on the FERET database.
Eickeler et al. propose and evaluate in (Eickeler
et al., 2000) five other CMs also in the face recog-
nition task. They use a pseudo 2-D Hidden Markov
Model classifier with features created by the Discrete
Cosine Transform (DCT). Three proposed confidence
measures are based on the posterior probabilities and
two others on ranking of results. Authors experimen-
AComposedConfidenceMeasureforAutomaticFaceRecognitioninUncontrolledEnvironment
231

tally show that the posterior class probability gives
better results for the recognition error detection task.
Note that the most of the proposed approaches
are unsupervised. However, the supervised (Sukkar,
1994) and semi-supervised (Deng and Schuller, 2012)
methods have been also proposed.
3 CONFIDENCE MEASURE FOR
FACE RECOGNITION
3.1 Face Recognition
For the face recognition task, we use our previously
proposed SIFT based Kepenekci method (Lenc and
Kr´al, 2013) which uses the efficient SIFT algorithm
for parametrization and adapted Kepenekci match-
ing (Lenc and Kr´al, 2012) for recognition. This
method was chosen, because as proven previously,
it significantly outperforms other approaches partic-
ularly on lower quality real data.
3.1.1 SIFT Parametrization
This algorithm creates an image pyramid with re-
sampling between each level to determine potential
key-point positions. Each pixel is compared with its
neighbours. Neighbours in its level as well as in the
two neighbouring levels are analysed. If the pixel is
maximum or minimum of all neighbouring pixels, it
is considered to be a potential key-point.
For the resulting set of key-points their stability
is determined. The locations with low contrast and
unstable locations along edges are deleted.
The orientation of each key-point is computed
next. The computation is based on gradient orienta-
tions in the neighbourhood of the pixel. The values
are weighted by the magnitudes of the gradient.
The last step consists in the descriptor creation.
The computation involves the 16× 16 neighbourhood
of the pixel. Gradient magnitudes and orientations are
computed in each point of the neighbourhood. Their
values are weighted by a Gaussian. For each sub-
region of size 4× 4 (16 regions), the orientation his-
tograms are created. Finally, a vector containing 128
(16× 8) values is created.
3.1.2 Adapted Kepenekci Matching
This approach combines two methods of matching
and uses the weighted sum of the two results.
Let T be a test image and G a gallery image. For
each feature vector t of face T we determine a set of
relevant vectors g of face G. Vector g is relevant iff:
q
(x
t
− x
g
)
2
+ (y
t
− y
g
)
2
< distanceThreshold (1)
where x and y are the coordinates of the feature
vector points.
If no relevant vector to vector t is identified, vec-
tor t is excluded from the comparison procedure. The
overall similarity of two faces OS is computed as the
average of similarities between each pair of corre-
sponding vectors as:
OS
T,G
= mean{S(t,g),t ∈ T, g ∈ G} (2)
Then, the face with the most similar vector to each
of the test face vectors is determined. TheC
i
value de-
notes how many times gallery face G
i
was the closest
one to some of the vectors of test face T. The similar-
ity is computed as C
i
/N
i
where N
i
is the total number
of feature vectors in G
i
. The weighted sum of these
two similarities is used for similarity measure:
FS
T,G
= αOS
T,G
+ β
C
G
N
G
(3)
The face is recognized by the following equation:
ˆ
FS
T,G
= argmax
G
(FS
T,G
) (4)
The cosine similarity is used for vector compari-
son.
3.2 Confidence Measure
3.2.1 Posterior Class Probability Approaches
Let P(F|C) be the output of the classifier, where C
is the recognized face class and F represents the face
features. The values P(F|C) are normalized to com-
pute the posterior class probabilities as follows:
P(C|F) =
P(F|C).P(C)
∑
I∈F I M
P(F|I).P(I)
(5)
F I M represents the set of all individuals and P(C)
denotes the prior probability of the individual’s(face)
class C.
We propose two different approaches. In the
first approach, called absolute confidence value, only
faces
ˆ
C complying with
ˆ
C = argmax
C
(P(C|F)) (6)
P(
ˆ
C|F) > T (7)
are considered as being recognized correctly.
The second approach, called relative confidence
value, computes the difference between the best score
and the second best one by the following equation:
P∆ = P(
ˆ
C|F) − max
C6=
ˆ
C
(P(C|F)) (8)
ICAART2014-InternationalConferenceonAgentsandArtificialIntelligence
232

Only the faces with P∆ > T are accepted. This ap-
proach aims to identify the “dominant” faces among
all the other candidates. T is the acceptance threshold
and its optimal value is adjusted experimentally.
Note that these two measures working separately
were already presented in (Lenc and Kr´al, 2011).
However, their description is important in the context
of the whole composed approach.
3.2.2 Predictor Feature Approaches
As already stated, this type of approaches uses the
features with a maximal discriminability between the
correct and incorrect classes to classify the recogni-
tion results. Two measures are proposed next.
The first one is based on the number of vectors
in the model with the highest output value during the
recognition task (i.e. the recognized face model). The
number of vectors is given by the results of the SIFT
algorithm. A face model with a high number of vec-
tors is more general and it can be more likely iden-
tified as a good one. Conversely, a few vector face
model is more accurate. Therefore, when this model
is chosen as a good one (the highest output value) we
assume that it is very probable that the recognition is
correct.
Let V be the number of vectors in the face model
and let T be the acceptance threshold. Only the faces
where V < T are accepted. The optimal value of the
threshold T will be set experimentally. This measure
is hereafter called the vector number approach.
The second measure uses a standard deviation of
the similarities among images in the recognized face
model. Let the recognized model M be composed of
the images I
1
,I
2
,..., I
N
. The S measure is defined as
follows:
S =
s
1
N
N
∑
i=1
(FS
I
i
,M\ I
i
− µ)
2
(9)
where FS
I
i
,M\ I
i
is the similarity (see Equation 3)
of the image I
i
and a model M \ I
i
created from the
remaining images from model M and µ is computed
by the following equation:
µ =
1
N
N
∑
i=1
FS
I
i
,M\ I
i
(10)
Similarly as in the case of the vector number mea-
sure we suppose that higher standard deviation char-
acterizes a more general face model and vice versa.
Therefore, only the recognition results where S < T
are accepted. The optimal value of the acceptance
threshold T will be set experimentally. This measure
is hereafter called the standard deviation approach.
Figure 1: Examples of one face from the
ˇ
CTK face corpus.
3.2.3 Composed Supervised Approach
Let R
k
be the score obtained by a partial unsupervised
measure k described above and let variable H deter-
mines whether the face image is classified correctly
or not. A Multi-layer Perceptron (MLP) which mod-
els the posterior probability P(H|R
1
,.., R
N
) is used
to combine all partial measures in a supervised way.
Note that the variable N represents the number of
measures to combine
In order to identify the best performing topol-
ogy, several combinations and MLP configurations
are built and evaluated. The MLP topologies will be
described in detail in the experimental section.
4 EXPERIMENTS
4.1 Czech News Agency Corpus
This corpus is composed of images of individuals in
an uncontrolled environment that were randomly se-
lected from the large
ˇ
CTK database. All images were
taken over a long time period (20 years or more). The
corpus contains grey-scale images of 638 individuals
of size 128 × 128 pixels. It contains about 10 images
for each person. The orientation, lighting conditions
and image backgrounds differ significantly.
Figure 1 shows examples of one face from this
corpus. This corpus is available for free for research
purposesat http://home.zcu.cz/∼pkral/sw/or upon re-
quest to the authors.
4.2 Recognition Results with
Confidence Measure
Three experiments are described next. The first exper-
iment analyses the discriminability of the proposed
partial measures by histograms. This experiment is
realized in order to show the suitability of the pro-
posed measures. The second experiment reports the
results of the measures also used separately. In the
last experiment, we show the classification results of
the whole composed approach.
AComposedConfidenceMeasureforAutomaticFaceRecognitioninUncontrolledEnvironment
233
4.2.1 Discriminability of the Proposed Measures
In the first experiment, we would like to analyse the
discriminability of the proposed partial measures. We
created two histograms for every measure in order
to analyse the distribution of the correctly and incor-
rectly classified faces. The reported output densities
of the measures are based on the 638 values (the num-
ber of individuals in the corpus). Note that all output
values are normalized to the interval [0..1].
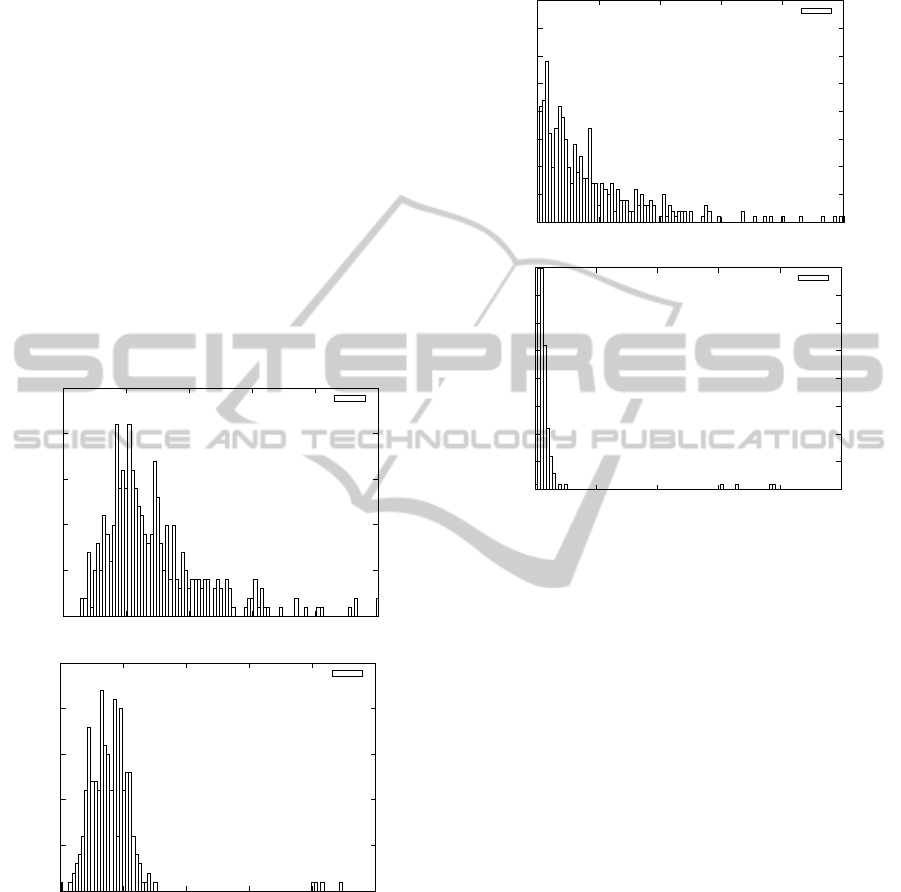
Figure 2 shows the output densities of the cor-
rectly and incorrectly classified faces when the ab-
solute confidence value measure is used. These his-
tograms show that the majority of the correctly rec-
ognized face examples has higher output values than
the incorrectly recognized ones. This fact confirms
our assumption that the first measure is suitable for
our task and should be useful to be integrated to the
whole composed method.
0
5
10
15
20
25
0 0.2 0.4 0.6 0.8 1
Frequency
Value
Correctly recognized faces
0
5
10
15
20
25
0 0.2 0.4 0.6 0.8 1
Frequency
Value
Incorrectly recognized faces
Figure 2: Histograms of the correctly (top) and incor-
rectly (bottom) classified faces using the absolute confi-
dence value measure.
Figure 3 plots the output densities when the rel-
ative confidence value measure is used. These his-
tograms show clearly that the discriminability of this
measure is better than the previous one. Almost all
correctly recognized face examples have higher out-
put values than the incorrectly recognized samples.
Therefore this measure should be suitable for our task
and we decided to combine it with the other ones by
an MLP. Moreover, we assume that this measure used
separately outperforms the previously proposed one.
0
5
10
15
20
25
30
35
40
0 0.2 0.4 0.6 0.8 1
Frequency
Value
Correctly recognized faces
0
5
10
15
20
25
30
35
40
0 0.2 0.4 0.6 0.8 1
Frequency
Value
Incorrectly recognized faces
Figure 3: Histograms of the correctly (top) and incorrectly
(bottom) classified faces using the relative confidence value
measure.
Figure 4 depicts the output densities when the vec-
tor number measure is used. These histograms show
that this measure is less discriminant than the two
ones presented previously. However, the correctly
recognized examples have slightly inferior output val-
ues than the incorrectly ones. This fact confirms our
assumption (see Sec. 3.2.2) that the confidence of
a few vector model is high. We assume that this mea-
sure will bring poor results if used separately. How-
ever, it can add some further information when it will
be combined with the other approaches. Therefore,
we decided to integrate it into the whole composed
approach.
The output densities of the last standard deviation
measure are reported in Figure 5. The discriminabil-
ity of these two histograms are limited and it is diffi-
cult to propose some conclusions about this measure.
However, we decided to use this measure in the fur-
ther experiments and verify its usefulness experimen-
tally.
To summarize:
• relative confidence value (rel) measure is the best
proposed one;
• absolute confidence value (abs) method has also
very good separation abilities;
ICAART2014-InternationalConferenceonAgentsandArtificialIntelligence
234
0
5
10
15
20
25
0 0.2 0.4 0.6 0.8 1
Frequency
Value
Correctly recognized faces
0
5
10
15
20
25
0 0.2 0.4 0.6 0.8 1
Frequency
Value
Incorrectly recognized faces
Figure 4: Histograms of the correctly (top) and incorrectly
(bottom) classified faces using the vector number measure.
0
5
10
15
20
25
0 0.2 0.4 0.6 0.8 1
Frequency
Value
Correctly recognized faces
0
5
10
15
20
25
0 0.2 0.4 0.6 0.8 1
Frequency
Value
Incorrectly recognized faces
Figure 5: Histograms of the correctly (top) and incorrectly
(bottom) classified faces using the standard deviation mea-
sure.
• vector number (vect) measure can bring some
complementary information for our task;
• contribution of the standard deviation (sd) mea-
sure is questionable and must be confirmed exper-
imentally.
4.2.2 Accuracy of the Separate Measures
In the second experiment we would like to show the
performance of the above described measures used
separately without any combination. As in many
other articles in the confidence measure field, we
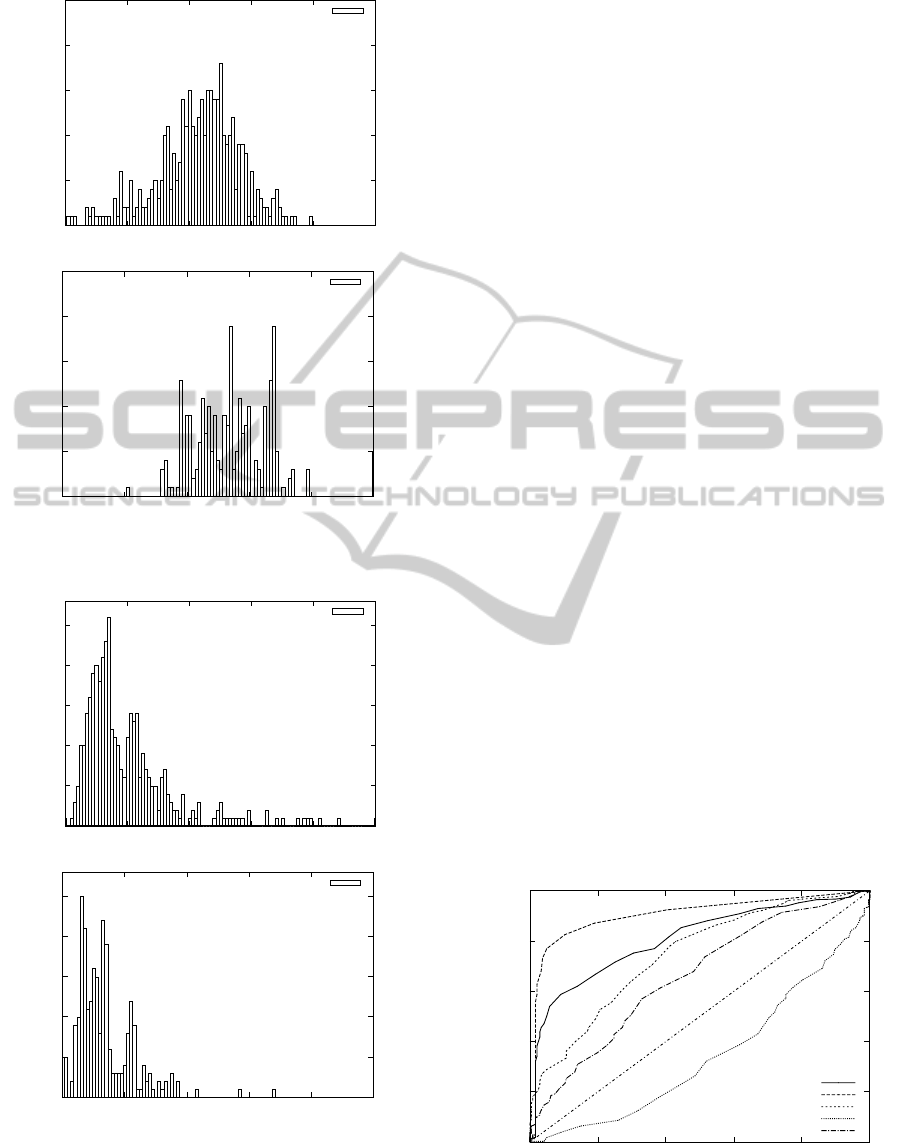
will use the Receiver Operating Characteristic (ROC)
curve (Brown and Davis, 2006) for evaluation of this
experiment. This curve clearly shows the relationship
between the true positive and false positive rates for
the different acceptance threshold.
Figure 6 shows the results of the separately used
absolute confidence value, relative confidence value,
vector number and standard deviation measures. This
experiment shows that the relative confidence value
method significantly outperforms the all other ap-
proaches.
We can further deduce that our assumption in the
fourth proposed measure was not correct. Based on
this experiment we can consider that the dependence
between the value of the standard deviation and the
correctly recognized faces is reversed. We modify the
definition of such measure as follows: only the faces
where S > T are accepted.
After this modification we can conclude that all
proposed measures are suitable for our task in order
to identify incorrectly recognized faces. Note that the
corrected version of the ROC curve of the fourth stan-
dard deviation measure is reported in this figure with
the modified sd caption.
We will further compare the results of the separate
measures with the whole composed approach. There-
0
0.2
0.4
0.6
0.8
1
0 0.2 0.4 0.6 0.8 1
True positive rate
False positive rate
abs
rel
vects
sd
modified sd
Figure 6: ROC curves of the four proposed measures used
separately. The corrected standard deviation measure is re-
ported with the modified sd label.
AComposedConfidenceMeasureforAutomaticFaceRecognitioninUncontrolledEnvironment
235

Table 1: Performance of the measures used separately [%].
Confidence Measure Prec Rec F-mes
absolute confidence value 65.7 60.6 63.0
relative confidence value 69.6 60.8 64.9
vector number 62.2 63.5 62.8
standard deviation 58.9 60.3 59.6
fore, we created the Table 1 to show the scores of the
separate measures with optimal threshold configura-
tions. The F-measure (F-mes) (Powers, 2011) is used
as an evaluation metric, the Precision (Prec) and Re-
call (Rec) are also reported in this table. Note that
the optimal threshold
ˆ
T value has been defined for
the “best” compromise between precision and recall
values as follows:
ˆ
T = argmin
T
| 1−
Prec
Rec
| (11)
4.2.3 Accuracy of the Whole Composed
Approach
In the last experiment, we will evaluate the results
of the whole composed confidence measure method.
First, we will show the impact of the use of an MLP
classifier with the separate measures. Then, we com-
pare and evaluate all possible combinations of the
proposed measures in order to show the complemen-
tarities among them.
Several MLP configurations are tested. The best
MLP topology uses three layers. The number of the
input neurons corresponds to the number of measures
to combine, 10 neurons are in the hidden layer and
two outputs are used to identify the correctly and in-
correctly recognized faces. This MLP topology was
set empirically on a small development corpus which
contains 120 examples (i.e. 120 confidence values).
The results of this experiment are reported in the
Table 2. These results show that the separate mea-
sures used with an MLP have better F-measure val-
ues (except sd approach) than used in the unsuper-
vised way. A successive addition of the measures
improves progressively the F-measure value. When
all measures are combined, the resulting F-measure is
close to 100%. This figure also shows that all mea-
sures bring complementary relevant information and
are thus useful to be integrated to the whole composed
approach (i. e. the whole combined approach gives
the best recognition score).
5 CONCLUSIONS AND
PERSPECTIVES
We proposed and evaluated a novel confidence mea-
sure approach in the automatic face recognition
Table 2: Performance of all combinations of the measures
by an MLP classifier [%].
Confidence Measure Prec Rec F-mes
1. Separate measures
abs. confidence value (abs) 92.5 64.8 76.2
rel. confidence value (rel) 96.2 80.4 87.6
vector number (vect) 55.4 84.9 67.0
standard deviation (sd) 54.0 65.3 59.1
2. Combinations of two measures
abs, rel 97.2 83.5 89.8
abs, sd 70.4 55.8 62.2
abs, vect 95.8 75.8 84.6
rel, sd 95.8 84.3 89.7
rel, vect 97.7 85.6 91.2
sd, vect 67.6 90.6 77.4
3. Combinations of three measures
abs, rel, sd 96.7 90.0 93.2
abs, rel, vect 97.2 93.7 95.4
abs, sd, vect 93.4 90.5 91.9
rel, sd, vect 94.8 94.8 94.8
4. Combination of all measures (the whole approach)
abs, rel, sd, vect 100 99.5 99.8
task. The proposed approach combines two measures
based on the posterior probability and two ones based
on the predictor features in a supervised way with an
MLP. We experimentally showed that the proposed
approach is very efficient, because it detects almost
all erroneous examples. We further showed that it is
possible to use all four proposed measures separately.
However,every measure brings complementary infor-
mation and it is thus beneficial to combine all mea-
sures in the composed approach. We decided that the
proposed confidence measure will be integrated into
our application for the
ˇ
CTK.
To summarize, the main scientific contribution of
this paper consists in:
1. proposing two novel measures based on the pre-
dictor features;
2. proposing a combined supervised confidence
measure approach which combines the measures
from two groups of methods; two ones based on
the posterior class probability and the other two
ones on the predictor features;
3. evaluation of the proposed method in the face
recognition task on the real
ˇ
CTK data.
The first perspective consists in proposing of
semi-supervised confidence measures. In this ap-
proach, the CM model will be progressively adapted
according to the recognized data. We will further inte-
grate other more suitable features into our model. An-
other perspective consists in the use of our confidence
measure approach in the task of automatic creation of
the face corpora.
ICAART2014-InternationalConferenceonAgentsandArtificialIntelligence
236

ACKNOWLEDGEMENTS
This work has been partly supported by the UWB
grant SGS-2013-029 Advanced Computer and Infor-
mation Systems and by the European Regional De-
velopment Fund (ERDF), project “NTIS - New Tech-
nologies for Information Society”, European Cen-
tre of Excellence, CZ.1.05/1.1.00/02.0090. We also
would like to thank Czech New Agency (
ˇ
CTK) for
support and for providing the photographic data.
REFERENCES
Aly, M. (2006). Face recognition using sift features.
Bartlett, M. S., Movellan, J. R., and Sejnowski, T. J. (2002).
Face recognition by independent component analysis.
IEEE Transactions on Neural Networks, pages 1450–
1464.
Beham, M. P. and Roomi, S. M. M. (2013). A review of face
recognition methods. International Journal of Pattern
Recognition and Artificial Intelligence, 27(4).
Belhumeur, P. N., Hespanha, J. a. P., and Kriegman, D. J.
(1997). Eigenfaces vs. fisherfaces: Recognition using
class specific linear projection. IEEE Transactions on
Pattern Analysis and Machine Intelligence.
Bolme, D. S. (2003). Elastic Bunch Graph Matching. PhD
thesis, Colorado State University.
Brown, C. D. and Davis, H. T. (2006). Receiver operating
characteristics curves and related decision measures:
A tutorial. Chemometrics and Intelligent Laboratory
Systems, 80(1):24–38.
Deng, J. and Schuller, B. (2012). Confidence measures in
speech emotion recognition based on semi-supervised
learning. In INTERSPEECH.
Eickeler, S., Jabs, M., and Rigoll, G. (2000). Comparison
of confidence measures for face recognition. In FG,
pages 257–263. IEEE Computer Society.
Hu, X. and Mordohai, P. (2012). A quantitative evaluation
of confidence measures for stereo vision. IEEE Trans-
actions on Pattern Analysis and Machine Intelligence,
34(11):2121–2133.
Jiang, H. (2005). Confidence measures for speech recog-
nition: A survey. Speech Communication, 45(4):455–
470.
Kepenekci, B. (2001). Face Recognition Using Gabor
Wavelet Transform. PhD thesis, The Middle East
Technical University.
Krizaj, J., Struc, V., and Pavesic, N. (2010). Adaptation of
sift features for robust face recognition.
Lenc, L. and Kr´al, P. (2011). Confidence measure for au-
tomatic face recognition. In International Conference
on Knowledge Discovery and Information Retrieval,
Paris, France.
Lenc, L. and Kr´al, P. (2012). Novel matching methods
for automatic face recognition using sift. In 8th AIAI
(Artificial Intelligence Applications and Innovations)
Confence, Halkidiki, Greece.
Lenc, L. and Kr´al, P. (2013). Face recognition under real-
world conditions. In International Conference on
Agents and Artificial Intelligence, Barcelona, Spain.
Li, F. and Wechsler, H. (2003). Open world face recog-
nition with credibility and confidence measures. In
Audio-and Video-Based Biometric Person Authentica-
tion, pages 462–469. Springer.
Marukatat, S., Arti`eres, T., Gallinari, P., and Dorizzi, B.
(2002). Rejection measures for handwriting sentence
recognition. In Frontiers in Handwriting Recogni-
tion, 2002. Proceedings. Eighth International Work-
shop on, pages 24–29. IEEE.
Poon, B., Amin, M. A., and Yan, H. (2011). Performance
evaluation and comparison of pca based human face
recognition methods for distorted images. Interna-
tional Journal of Machine Learning and Cybernetics,
2(4):245–259.
Powers, D. (2011). Evaluation: From precision, recall and
f-measure to roc., informedness, markedness & cor-
relation. Journal of Machine Learning Technologies,
2(1):37–63.
Proedrou, K., Nouretdinov, I., Vovk, V., and Gammerman,
A. (2002). Transductive confidence machines for pat-
tern recognition. In ECML’02, pages 381–390.
Senay, G., Linares, G., and Lecouteux, B. (2011). A
segment-level confidence measure for spoken docu-
ment retrieval. In Acoustics, Speech and Signal Pro-
cessing (ICASSP), 2011 IEEE International Confer-
ence on, pages 5548–5551. IEEE.
Servin, B., de Givry, S., and Faraut, T. (2010). Statistical
confidence measures for genome maps: application to
the validation of genome assemblies. Bioinformatics,
26(24):3035–3042.
Shen, L. (2005). Recognizing Faces - An Approach Based
on Gabor Wavelets. PhD thesis, University of Not-
tingham.
Shen, L. and Bai, L. (2006). A review on gabor wavelets
for face recognition. Pattern Analysis & Applications.
Sukkar, R. A. (1994). Rejection for connected digit recogni-
tion based on gpd segmental discrimination. In Acous-
tics, Speech, and Signal Processing, 1994. ICASSP-
94., 1994 IEEE International Conference on, vol-
ume 1, pages I–393. IEEE.
Turk, M. A. and Pentland, A. P. (1991). Face recognition
using eigenfaces. In IEEE Computer Society Confer-
ence on In Computer Vision and Pattern Recognition.
Computer Vision and Pattern Recognition.
Wessel, F., Schluter, R., Macherey, K., and Ney, H. (2001).
Confidence measures for large vocabulary continuous
speech recognition. Speech and Audio Processing,
IEEE Transactions on, 9(3):288–298.
AComposedConfidenceMeasureforAutomaticFaceRecognitioninUncontrolledEnvironment
237
