
Simulation based Performance Analysis of an End-of-Aisle
Automated Storage and Retrieval System
Behnam Bahrami, El-Houssaine Aghezzaf and Veronique Limère
Department of Industrial Management, Ghent University, Technologiepark 903, Gent-Zwijnaarde, Belgium
Keywords: Automated Storage and Retrieval Systems, End-of-Aisle, Simulation.
Abstract: This paper presents and discusses simulation of an End-of-Aisle automated storage and retrieval system,
using FLEXSIM 6. The objective of the simulation model is to analyze and compare results of different
control policies and physical designs. The performance measures considered for the evaluation of each
control policy and layout combination are the total travel time of the crane and the number of storage and
retrieval operations performed. The experiments set up and the corresponding results are discussed.
1 INTRODUCTION
Automated storage and retrieval systems (AS/RS)
are widely used in manufacturing facilities,
distribution centers and warehouses. An AS/RS
system is defined as a storage system that uses
fixed- path storage and retrieval machines (cranes),
running on one or more rails between fixed arrays
of storage racks.(Automated Storage Retrieval
Systems Production Section of the Material
Handling Industry of America, 2005). In such
systems, stock keeping units (SKUs) arrive at an
Input station from which they are moved by a
crane to their storage location. In case of retrieval,
the crane transports the SKUs from their storage
location to an Output station. AS/RS have both
some advantages and disadvantages. The effective
use of an AS/RS may lead to substantial savings for
a company by reducing direct and indirect labor,
energy, maintenance, and building costs (Sarker
et.al., 1995). Apparent disadvantages are high
investments costs (approximately $634,000 for a
single aisle AS/RS), less flexibility and higher
investments in control systems (about $103,000),
(Zollinger, 1999).
In designing an AS/RS, both physical design
and control policies must be carefully considered to
fully take advantages of its positive impact. On
the one hand, the physical design consists of two
aspects. First, the AS/RS type has to be chosen;
this is what is called the system choice. Secondly,
the chosen system must be configured, for example,
by deciding on the number of aisles and rack
dimensions; this is called the system configuration.
On the other hand, the control policies are methods
which determine the actions performed by the
AS/RS (e.g., storage assignment, dwell point
policy), (Roodbergen, 2009). An AS/RS is usually
hired for transporting unit loads (e.g., fully loaded
pallets) within the system; but, in many cases, only
part of the unit-load may be needed to fulfill a
customer’s order. A common option to resolve this
situation is when the AS/RS drops off the retrieved
unit loads at a workstation at the end of the aisle. An
operator at this workstation takes the required
amount of products from the unit- load, and the
AS/RS moves the remainder of the load back into
the storage rack (Figure 1). This system is often
referred to as an End-of-Aisle (EOA) system. If the
unit-loads are bins, then the system is generally
called a miniload AS/RS (Roodbergen, 2009). In this
study various design scenarios for End-of-Aisle
automated storage/retrieval systems are evaluated
via simulation.
2
LITERATURE
REVIEW
Hausman et al., (1976) initiated evaluation of
performance in AS/RS systems using analytical and
empirical methods. Specifically, they addressed the
problem of optimal storage assignment with
considering two main policies: randomized storage
and class-based storage.
334
Bahrami B., Aghezzaf E. and Limère V..
Simulation based Performance Analysis of an End-of-Aisle Automated Storage and Retrieval System.
DOI: 10.5220/0004927603340341
In Proceedings of the 3rd International Conference on Operations Research and Enterprise Systems (ICORES-2014), pages 334-341
ISBN: 978-989-758-017-8
Copyright
c
2014 SCITEPRESS (Science and Technology Publications, Lda.)
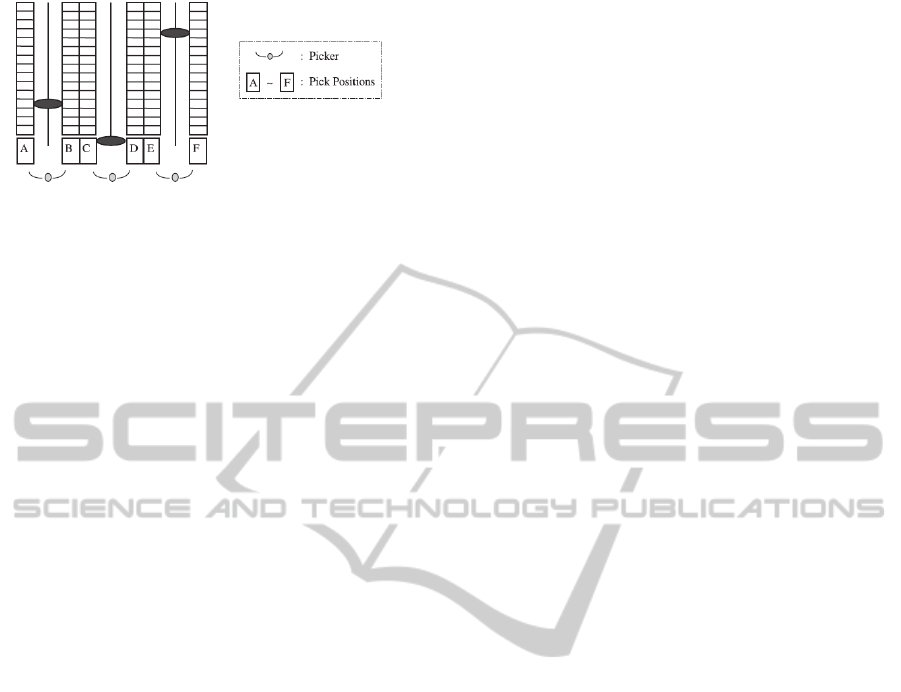
Figure 1: End-of-Aisle AS/RS order picking system
(Hwang et al., 2002).
They showed that significant reductions in S/R
machine travel time are achieved from turnover-
based storage rules such as a class-based storage
policy. Accordingly, Bozer and White (1984)
developed a continues rack configuration to
evaluate single and dual travel times for rectangular
racks and variety of I/O configurations.
Furthermore, Han et al., (1987) illustrated that by
sequencing the retrieval orders, the throughput
performance of the AS/RS can be improved. This
can thus reduce the interleaving travel time between
storage and retrieval locations in a dual command
cycle.
For simulation models in AS/RS, most of the
researchers only evaluated some of the physical
design aspects in combination with a limited
number of control policies. Meller and
Mungwattana (2005) applied simulation to evaluate
the benefits of different dwell point policies. The
results indicate that the position of dwell point
has an negligible effect on system respond time
when the AS/RS has high utilization. Randhawa and
Shroff (1995) examined the effect of different
sequencing rules on six layout configurations (with
varying I/O-point, item distribution over racks, rack
configuration and rack dimensions). Based on a
limited number of experiments they mentioned in
their study that the position of I/O point at the
middle of the rack results in a higher throughput.
Vanderberg et al., (2000) have developed a
simulation study and examined various aspects of
AS/RS control policies: storage location assignment
policies, request selection rules, open location
selection rules and urgency rules. Considering
randomized storage and class-based storage, they
concluded that using a FCFS sequence for the
retrievals by implementing urgency rules result in
better expected time. Randhawa et al., (1991) used
simulation to evaluate single and dual I/O point
configurations in a unit load AS/RS and their
model demonstrated that the dual dock layout
maximizes the throughput.
In an End-of-Aisle AS/RS, current retrieval
operation become next storage operation, since
loads are returned into the system after items have
been picked. A mathematical model to investigate
the performance of an EOA order picking systems
have been proposed by Bozer and White (1996).
They provided some approximate expressions for
the expected travel time for systems performing
under peak demand, and presented a design
algorithm in order to calculate the minimum
number of miniload aisles needed to meet a given
throughput requirement. Foley and Frazelle (1991)
have developed an exact solution for the S/R
machine travel time under the FCFS retrieval
policy in order to evaluate the throughput for the
miniload AS/RS. Hwang et al., (2002) proposed the
design of miniload AS/RSs in combination with
Automated Guided Vehicles. To recognize the
optimal number of loads transferred by each AGV
to machines, a non-linear model and heuristics have
been developed in their research.
To the best of our knowledge, there is no
simulation model for the End-of-Aisle system,
therefore in this study a multitude of physical design
aspects and control policies are simultaneously
included for the End-of-Aisle system.
3
SIMULATION MODELING
OF
THE SYSTEM
3.1 Assumptions
In the system analyzed, a crane serves a single aisle
with storage racks placed on one side of the aisle.
All storage locations are identical in size and each
location can hold one unit load. The total capacity
of the system is 100 unit loads. Each unit load
(e.g., pallet) contains a number of boxes of one
item type. Although the pallet sizes are constant,
the size of the boxes on the pallets are different for
different item types. The crane’s pick-up and
deposit time is calculated according to the size and
number of boxes inside the pallet; for pallets with a
higher number of boxes and larger boxes, the time
for pick- up and deposit is higher. Moreover, the
times for manual loading and unloading boxes from
pallets are calculated according to the boxes’
dimension.
The turnover of each itemtype is known in
advance and is the same for all scenarios tested.
The crane scheduling rule in this study is FCFS
(first come, first serve) for both storage and
retrieval operations. The capacity of the crane is
SimulationbasedPerformanceAnalysisofanEnd-of-AisleAutomatedStorageandRetrievalSystem
335
one pallet and the crane can move horizontally and
vertically simultaneously. Crane acceleration and
deceleration are assumed instantaneous. The actual
travel time equals the maximum of the horizontal
and vertical travel time (Chebyshev distance metric).
A unit-load AS/RS can perform in two ways,
namely in a single command cycle or in a dual
command cycle. In a single command cycle the
crane operates either a single storage or a single
retrieval operation. The storage cycle time then is
equal to the sum of the time to pick-up a load at the
input station, the time to travel to the storage
location, the time to place the load in the rack
and the time to return to the input station. The
retrieval cycle time can be defined similarly. A dual
command cycle can be defined as performing both
a storage and a retrieval request simultaneously in a
single cycle. In this case, the cycle time is defined
as the sum of the time to pick up the load, the
time to travel to the storage location and store the
load, the empty travel time (interleaving time) from
the storage location to the retrieval location and the
time to pick the unit-load and transport it to the
output station. In this study the crane can perform
both single and dual command. This means when
both storage and retrieval orders are in the queue,
the crane performs in dual command but when only
a storage order or a retrieval order is available, the
crane moves in single command.
If the pallets’ arrival rate is very high, the
system will be completely operating on dual
command, while by reducing the arrival rate,
single- and dual- command cycles will be combined
in the system. To provide a better basis for
analyzing the system, in this study five scenarios
for arrival of pallets to the system are assumed.
Arrival rates are 25, 40, 60, 80 and 100 per hour
respectively.
To study the End-of-Aisle system described, we
simulated storage and retrieval for a number of
different scenarios. In the following sections, we
give an overview of the factors included.
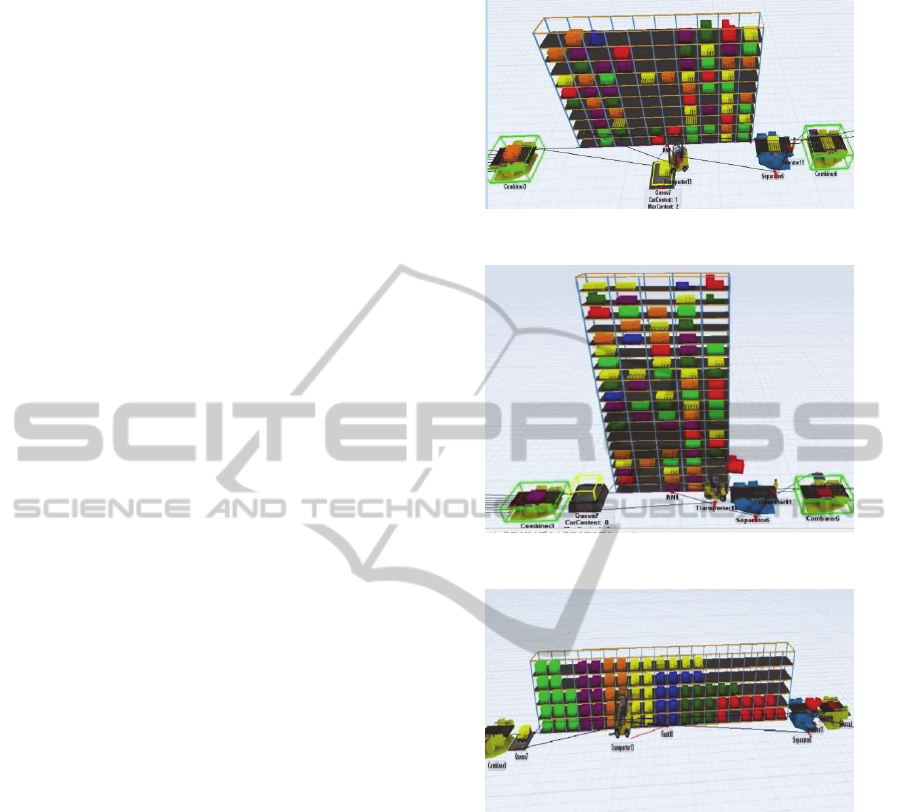
3.2 Configurations of Rack
Since cranes can move vertically and horizontally
simultaneously, a good balance between rack height
and length can help to reduce travel times. In this
study three configurations are assumed. The first
configuration consists of 10 bays, and 10 levels; the
second has 5 bays and 20 levels; and the third one
has 20 bays and 5 levels (Figures 2, 3, 4).
Figure 2: Rack with 10 bays and 10 levels.
Figure 3: Rack with 5 bays and 20 levels.
Figure 4: Rack with 20 bays and 5 levels.
3.3 Input/Output Station
An input station is the location where incoming
products are received from other parts of the
warehouse by for example, automated guided
vehicles, conveyors, or forklift trucks, before they
are stored. An output station is where retrieved
products are unloaded before being moved to
shipping. In this End-of-Aisle model, it is
assumed the output station is at the end of the aisle.
For the input station however, two different
positions are assumed, one in the first bay of the
rack and a second one in the middle of the rack
(Figure 5).
ICORES2014-InternationalConferenceonOperationsResearchandEnterpriseSystems
336
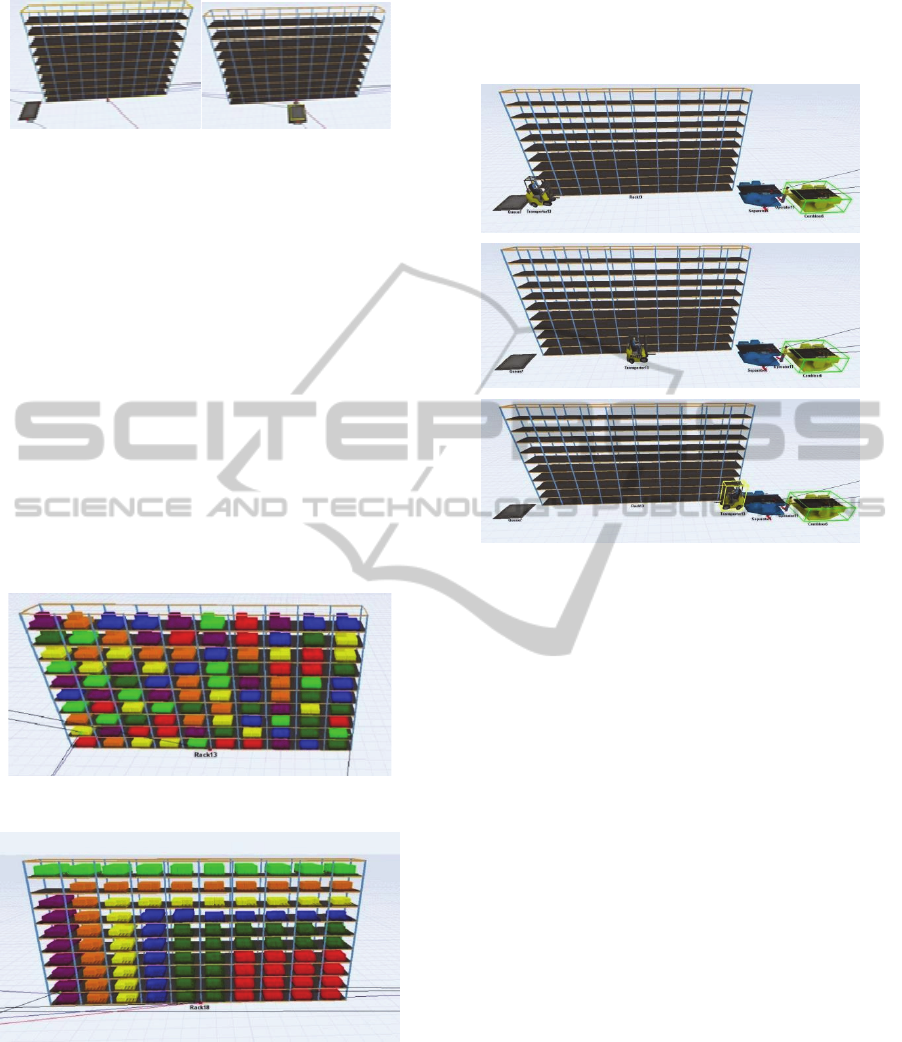
Figure 5: Location of input station: in the first bay (a), in
the middle of the rack (b).
3.4 Storage Assignment Policies
In this model two storage policies are
considered, i.e. random storage and class-based
storage. For random storage, every incoming pallet
is assigned to a location in the racks that is selected
randomly from all eligible empty locations with
equal probability (Figure 6). For class-based storage
the racks and pallets are divided into K classes
based on their turnover frequency. Pallets with
higher demand frequency are assigned to class I
while pallets with smaller demand frequency are
assigned to class II and so on. The position of
class I is the best location close to the Output
station. For class II the position is the second best
location near the Output station (Figure 7).
Figure 6:
Random-based
storage.
Figure 7: Class-based storage.
3.5 Dwell Point Policy
When the crane is idle, its location is called as the
dwell point. Choosing a proper dwell point can
minimize the expected travel time for the next
operation. In this model three dwell points are
considered: at the Input station, in the middle of
the aisle and at the Output station respectively
(Figure 8).
Figure 8: Position of crane: in the Input station (a), in the
middle of the rack (b), in the Output station (c).
4
SIMULATION
RESULTS
The simulation results are given in the following
tables. For each storage policy – i.e. random
storage and class-based storage different physical
designs are analyzed for five arrival rates of pallets.
Specifically, for each case the performance of the
system is evaluated according to dwell point, input
station and rack configuration. Each simulation is
run for 3600 seconds. The measures of performance
are: total travel time of the crane and total number
of storages and retrievals performed by the system.
To evaluate the performance of the model, the
simulation was initiated with storage rack utilization
at zero (rack is completely free). Considering the
nature of random storage, the simulation results are
based on 40 replications for each scenario, and the
average results are reported. Results of the
experiments can be read from Table 1 and 2.
In the following subsections we will discuss the
results.
4.1 Total Travel Time of the Crane
The following plot indicates that the total travel
time increases significantly when the number of
SimulationbasedPerformanceAnalysisofanEnd-of-AisleAutomatedStorageandRetrievalSystem
337
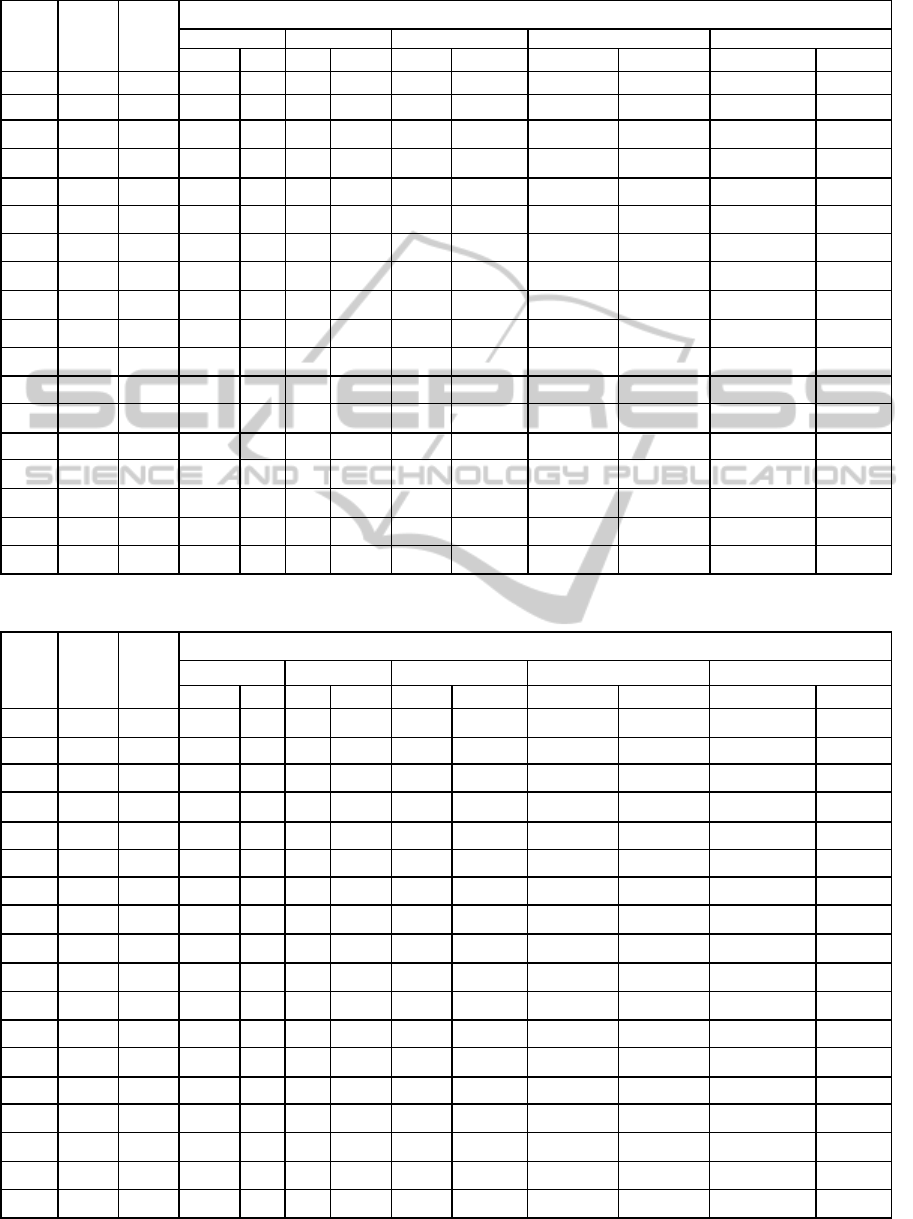
Table 1: Total crane’s travel and total number of storage and retrievals for Random Based Storage.
Dwell
Point
Input
station
R
ac
k
B*L
Arrival rate (pallets/h)
25 40 60 80 100
TT S
/
R TT S
/
R TT S
/
R TT S
/
R TT S
/
R
Input f
i
rs
t
20*5 1758 35 3017 57 4326.4 77 4571.5 78 4603.9 82
Input m
i
dd
le
20*5 1155 36 2013 58 3043.2 84 3563.8 103 3733.5 110
Ou
t
put f
i
rs
t
20*5 1798 35 3075 57 4366.2 77 4619.2 78 4679.6 82
Ou
t
put m
i
dd
le
20*5 1154 36 2025 58 3042.3 84 3554.7 103 3732.6 110
M
i
dd
le
f
i
rs
t
20*5 1778 35 3037 57 4346.2 77 4591 78 4627.8 82
M
i
dd
le
m
i
dd
le
20*5 1136 36 1994 58 3023.9 84 3534.3 103 3710.3 110
Input f
i
rs
t
10*10 866 36 1496 58 2248.5 84 2963.4 108 3245.7 122
Input m
i
dd
le
10*10 526 36 970 59 1380.7 83 1779.5 109 2049.3 131
Ou
t
put f
i
rs
t
10*10 885 36 1516 58 2148.3 84 2822.6 108 3265.9 122
Ou
t
put m
i
dd
le
10*10 525 36 969 59 1379.6 83 1778.3 109 2047.5 131
M
i
dd
le
f
i
rs
t
10*10 875 36 1506 58 2258.2 84 2973.3 108 3255.9 122
M
i
dd
le
m
i
dd
le
10*10 517 36 961 59 1371.4 83 1770.1 109 2037.3 131
Input f
i
rs
t
5*20 415 36 735 60 1094.6 83 1440.5 109 1685.6 131
Input m
i
dd
le
5*20 223 36 441 60 583.96 84 739.89 109 863.22 132
Ou
t
put f
i
rs
t
5*20 425 36 745 60 1104.4 83 1450.3 109 1696.4 131
Ou
t
put m
i
dd
le
5*20 222 36 420 60 579.46 84 738.34 109 861.62 132
M
i
dd
le
f
i
rs
t
5*20 420 36 740 60 1099.5 83 1445.4 109 1689.8 131
M
i
dd
le
m
i
dd
le
5*20 219 36 417 60 579.46 84 735.39 109 858.58 132
Table 2: Total cranes travel time and total number of storages and retrievals for Class-Based storage.
Dwell
Point
Input
station
R
ac
k
B*L
Arrival rate (pallets/h)
25 40 60 80 100
TT S
/
R TT S
/
R TT S
/
R TT S
/
R TT S
/
R
Inpu
t
f
i
rs
t
20*5 1568 35 2583 56 4044.3 81 4561.7 100 4888.1 118
Input m
i
dd
le
20*5 1091 36 1923 58 2830.4 83 3259.6 104 3608.5 124
Ou
t
put f
i
rs
t
20*5 1564 35 2622 56 4084 81 4586.4 100 4947.9 118
Ou
t
put m
i
dd
le
20*5 1087 36 1906 58 2820.3 83 3287.1 104 3604.6 124
M
i
dd
le
f
i
rs
t
20*5 1587 35 2570 56 4064 81 4553.6 100 4907.9 118
M
i
dd
le
m
i
dd
le
20*5 1078 36 1903 58 2810.4 83 3270.8 104 3585.5 124
Input f
i
rs
t
10*10 758 36 1311 59 1992.8 84 2616.2 107 2944.2 128
Input m
i
dd
le
10*10 574 36 991 59 1402 84 1834.5 109 2083.7 130
Ou
t
put f
i
rs
t
10*10 735 36 1331 59 2012.5 84 2636 107 2968.3 128
Ou
t
put m
i
dd
le
10*10 570 36 987 59 1398.3 84 1830.3 109 2079.6 130
M
i
dd
le
f
i
rs
t
10*10 757 36 1252 59 2002.5 84 2626 107 2958.1 128
M
i
dd
le
m
i
dd
le
10*10 564 36 981 59 1392.5 84 1824.4 109 2073.1 130
Input f
i
rs
t
5*20 351 36 623 59 943.71 84 1348.8 109 1509.1 132
Input m
i
dd
le
5*20 255 36 442 60 589.27 84 756.28 109 849.68 133
Ou
t
put f
i
rs
t
5*20 328 36 633 59 953.48 84 1358.6 109 1518.8 132
Ou
t
put m
i
dd
le
5*20 251 36 438 60 585.22 84 759.94 109 845.64 133
M
i
dd
le
f
i
rs
t
5*20 356 36 628 59 948.50 84 1353.6 109 1513.9 132
M
i
dd
le
m
i
dd
le
5*20 250 36 437 60 584.16 84 758.88 109 844.58 133
ICORES2014-InternationalConferenceonOperationsResearchandEnterpriseSystems
338
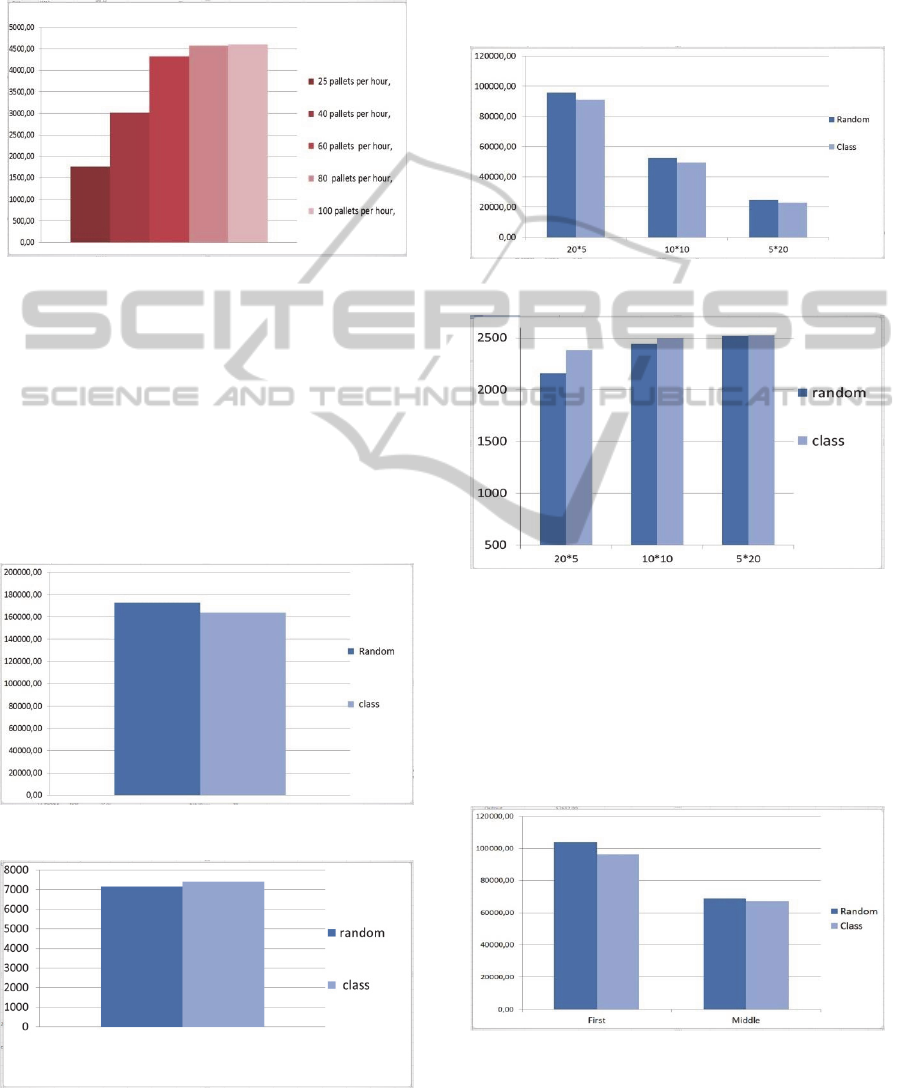
arriving pallets to the system change from 25 to 60,
but for higher rates of incoming pallets from 60 to
100, the total crane’s travel time rises slowly and
become more stable.
Figure 9: Total crane’s travel times for different arrival
rates.
4.2 Random based Storage Vs.
Class-based Storage
Based upon the crane’s travel time and the number
of storages and retrievals carried out by the system,
the analysis demonstrates that
class-
based storage
offers a better performance than random based
storage. The comparison between both types is
given in Figure 11 and Figure 12.
Figure 10: Total travel times for random and class-based.
Figure 11: Number of storages and retrievals for
random and class-based.
4.3 Rack Configuration
The result obtained for different configurations
indicate that with increasing in the number of bays,
the total travel time increases and the total number
of storages and retrievals increase. figures (13, 14).
Figure 12: Total crane’s travel time.
Figure 13: Total number of storages and retrievals.
4.4 Input Station Location
According to the results it can be observed that
the best location for dock, is at the middle of
the rack. The given diagrams illustrate the total
travel distance and total number of retrievals and
storages
Figure 14: Total crane’s travel time.
SimulationbasedPerformanceAnalysisofanEnd-of-AisleAutomatedStorageandRetrievalSystem
339
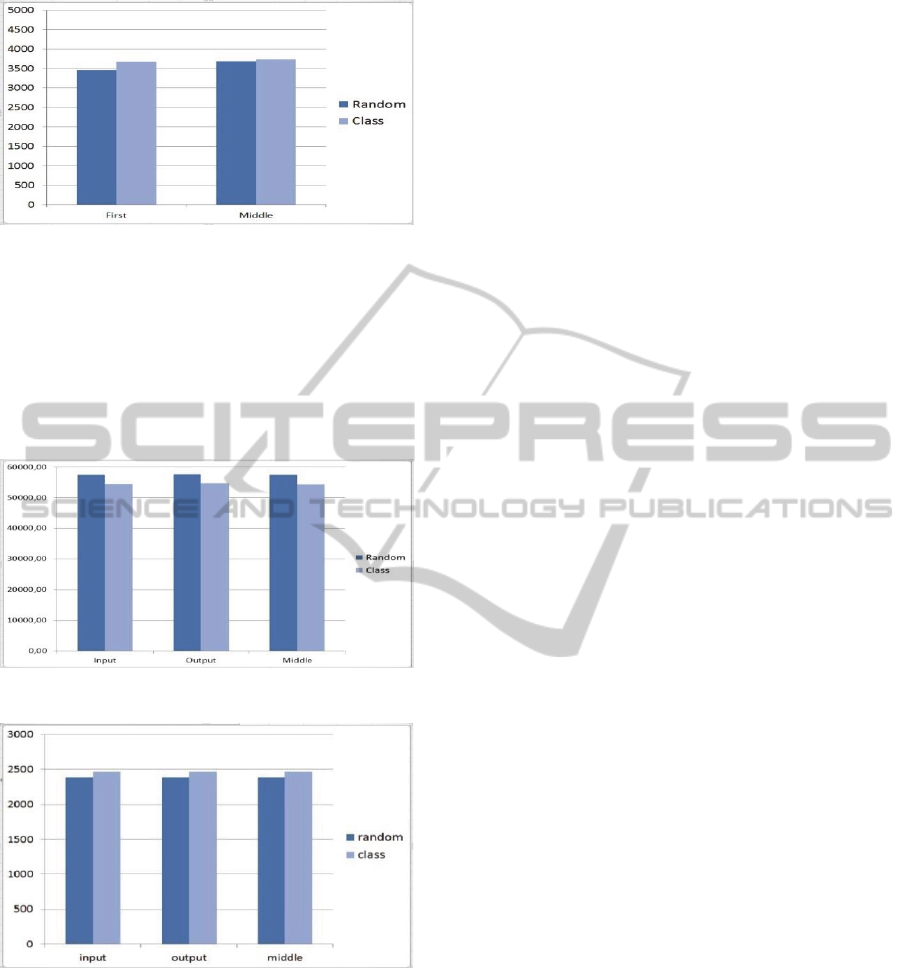
Figure 15: Total number of storages and retrievals.
4.5 Dwell Point Location
The results achieved by the simulation model,
reveal that the position of dwell point has negligible
impact on both travel time and number of storage
and retrievals. The following figures represent the
comparison for three dwell point locations.
Figure 16: Total crane’s travel time.
Figure 17: Total number of storages and retrievals.
5 CONCLUSIONS
This paper presents a simulation based performance
analysis of an End-of-Aisle automated storage and
retrieval system. Results of different control policies
and physical designs were compared. In particular,
the efficiency of the system for two types of
storage, namely class-based and random based,
with combinations of different dwell points, Input
locations and various rack configurations, were
analyzed. This preliminary analysis shows that
combination of class-based storage with an input
station in the middle of the rack, seems to provide
a superior performance. The analysis with other
strategies is ongoing.
REFERENCES
Automated Storage Retrieval Systems Production Section
of the Material Handling Industry of America (2005).
Sarker, B. R., Sobhan B., 1995. “Travel time models in
automated storage/retrieval systems: A critical
review”. Int. Journal of Production Economics 40173,
184–193.
Bozer, Y. A., and White, J. A., 1984, “Travel time models
for automated storage/retrieval systems”. IIE
Transactions, 16 (4), 329- 338.
Bozer, Y. A., White, J. A., 1996. “A generalized design
and performance analysis model for end-of-aisle
order- picking systems”. IIE Transactions 28 (4), 271–
280.
Foley, R. D., Frazelle, E. H., 1991. “Analytical results for
miniload throughput and the distribution of dual
command travel time”. IIE Transactions 23 (3), 273–
281.
Graves, S. C., Hausman, W. H., Schwarz, L. B., 1977.
“Storage-retrieval interleaving in automatic
warehousing systems”. Management Science 23 (9),
935–945.
Han, M. H., McGinnis, L. F., Shieh, J. S., White, J. A.,
1987. “On sequencing retrievals in an automated
storage/retrieval system”. IIE Transactions 19 (1), 56–
66.
Hausman, W. H., Schwarz, L. B., Graves, S. C., 1976.
“Optimal storage assignment in automatic
warehousing systems”. Management Science 22 (6),
629–638.
Hwang, H., Moon, S., Gen, M., 2002. “An integrated
model for the design of end-of-aisle order picking
system and the determination of unit load sizes of
AGVs”. Computers & Industrial Engineering 42,
249–258.
Kees Jan Roodbergen , Iris F. A. Vis., 2009. “A survey of
literature on automated storage and retrieval systems”.
European Journal of Operational Research 194, 343–
362.
Meller, R. D, Mungwattana. A., 2005. “AS/RS dwell point
strategy selection at high system utilization: A
simulation study to investigate the magnitude of the
benefit”. International Journal of Production
Research 43(24), 5217-5227.
Randhawa, S. U., McDowell, E. D., Wang, T. W., 1991.
“Evaluation of scheduling rules for single- and dual-
dock automated storage/retrieval system”. Computers
& Industrial Engineering, Volume 20, Issue 4, 401–
410.
ICORES2014-InternationalConferenceonOperationsResearchandEnterpriseSystems
340

Randhawa, S. U., Shroff, R., 1995. “Simulation-based
design evaluation of unit load automated
storage/retrieval systems”. Computers & Industrial
Engineering 28 (1), 71–79.
Van den Berg, J. P., Gademann, A. J. R. M., 2000.
“Simulation study of an automated storage/retrieval
system”. International Journal of Production
Research 38 (6), 1339–1356.
SimulationbasedPerformanceAnalysisofanEnd-of-AisleAutomatedStorageandRetrievalSystem
341
