
Biometrics Authentication using Another Feature
of Heartbeat Waveform
Ryoko Nomura, Tomohiro Umeda, Naoko Yoshii, Masami Takata and Kazuki Joe
Dept. of Information and Computer Sciences, Nara Women’s University, Nara, Japan
Keywords: Biometrics, Heartbeat Waveform.
Abstract: In this paper, we propose a personal authentication method using heartbeat waveforms to enhance the secu-
rity in wireless communication. The heartbeat waveform of a human being has discriminative characteristic
features, and the mimicking is very difficult. Therefore, their application to personal authentication has been
studied. Existing methods for heartbeat based personal authentication are focused only on the amplitude of
the heartbeat. In order to increase the amount of heartbeat features, we propose an authentication method us-
ing the area of heartbeat in addition to the amplitude. To validate that our personal authentication method is
applicable, we perform some experiments to show that our method provides better authentication than
existing ones.
1 INTRODUCTION
Over the past decade, the integration degree of LSIs
is quickly and drastically improved toprovide us
with smaller and more intelligent sensor devices
working with lower power and higher frequency.
Such sensor devices are applicable for life compu-
ting that is contrasted with existing scientific compu-
ting. Indeed, they can be used for supporting various
activity of human being. ICT based healthcare is a
hot research area of the life computing. We are de-
veloping a smart healthcare navigation system that
consists of sensor devices for user’s vital data, a
smartphone and a knowledge base server. A part of
the smart healthcare system is reported in (M.
Uchimura, et al., 2012). The sensor devices of the
smart healthcare navigation system sends user’s vital
data such as heartbeat to the smartphone in wireless
communication.
Bluetooth is used for communication between
the smartphone and the sensor devices. Although
Bluetooth provides encryption and authentication as
security measures, they often become the attack
target. To include personal information, the commu-
nication data must not be subjected to interception or
tampering. Enhanced security mechanisms for Blue-
tooth are required. Bluetooth employs a PIN (Per-
sonal Identification Number) (C.S.R. Prabhuand, A.
Prathap Reddi, 2004) system as personal authentica-
tion by entering a verification code over four digits
during pairing. However, spoofing is possible in this
authentication method, so the security level is not
strong.
On the other hand, biometrics (Anil K. et al.,
1999; P. Sasikala and R.S.D. Wahidabanu, 2010)
has been actively studied as stronger personal au-
thentication against spoofing. Biometrics is an indi-
vidual authentication method that extracts specific
features from particular patterns of user’s behaviour
or body forms of the user to identify whether it is the
same person or not. Biometric authentication meth-
ods using a part of user’s body have much less pos-
sibility of losing and difficult lending to others. Thus,
false acceptance and rejection are less likely to occur.
As a biometric authentication method, studies
(P. Sasikala and R.S.D. Wahidabanu, 2010; Y.
Wang et al., 2008; S.A. Israel et al., 2005) for per-
sonal authentication using electrocardiographic
waveforms are reported. In the studies, authentica-
tion using the features of the height and the distance
of the three peak waveforms (P wave, QRS wave
and R wave) observed ECG (Electrocardiogram) is
proposed. Although the authentication method uses
different parameters, more effective parameters are
required in order to improve the authentication rate.
In this paper, we propose a new biometrics authenti-
cation method using heartbeat waveform where the
area information of the three peak waveforms is
adopted in addition to the amplitude.
311
Nomura R., Umeda T., Yoshii N., Takata M. and Joe K..
Biometrics Authentication using Another Feature of Heartbeat Waveform.
DOI: 10.5220/0004935503110317
In Proceedings of the International Conference on Bio-inspired Systems and Signal Processing (MPBS-2014), pages 311-317
ISBN: 978-989-758-011-6
Copyright
c
2014 SCITEPRESS (Science and Technology Publications, Lda.)
The rest of the paper organized as follows. In
section 2, existing research for personal authentica-
tion using electrocardiogram is described. In section
3, we explain the proposed method of personal au-
thentication using heartbeat waveforms. In section4,
the experiments are reported to validate the proposed
method.
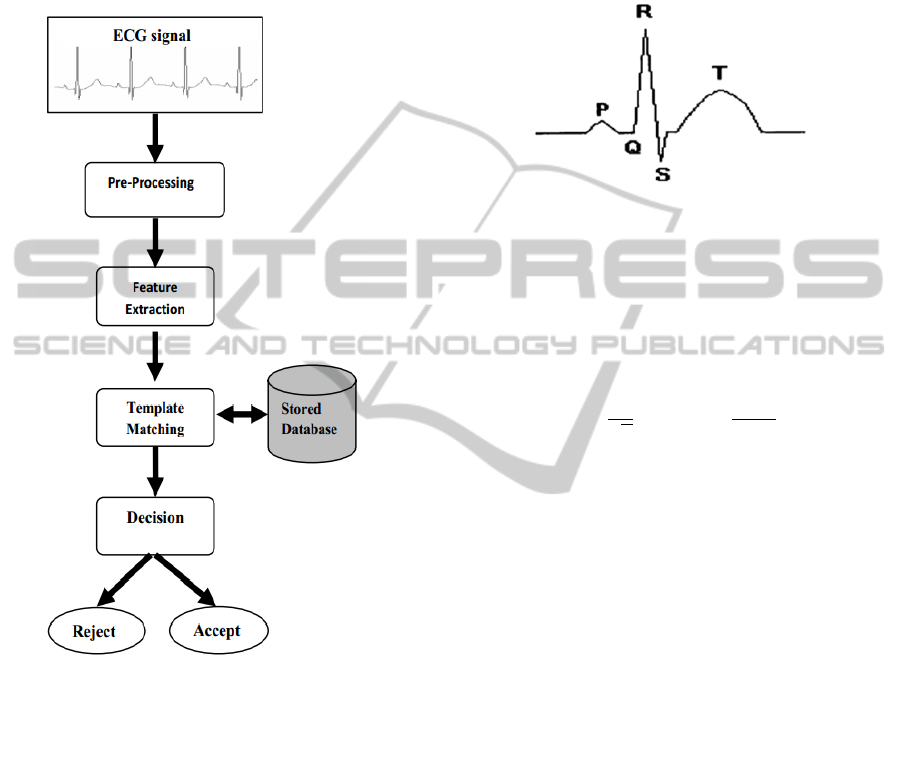
Figure 1: Procedure of existing authentication methods.
2 PERSONAL
AUTHENTICATION USING
ELECTROCARDIOGRAM
Electrocardiogram is time variant biological infor-
mation. Personal authentication using electrocardio-
gram is reported in (P. Sasikalaand, R.S.D. Wahida-
banu, 2010). Figure 1 shows the procedure: pre-
processing, feature extraction (S. Banerjee, R. Gupta,
M. Mitra, 2012; S. Pal, M. Mitra, 2010), comparison
with the template stored in the database, and deci-
sion.
2.1 Pre-processing
First, noise removal is applied to the measured elec-
trocardiograms as pre-processing. the wavelet trans-
formation (S.Pal and M. Mitra, 2010; Foo-Tim Chau
et al., 2004) and the median filter are used.
Figure 2: Each point of P, Q, R, S, T.
The median filter is to sort the values within a win-
dow on array data and select the middle value
among the sorted ones as the new center value for
the window. Thus, it is possible to reduce baseline
drift along the measured data stream. The definition
of the discrete wavelet transform is given below.
Wφf
b,a
1
√
(1)
It can be used for knowing "characteristic of tem-
poral change" and "mixed rate of the component
frequencies", and it is possible to extract information
about time and frequency simultaneously. In the
noise removal using the wavelet transformation,
wavelet expansion coefficients are obtained first.
The expansion coefficients with smaller absolute
values are modified to 0, and the reconstruction is
performed based on the expansion coefficients. Thus,
the data stream becomes smooth.
2.2 Feature Extraction
The wavelet transformation is used for the detection
of a P wave peak, each feature point in QRS com-
plex waves, and a T wave peak. The P wave is a
waveform showing the excitement of atria, and let P
be the P wave peak. The QRS complex waves reflect
the electrical excitation of ventricles. Let Q, R, and
S be the peak of the first negative wave, the peak of
the first positive wave, and the peak of the negative
wave following the positive wave of the QRS com-
plex waves, respectively. The T wave is a waveform
showing the repolarization of ventricular muscle. Let
T be the T wave peak. Figure 2 shows each point of
P, Q, R, S, and T. QRS complex waves correspond
to the maximum values of the wavelet expansion
BIOSIGNALS2014-InternationalConferenceonBio-inspiredSystemsandSignalProcessing
312
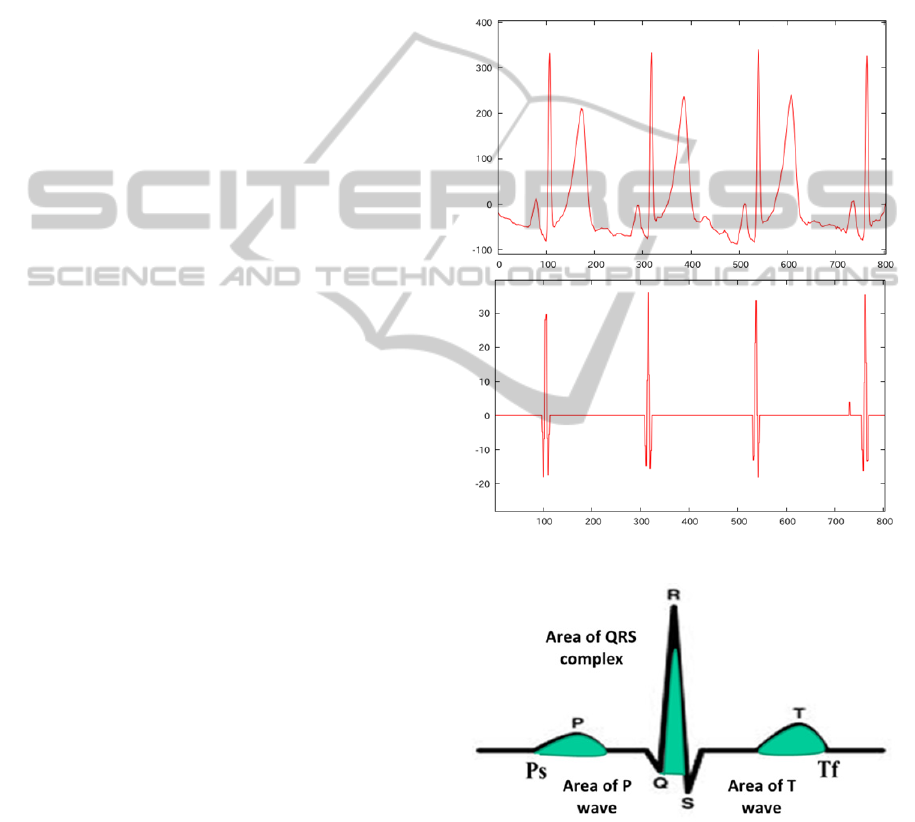
coefficients. Figure 3 shows the original data stream
and the corresponding maximum values of the wave-
let expansion coefficients. A P wave is observed
from 200 milliseconds before a QRS complex wave
to the QRS complex wave. Therefore, P is the max-
imum value in the range of 200 milliseconds. T
corresponds to modulus maxima larger than a
threshold ε. The threshold is calculated by the Root
Mean Square (RMS) of the data stream between two
Rs.
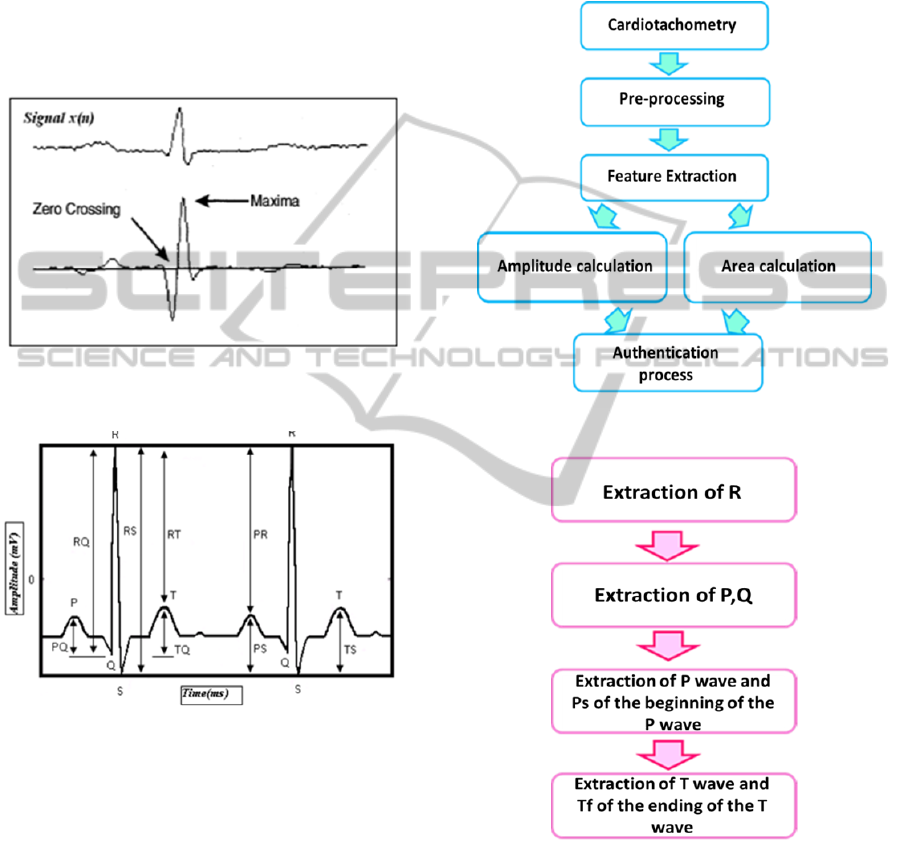
Figure 3: Original data stream and wavelet expansion
coefficients.
Figure 4: Amplitudes of PR, RQ, RS, RT, PS, TS, PQ and
TQ.
Amplitudes of PR, RQ, RS, RT, PS, TS, PQ, and TQ
are calculated from QRS complex waves, a P wave,
and a T wave. Figure 4 shows these amplitudes.
2.3 Authentication Process
Authentication process is to compare measured data
stream with the amplitudes (PR,RQ,RS,RT,
PS,TS,PQ,TQ) in templates that are recorded
in the database in advance. When a measured data
stream set and the average value of a template are
close enough, it can be estimated that they are from
the same person.
The
human heart rate is not always
constant. To complement this fluctuation, we define
a criterion to allow the error as the range of ±10%.
Authentication is performed by the number of data
stream sets that are within the criterion (±10%)
among eight amplitudes. The larger the number is,
the more likely the same person they are.
Figure 5: Procedure of the proposed method.
Figure 6: Procedure of feature extraction.
3 PROPOSED METHOD
Since existing heartbeat based authentication meth-
ods just employ amplitudes as features, it may occur
that different persons are regarded as the same per-
son if their ECG waveforms are similar each other.
We propose a new method for heartbeat based au-
BiometricsAuthenticationusingAnotherFeatureofHeartbeatWaveform
313
thentication with more features to reduce such mis-
judgement. We include the area size of each wave as
the extra feature. In this section, we describe the
proposed method for personal authentication using
heartbeat waveform. Figure 5 shows the procedure
of the proposed method
3.1 Outline of the proposed Method
Given measured ECGs, the method performs pre-
processing on the data stream to remove noise and
normalize them using the cepstrum (D. G. Childers
et al., 1977), and applies the wavelet transformation
to extract features. In the feature extraction, it ex-
tracts P, Q, R, S, T, P
s
and T
f
, where P
s
and T
f
repre-
sent the beginning point of P waves and the ending
point of T waves, respectively. After the calculation
of the area sizes of P waves, QRS complex waves,
and T-wavesas well as amplitudes of PR, RQ, RS,
RT, PS, TS, PQ, and TQ, it performs the authentica-
tion processing by comparing the template.
3.2 Pre-processing
Pre-processing is applied to the measured data
stream. In the pre-processing, noise reduction and
normalization using the cepstrum are performed for
the subsequent process of the wavelet transfor-
mation. The existing method uses the median filter
(Ioannis Pitas and Anastasios N. Venetsanopoulos,
1990), but the proposed method uses the cepstrum.
The median filter can eliminate singularities such as
pulse noises. However, it is not possible to remove
larger envelopes. On the other hand, the cepstrum is
a method that calculates the envelope of the meas-
ured data stream. Because it is a noise during meas-
uring, the envelope shape is correctable by setting
them to 0. Thereafter, it removes noises using the
wavelet transform as described in the section 2 in
order to smooth the waveform.
When measuring positions stir even a little dur-
ing the measurement of the heartbeat waveforms, the
sizes of the waveforms also change a little. There-
fore, it should be normalized by aligning with 1 the
height of the R wave peaks and applying the correc-
tion to the entire waveforms.
3.3 Feature Extraction
Figure 6 shows the procedure of feature extraction.
R wave peaks are extracted using the wavelet
transformation as well as section 2. Figure 7 shows a
heartbeat waveform and the corresponding wavelet
expansion coefficients.
Next, it detects S and Q based on the calculated
R wave peaks. Q is found where derivative is re-
versed for the first time before the R wave peak. S is
also found where derivative is reversed for the first
time after the R wave peaks.
P and Ps that is the beginning of the P wave are
found as follows. A search window starts at 200 ms
before the onset of a QRS complex wave and ends at
the onset of the QRS complex wave. Therefore, the
maximum value in the window is the P wave peak.
Figure 7: Heartbeat and wavelet expansion coefficient.
Figure 8: Area of QRS complex wave, P wave and T wave.
Ps is found where derivative is reversed for the first
time before the P wave peak.
T and T
f
that is the ending of the T wave are
found as follows. A search window starts at the QRS
complex wave peak and ends at the onset of the next
P wave. The maximum value in the window is the T
BIOSIGNALS2014-InternationalConferenceonBio-inspiredSystemsandSignalProcessing
314
wave peak. T
f
is found where derivative is reversed
for the first time after the T wave peak.
3.4 Calculation of Area Sizes
and Amplitudes
As with the method described in section 2, magni-
tudes (amplitudes) of PR, RQ, RS, RT, PS, TS, PQ,
and TQ are obtained. Furthermore, the proposed
method calculates the area sizes of QRS complex
waves, P waves, and T waves. The area sizes are
calculated using the quadrature by parts. The area
size of a QRS complex wave is calculated from the
height of Q to the height of R. The area size of a P
wave is calculated from the height of P
s
to the height
of P. The area size of a T wave is calculated from
the height of T
f
to the height of T. Figure 8 shows
areas of a QRS wave, a P wave, and a T wave.
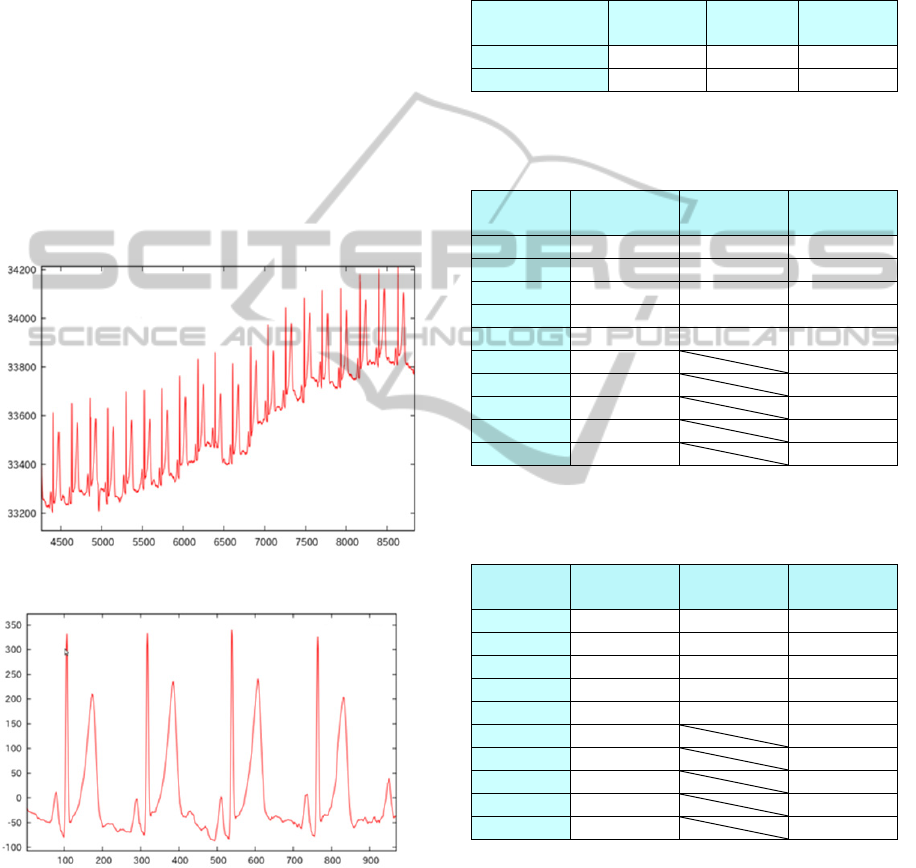
Figure 9: The original data stream measured by Enobio.
Figure 10: Waveform after noise removal.
3.5 Authentication Process
This subsection explains authentication process. The
averages of the amplitudes of PR, RQ, RS, RT, PS,
TS, PQ, and TQ and the area sizes of the QRS com-
plex waves, P waves, and T waves are recorded in
the database in advance as templates. Comparing the
measured data stream with the templates about am-
plitudes and area sizes, we count the number of
measured data stream sets that are between ±10% of
the templates, and the number is used for the authen-
tication process.
Table 1: Template own and Template other.
Amplitude Area Amplitude
and area
Template own 6 2 9
Template other 7 2 8
Table 2: Differences between the maximum number of
matches with others and with the same person about a
template.
Difference Amplitude Area Amplitude
and area
-1 0 0 0
0 2 7 0
1 11 11 2
2 6 2 3
3 0 0 7
4 0 3
5 0 2
6 1 0
7 0 0
8 0 1
Table 3: Differences between the maximum number of
matches with others and with the same person about an
individual.
Difference Amplitude Area Amplitude
and area
-1 1 0 0
01 7 0
11212 2
22 1 5
33 0 9
40 1
50 2
60 0
71 1
80 0
4 EXPERIMENTS
4.1 Environments
The ECG Measurement is performed with Enobio
(Starlab Living Science, 2013), which is a non-
invasive electrophysiology information storage sys-
tem developed by Starlab. Enobio measures the
BiometricsAuthenticationusingAnotherFeatureofHeartbeatWaveform
315
three types of signals: EEG (Electro-encephalogram),
EOG (Electro-oculogram) and ECG. In the case of
measuring ECGs, an electrode of Enobio is put on a
wrist of an examinee that is in the resting state for 5
minutes. The measured data are clipped out by 1,024
samples (about 4 seconds) of stable heartbeat wave-
forms. The averages of the area and amplitude for
the three waveforms are obtained. As templates for
comparison, the averages of areas (QRS waves, P
waves, and T waves) and amplitudes (PR, RQ, RS,
RT, PS, TS, PQ, and TQ) are recorded in advance.
The examinees are twenty women who are between
21 and 24 years old.
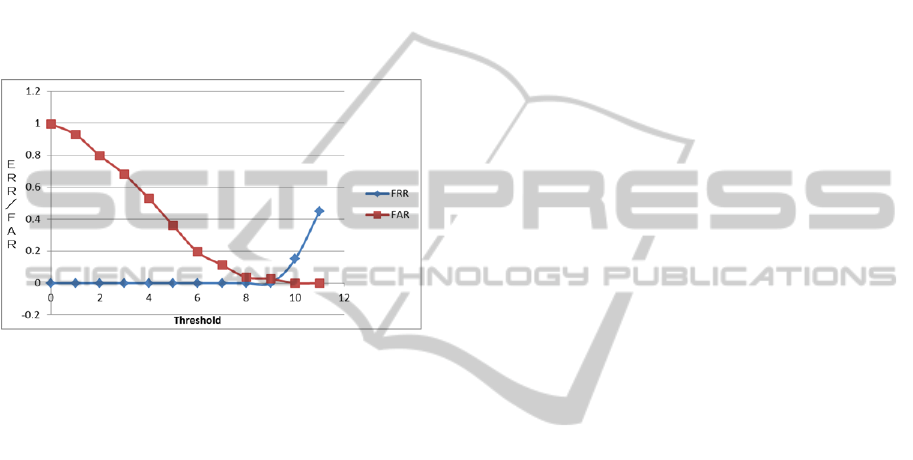
Figure 11: Threshold and ERR/FAR.
4.2 Experimental Results
Figure 9 shows the original data stream measured
with Enobio. Small noises and large envelopes are
observed in the original data stream. Figure 10
shows the data stream clipped with 1,024 samples
from the original data stream with the pre-processing
of noise removal using the wavelet transformation
and cepstrum. Noises and envelopes are well re-
moved, and it becomes a smooth waveform.
Table 1 shows the minimum numbers of matches
(between ±10%) of areas, amplitudes, areas-
amplitudes for the same person, and the maximum
values among the numbers of matches with others.
“Template own” in the table is the minimum number
of matches with the person of the templates while
“Template other” is the maximum number of match-
es with others in the templates. In the case of ampli-
tude with the same person, six or more data sets are
within ±10%. With others, seven or less data sets are
within ±10%. In the case of area with the same per-
son, two or more data sets are within ±10%. With
others, two or less data sets are within ±10%. In the
case of area and amplitude with the same person,
nine or more data sets are within ±10%. With others,
eight or less data are within ±10%.
Table 2 shows the differences between the max-
imum number of matching data sets with others and
the number of matching data sets with the same
person regarding to a template. In the case of ampli-
tude, the differences exist from 0 to 6 while the
major differences are from 0 to 2. On the other hand,
in the case of area and amplitude, the differences
exit from 1 to 8 while the major differences are from
1 to 5. The differences are larger than amplitude.
Table 3 shows the differences between the max-
imum number of matching data sets with others and
the number of matching data sets with the same
person regarding to an individual. In the case of
amplitude, the differences exist from -1 to 7 while
the major differences are from 1 to 3. On the other
hand, in the case of area and amplitude, the differ-
ences exit from 1 to 7 while the major differences
are from 1 to 5. The differences are larger than the
amplitude.
Figure 11 shows the result of FRR (False Rejec-
tion Rate) and FAR (False Acceptance Rate). The
threshold where FRR is almost the same as the FAR
is 9. EER (Equal Error Rate) is about 0.26%.
4.3 Discussions
Table 1 shows the results of minimum number of
matches with the same person and the maximum
number of matches with others. In other words,
when the number of matches with the same person is
large and the number of matches with others is small,
the accuracy of authentication is high. However, in
the case of amplitude, authentication is difficult
because the number of matches with others is larger
than the number of matches with the same person.
On the other hand, in the case of amplitude and area,
the minimum number of matches with the same
person is larger than the maximum number with
others. Therefore, the authentication is possible.
Tables 2 and 3 show the results of the minimum
differences between the numbers of matches with
others and each individual. In other words, it shows
the accuracy of the proposed method. The larger the
differences are, the higher the accuracy of authenti-
cation is. In the case of just amplitude, the number
of differences is 0 in Tab. 2 and the number of dif-
ferences is -1 and 0 in Tab. 3. Thus, the authentica-
tion is very poor.
On the other hand, the proposed method is pro-
vides better authentication because the differences
are one or more. In addition, the differences in the
proposed method are larger than just amplitude as
described in Tab. 2 and Tab. 3.
Thus, existing methods provide poor authentica-
tion while the proposed method gives better personal
authentication. Furthermore, it is concluded that the
BIOSIGNALS2014-InternationalConferenceonBio-inspiredSystemsandSignalProcessing
316

number of required matches for right authentication
is 9.
5 CONCLUSIONS
In this paper, we have proposed a biometric authen-
tication method using area and amplitude infor-
mation obtained from heartbeat waveforms. In this
method, noise reduction is performed using the
wavelet transformation and the cepstrum to execute
normalization based on R wave peaks. Then, the
wavelet expansion coefficients are calculated with
the wavelet transformation to extract feature points P,
P
s
, Q, R, S, T, and T
f
. Amplitudes and area sizes are
calculated with the feature points to be compared
with the data sets in the templates, and authentica-
tion is performed.
The experiment results show that we define the
standards to judge if it is the same person or not. In
addition, it is contemplated that combinatorial use of
amplitude and area leads to higher accuracy.
For our future work, we have more experiments
with larger numbers of examinees. In addition, we
would like to devise new parameters other than area
and amplitude.
It is known that heartbeat waveforms change
with age (Sara Bachman et al., 1981). Several weeks,
or even several months later, it should be checked
whether authentication is still possible or not. If
changes are observed by individual, it would be
possible that we use this change rate as a new pa-
rameter.
REFERENCES
Marina Uchimura, Yuki Eguchi, Minami Kawasaki,
Naoko Yoshii, Tomohiro Umeda, Masami Takata, and
Kazuki Joe (2012), “Real Time Spatiotemporal Bio-
logical Stress Level Checking”, The 2012 Internation-
al Conference on Parallel and Distributed Processing
Technologies and Applications, Vol.2, pp 744-749.
C. S. R.Prabhu, A. PrathapReddi (2004), Bluetooth Tech-
nology: and its Ap-plications with Java and J2ME,
PHI Learning Pvt. Ltd.
Anil K. Jain, Ruud Bolle, Sharath Pankanti, (1999), Bio-
metrics: Personal Identification in Networked Society,
Springer.
P. Sasikala , R. S. D. Wahidabanu, (2010) “Identification
of Individuals using Electrocar-diogram” , IJCSNS In-
ternational Journal of Computer Science and Network
Security, Vol.10 No.12, pp.147-153.
Y. Wang, F. Agrafioti, D.Hatzinakos K. N Plataniotis,
(2008), “Analysis of human electrocardiogram for bi-
ometric recognition”, Hindawi Publishing Corporation,
EURASIP Journal on Advances in Signal Processing
Volume, pp.1-11.
S. A. Israel, J. M. Irvine, A. Cheng, M. D. Wiederhold,
and B. K. Wiederhold, (2005), “ECG to identify indi-
viduals”, Pattern Recognition, Vol.38, No.1, pp.133-
142.
S. Banerjee ,R. Gupta, M. Mitra, (2012), “Delineation of
ECG characteristic features using multiresolution
wavelet analysis method”, Measurement, SciVerseSci-
enceDirect, Vol.45, No.3, pp 474–487.
S. Pal, M. Mitra, (2010), “Detection of ECG characteristic
points using Multiresolution Wavelet Analysis based
Selective Coefficient Method”, Measurement, Sci-
enceDirect, Vo.43, No.2, pp 255–261.
S. Pal, M. Mitra, (2010), The Illustrated Wavelet Trans-
form Handbook: Introductory Theory and Applica-
tions in Science Engineering Medicine and Finance,
CRC Press.
Foo-Tim Chau, Yi-Zeng Liang, Junbin Gao, Xue-Guang
Shao, (2004), Chemometrics: From Basics to Wavelet
Transform, John Wiley & Sons.
D. G. Childers, D. P. Skinner and R. C. Kemerait, (1977),
The Cepstrum: A Guide to Processing, vol. 65, Pro-
ceedings of the IEEE, pp. 1428-1443.
Ioannis Pitas, Anastasios N. Venetsanopoulos, (1990),
Nonlinear Digital Filters: Principles and Applications,
Springer.
Starlab Living Science, (2013),Enobio http://
neuroelectrics.com/enobio.
Sara Bachman, David Sparrow, L. Kent Smith, (1981),
“Effect of aging on the electrocardiogram”, The Amer-
ican Journal of Cardiology, Vol.48, No.3, pp.513–516.
BiometricsAuthenticationusingAnotherFeatureofHeartbeatWaveform
317
