
Energy Aware Communication in the Smart Grid
Zoya Pourmirza
and John M. Brooke
School of Computer Science, The University of Manchester, Manchester, U.K.
Keywords: Smart Grid, NAN, Energy Efficiency, ICT Architecture, Optimal Network Topology, Data Reduction.
Abstract: Recently some countries have investigated the transformation of their existing power grid to the so-called
Smart Grid. A Smart Grid adds a communication network, which is the integration of a monitoring and
control network, to the power network. In this research we have developed and implemented a
communication network architecture for the neighbourhood sub-Grid level of the electrical network where
monitoring has not previously been deployed. Since energy efficiency has been identified as one of the
major limitations of such networks we have utilized a number of different techniques to tackle this problem.
As such, we analyse the optimal topology of network for collecting and transmitting data to the local control
unit for applying finer-grained control. Also, we have developed a data reduction algorithm suitable for
Smart Grid applications, which can significantly improve the energy efficiency of the communication
network by minimizing the communication energy cost and optimizing the network resource consumption
while maintaining the integrity and quality of data. To the best of our knowledge, our work is one of the
very first efforts to propose an energy efficient ICT architecture, combining power grid objectives, real data
characteristics, and application-aware considerations.
1 INTRODUCTION
In the recent years scientists have identified a
number of problems associated with the
conventional power grid and tried to tackle them.
This has led to the birth of the concept of a Smart
Grid. According to the US Department of Energy
(DOE) (Miller et al., 2008) the Smart Grid should
contain the following characteristics; self-healing,
consumer friendly, reliable with good power quality,
resistant to cyber-attack, and facilitating new service
and markets. To achieve these features necessitates
the incorporation of the Information and
Communication Technology (ICT) along with the
power network.
Deploying a large number of monitoring devices
in the Smart Grid environment that transmit huge
volume of data will saturate the device resources and
consumes their energy. Some of the key constraints
of wireless sensor devices are their limited resources
such as memory, battery and processing power.
Since battery technology used in the sensor network
has a slower development rate than both the sensor
device technology and the processor technology
(Miao et al., 2009), the energy constraint problem
has emerged as one of the main limitations of these
network when wireless communication is proposed.
In such networks difficulties arise when the
deployed sensors are short on power, thus a specific
area of the grid is no longer being monitored at a
sufficient rate, which will lead to incorrect decision
making by the control mechanisms and operators of
the grid.
In this paper we will summarize and integrate
different aspects of an experimental Smart Grid
project taking place in the University of Manchester.
We will briefly discuss our proposed ICT
architecture, which involves the integration of
various monitoring devices, storage and control units
for the neighbourhood area network (NAN) of the
ICT network within the Smart Grid. Implementing
our proposed architecture in the real environment
rather than solely in a simulation-based
environment, enables us to identify a number of
drawbacks associated with such networks. One of
the major problems which we will discuss in this
paper is the energy efficiency consideration of the
communication network. These limitations
necessitate development of the techniques to
consume sensor resources more efficiently to
achieve better quality of the network, longer lifetime
and time between maintenance sessions.
Observing that 50% of energy is spent during the
131
Pourmirza Z. and M. Brooke J..
Energy Aware Communication in the Smart Grid.
DOI: 10.5220/0004937501310138
In Proceedings of the 3rd International Conference on Smart Grids and Green IT Systems (SMARTGREENS-2014), pages 131-138
ISBN: 978-989-758-025-3
Copyright
c
2014 SCITEPRESS (Science and Technology Publications, Lda.)

data transmission process, we realize that it is not
practical to broadcast full resolution data over long
distances. Therefore, we investigated how to
configure the communication network of the
wireless monitoring devices and also how to apply
the data reduction techniques to decrease the size of
transmitted file before transmission process. These
result in more effective utilization of available
resources and offer better energy efficiency to the
system.
2 PROPOSED ICT
ARCHITECTURE FOR SMART
GRIDS
In (Pourmirza and Brooke, 2013c) we proposed two
related architectural structures and discussed our
experimental results for the ICT infrastructure of an
urban environment in the Smart Grid. These two
architectures are: a communication network
architecture and a software architecture. In this
section we summarize the communication
architecture and its constituent components. In the
next section we will demonstrate the techniques we
have used to provide energy efficient
communication architecture specially designed for
the NAN of the Smart Grid.
The proposed architecture is a modular
architecture that integrates the peer-to-peer
hierarchical architectures, tailored to hybrid
communication technologies for transmitting data. It
is being implemented on the medium voltage power
network substation 6.6kV of the University of
Manchester campus which owns its own distribution
grid. This allows us to validate our architectural
designs on real equipment, real data, and input from
experts in power engineering. This architecture
(figure 1) comprises five layers that cooperate to
offer four main functions of monitoring, data
movement, data storage and control. Our proposed
architecture offers modularity, scalability, fault
tolerance, energy efficiency and future proofing
against changes in networking technology. Each of
these characteristics are discussed in details in
(Pourmirza and Brooke, 2013c).
The first layer in the figure 1 consists of smart
meters as monitoring devices, which are situated in
all the buildings of the University of Manchester.
They are responsible for monitoring building level
data that provide information about power usage and
permit the management of the power generation and
consumption. The information collected at this level
is valuable for prosumers (producer-consumer),
because by integrating such data with data on real-
time energy prices we can offer effective demand
response control.
The second layer comprises hundreds of sensors
located in the street areas that are responsible for
monitoring environmental data such as temperature,
light, and humidity. The data collected at this level is
essential for understanding the response of demand
on the electrical system to variables such as number
of people, weather, temperature, humidity and so on.
It also can help in controlling the power grid by
delivering data that can be used to anticipate demand
and improve control actions.
The second layer itself is divided into two sub-
layers. This division is due to the energy constraints
of the Wireless Sensor Network (WSN).
Consequently we have utilized cluster based
communication as a method of communication
instead of direct communication as a more energy
efficient data transmission technique (Abbasi and
Younis, 2007). In order to evaluate the WSN at this
level, we extended the TinyDB (MADDEN et al.,
2005) (WSN query processing engine) by adding a
Smart Grid component to it. The extension to
TinyDB enables us to run and test our prototype
implementation in the laboratory-based environment
as well as in a real physical environment.
The third layer comprises the monitoring and
control devices situated in 6.6 kV substations in our
test bed. They are responsible for monitoring three
phase voltages, currents, active power, power
factors, voltage's spectra (eight channels for each
phase) and current spectra (eight channels) and
frequency. These data are useful for fault
identification, power quality analysis, and many
other applications. This layer is also divided into
three sub-layers: namely a reconfigurable real-time
control and acquisition system called Compact RIO
(cRIO), data storage, and a control unit which is a
program responsible for applying control over the
substations only, that is called LabVIEW
(LabVIEW, 2007). The next layer (fourth) is the
database (DB) layer responsible for storing data
received from the layers below.
The final layer is the Neighbourhood Control
Unit (NCU) which extracts data from the database
layer or directly from the sensors. We have
developed a Geographical Information System (GIS)
enhanced display tool (Pourmirza and Brooke,
2013b) for this layer which is beneficial for
visualizing the live/historical data on a map view,
and for tracking and identifying the faulty part of the
system in advance.
SMARTGREENS2014-3rdInternationalConferenceonSmartGridsandGreenITSystems
132
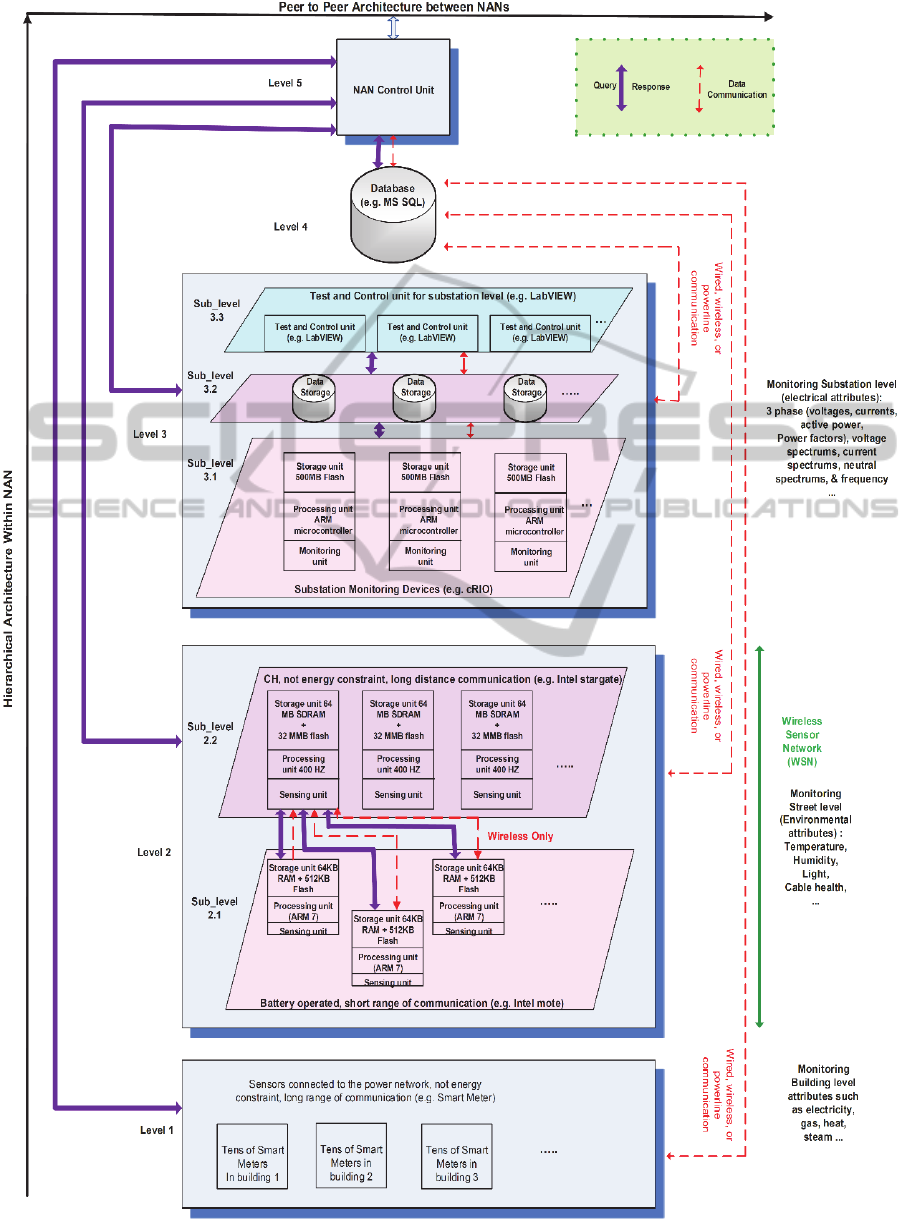
Figure 1: An ICT architecture for the NAN in the Smart Grid (Pourmirza and Brooke, 2013c).
EnergyAwareCommunicationintheSmartGrid
133
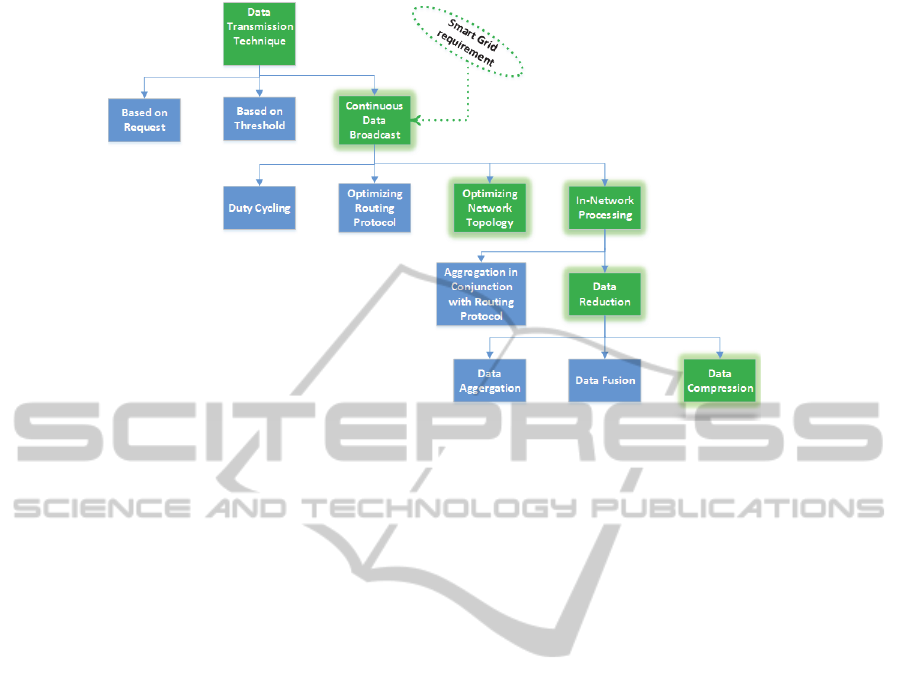
Figure 2: Efficient data transmission.
In an urban environment multiple NAN systems
should join to form a higher sub-grid network.
Therefore, we have added another layer of
communication over the top of the architecture to
enable these systems to communicate and coordinate
their control actions.
3 TECHNIQUES TO PROVIDE
ENERGY EFFICIENT DATA
TRANSMISSION
We have classified the data transmission technique,
which is the technique devices use to transfer their
data to the NCU, into three different categories. The
first category is used when sensors transmit their
data after receiving requests from the sink. The
second category is when sensors send data indicating
that a threshold condition is violated or when an
emergency situation has occurred. The third
category is when sensors collect data and broadcast
them continuously. Although the first and second
category are more energy efficient methods of data
transmission, because data are being shipped with
lower frequency or only occasionally, our NAN
monitoring network in the Smart Grid also
necessitates the third category, because electrical
engineers want to monitor data collected from the
grid at all times. Thus full data collection is needed
in such networks.
Our survey of the literature reveals that the
energy efficient radio communication can be
accomplished through different means, such as; duty
cycling, optimizing the routing algorithm,
optimizing the network topology, and in-network
processing. Duty cycling can be achieved through
scheduling the sleep/wakeup program of sensors
(Anastasi et al., 2006), which is not, however, an
appropriate technique in our context, since our
sensors are continuously sensing and sending data
without going back to sleep mode. Optimizing the
routing algorithm can be accomplished by
developing a multi-hop routing algorithm that can
identify the next optimal hop to route the message to
the sink. In our network design we assume we have
direct communication instead of multi-hop
communication; therefore, optimizing the routing
protocol is out of the scope of this research.
Optimizing the network topology can be achieved
through managing the communication distance,
which is the first technique we have utilized in our
research. Finally in-network processing can be
classified in two classes. The first class is the data
aggregation techniques being implemented in
conjunction with WSN routing protocols. A survey
of data aggregation techniques in WSNs (Thangaraj
and Ponmalar, 2011) has introduced and analysed
several such data aggregation protocols. The second
class of in-network processing methods is called
data reduction, which is performed by implementing
data reduction algorithms to reduce the
communication cost by minimizing the size of
transmitted data. Applying data reduction will result
in efficient bandwidth utilization and also power
saving caused by data transmission, which will
increase the network lifetime (Naoto and Shahram,
2005). The technique used in this research to offer
SMARTGREENS2014-3rdInternationalConferenceonSmartGridsandGreenITSystems
134
energy efficiency to the communication network
belongs purely to the second class of in-network
processing, i.e. the data reduction method.
Data reduction itself can be classified into data
aggregation, data fusion, and in-network data
compression. Data aggregation is useful when the
goal is to reduce the communication overhead and
cost. This method will reduce the message size by
utilizing one of the aggregation functions such as
Min, Max, Sum, and Average (Tan et al., 2007).
Data fusion is a more elegant method in
comparison with the data aggregation. In this
method various unreliable data will be combined to
eliminate the related noise and produce a more
accurate signal (Abdelgawad and Bayoumi, 2012).
Data compression can be described as the procedure
of processing raw data into a condensed structure
rather than its original format. One of the challenges
in the data compression technique is the accuracy of
the decompression algorithm while reconstructing
the data. The data compression is usually used in the
applications where the full data collection is
required. Since electrical engineers working on the
Smart Grid applications are still evaluating the data
we do not use fusion or aggregation. Thus, our data
reduction algorithm is purely a compression method
which keeps the quality and integrity of data. Figure
2 demonstrates the categories and subcategories of
efficient data transmission, and highlights (in green)
the contribution of our research to this area.
3.1 Optimizing the Network Topology
As discussed earlier, the first technique we have
used to provide more energy efficient architecture is
to optimize the WSN topology. In this section we
focus on the second layer of the architecture and
identify the optimal topology of the WSN by
analysing the optimal number of clusters for specific
application in our test bed. However, it should be
noted that these results may vary due to changes in
the networking topology, communication protocol,
and Quality of Service (QOS) requirements. As
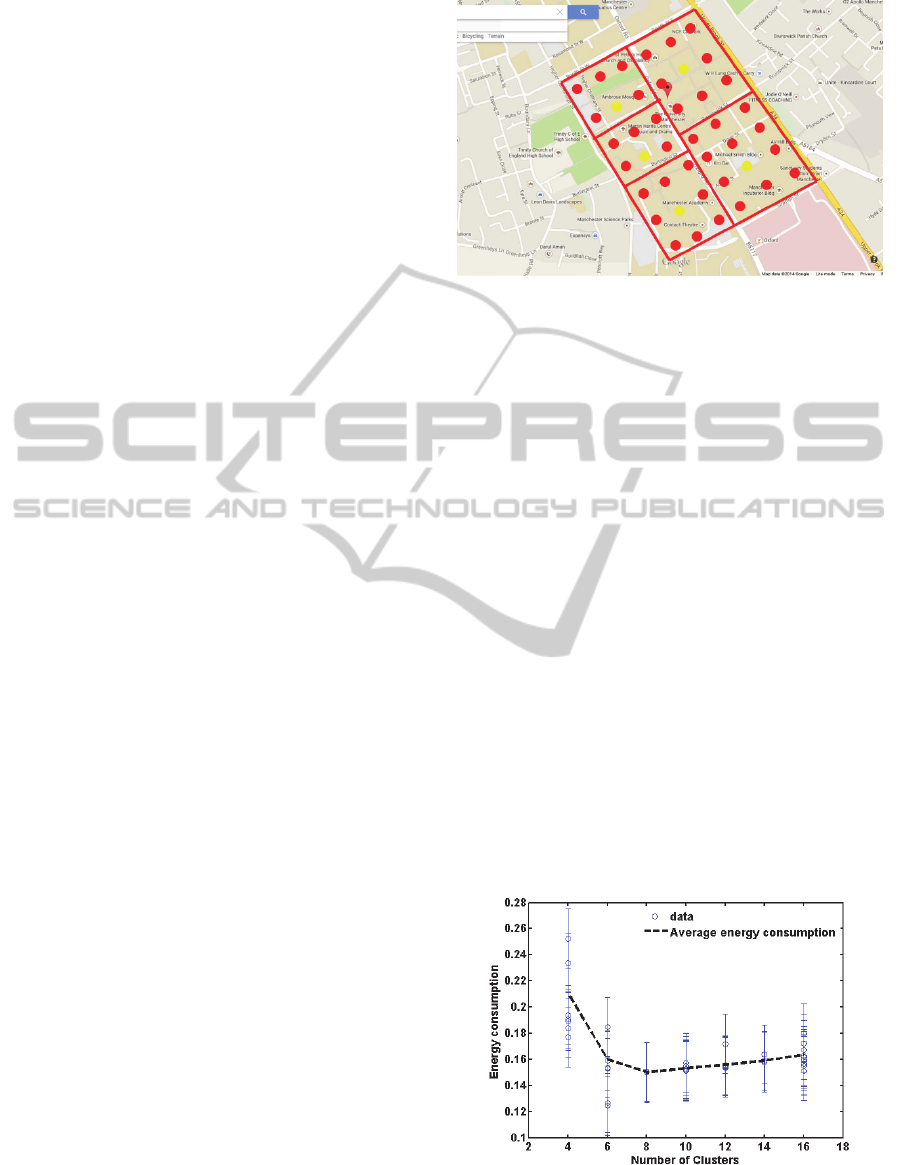
shown in figure 3 the second layer of the
architecture is going to be deployed in the
University of Manchester sub-Grid. The university
campus is embedded in a city, containing streets and
road. The whole campus is connected by rectangular
grid.
Since we are dealing with an urban area the
sensors are located at fixed locations which, to a first
approximation, can be located on a rectangular grid
reflecting the pattern of the urban streets, as shown
in figure 3.
Figure 3: The University of Manchester campus,
representing a rectangular grid, being divided into clusters.
The red dots show normal sensors, while yellow dots are
considered to be a cluster head.
In order to obtain the most energy efficient
topology of a grid we must find the optimal number
of cluster. Therefore we divide the network into
various number of clusters and maintain a fixed
number of sensors. Then we start simulating each of
these networks by varying the number of sensors in
the clusters, cluster shapes and locations for 12
different configurations, all of which preserve the
number of clusters. We have considered different
configurations, because in real projects it is not
always possible to deploy the nodes in the most
optimal topology, thus we estimate the variance.
Figure 4 shows total energy consumption against the
number of clusters. The curve demonstrates a
minimum at 8 clusters. The result that the minimum
occurs at 8 clusters is a function of the total size of
our rectangular grid (10x10) and the amount of
energy consumed by the CHs; however, the methods
could be used on grids of arbitrary size and CHs.
More details are described in (Pourmirza and
Brooke, 2013d).
Figure 4: Energy cost analysis of a grid with different
number of clusters.
EnergyAwareCommunicationintheSmartGrid
135

Finally our experiments reveal that the two other
factors that affect the energy consumption of a
system are the shape and location of the clusters. We
observe that, if the clusters are rectangular, then the
best result is when the rectangles of the grid are
square. Moreover if we consider different size of
clusters in a network, by locating the smaller clusters
near the data sink, and bigger clusters farther from
the sink, we can also improve energy efficiency of
the WSN.
3.2 Developed Data Reduction
Algorithm
The second technique utilized in this research to
offer communication energy efficiency is to develop
a data reduction algorithm. The exponential increase
of the number of monitoring devices in the Smart
Grid will lead to an explosion in the data volume.
The recent evidence (Allalouf et al., 2011); (IBM,
2012); (McNamara and Meynardi, 2010) has
confirmed this conclusion. As current
communication methods deployed in electrical Grids
are not yet prepared to manage such volume of data,
we have to start developing new methods and
techniques to ease the transmission and storage of
such data. An effective data reduction technique
would be an effective approach in this context.
Previously, in (Pourmirza and Brooke, 2013a)
we proposed a data reduction algorithm for data that
is sampled at a higher rate than the rate at which
successive values change significantly. Recently, we
have improved our data reduction algorithm to
further compress the data before transmission. Our
first data reduction algorithm is called DRACO-1
(Data Reduction Algorithm for Correlated data) and
the improved version is called DRACO-2. In the rest
of this paper we will summarize DRACO-1,
introduce DRACO-2 and demonstrate our
experimental results.
In the Smart Grid applications, where the
metering devices collect data with a high acquisition
rate and transmit them to the NAN control unit, a
great degree of data correlation occurs. Taking this
fact into consideration, we have developed a data
reduction algorithm (DRACO-1) that discards the
redundant bits by applying XOR on each two
consecutive measured values, and transmits the
changing bits only. The changed bits are a small
portion of the binary representation which will be
converted to digit-based representation before
transmission. DRACO-1 is discussed in detail in
(Pourmirza and Brooke, 2013a). This algorithm can
improve the energy efficiency of the communication
network by transmitting smaller value of data while
keeping the data integrity.
The difference between the DRACO-1 (method
1) and DRACO-2 (method 2) is that on the
transmitter side, after applying XOR and converting
the binary representation back to digit-based
representation, if any consecutive values are similar,
DRACO-2 will only send one instance of that value
together with the number of repetition times.
Although DRACO-2 is not as stable and general as
DRACO-1, DRACO-2 is very helpful in
compressing high volume data with strong
correlations (such as frequency and voltage data)
and in these cases it can perform better than
DRACO-1.
In order to evaluate the compression efficiency
of both DRACOs, and also assess their performance
on different hours of a day, and check the behavior
of the electrical grid during the peak hours and non-
peak hours, we have examined both DRACOs on 24
hours of real data (these data are collected from 8:00
24
th
April 2013 to 8:00 25
th
April 2013 with
frequency of 1 Hz from a 6.6 kV substations in our
test bed). Figure 5 compares DRACO-1 (blue line)
and DRACO-2 (red line) using the voltage data. It
shows that DRACO-2 gains a higher compression
ratio and is a more efficient algorithm for voltage
compression. Moreover, it reveals that after 16:00 (4
p.m.) we can gradually achieve better compression
(over 89%) ratio until 1:00, which means the
electrical grid is steadier and as the result the data
correlation is higher during this period of time.
Checking the load profile of the system has
confirmed our results.
Figure 5: 24 hours of compressed voltage data.
Additionally, another experiment has been
designed to assess the effect of various sampling rate
on the efficiency of our data reduction algorithm.
We have examined the data being logged with
different frequency. Figure 6 shows that, as the
SMARTGREENS2014-3rdInternationalConferenceonSmartGridsandGreenITSystems
136

frequency of data acquisition rate increase, the
original size of the data will increase, which is
simple to understand. However, as we start to
sample more frequently the gap between the original
data size and the reduced data will grow as well.
Thus, with higher sampling rate we are transmitting
more information about the grid, and with the use of
the DRACOs we can send this information more
efficiently. This result confirms the observation that
when data are being sampled at a faster rate, the
correlation between each two consecutive value is
higher, and DRACO performs best on data with
stronger correlations. Moreover, we conclude that
the size of the reduced data file (DRACO-1) with
data being logged once every second is roughly
equal to the size of original data being logged once
every 3 seconds. This result is beneficial in terms of
bandwidth utilization and hence energy
consumption.
Figure 6: Data acquisition rate evaluation.
4 CONCLUSIONS
In this paper we present a practical energy efficient
ICT architecture for the NAN in the Smart Grid.
Although we had previously discussed about
different aspects of this research separately, this is
the first time that all these finding are integrated to
present a completed project.
At the beginning of this research we proposed a
communication network architecture and analysed
its design in terms of offering energy efficiency for a
local control system. Then we evaluated the
techniques to offer more energy efficient data
transmission. As the result we follow two
approaches, optimizing the network topology and
applying a data reduction technique at various level
of the architecture. Regarding the optimization of
the network topology, we present our experimental
results that the number of clusters, their shapes and
the way the clusters are geographically grouped are
all important to offer deeper a minimum of energy
consumption. Then we presented an updated version
of our data reduction algorithm (DRACO.) We
confirmed experimentally that the data from the
NAN of the Smart Grid conformed to the pattern
required by both DRACOs. An important part of this
work is that we have been able to validate and test
DRACO on data, which are produced at a very high
sampling rate. This is useful in terms of identifying
key changes in behaviour of electrical systems. One
significant contribution of this research is that the
algorithm can reduce the power consumption and
improve the overall energy efficiency of the
communication network in the proposed
architecture. Finally, it can provide an efficient flow
of information by reducing data traffic and
accelerating data transmission speed. Since, in such
networks, the bottleneck is caused by the fact that
thousands of sensors are sending their data to the
central point, in some cases by applying DRACO
and reducing data roughly by an order of magnitude
(to base 10) we can reduce the risk of bottleneck.
In future we will monitor the performance of
DRACO over extended period of time to estimate
how much energy and storage could be saved in an
ICT network with this technique.
ACKNOWLEDGEMENTS
We are thankful to Professor Ian Cotton and Mr
Peter R. Green in the school of Electrical and
Electronic Engineering in the University of
Manchester for providing experimental data and
their valuable feedback.
REFERENCES
What is NI LabVIEW? [Online]. National Instruments.
Available: http://www.ni.com/labview/whatis/
[Accessed 02/07/2011].
Abbasi, A. A. & Younis, M. (2007) A survey on clustering
algorithms for wireless sensor networks. Computer
Communication, 30(14-15), 2826-2841.
Abdelgawad, A. & Bayoumi, M. (2012) Data Fusion in
WSN. Resource-Aware Data Fusion Algorithms for
Wireless Sensor Networks. Springer.
Allalouf, M., Gershinsky, G., Lewin-Eytan, L. & Naor, J.
(2011) Data-quality-aware volume reduction in smart
grid networks. In: IEEE International Conference on
Smart Grid Communications (SmartGridComm) 17-
20 October 2011 Brussels, Belgium. IEEE, 120-125.
Anastasi, G., Conti, M., Di Francesco, M. & Passarella, A.
(2006) How to prolong the lifetime of wireless sensor
networks. Valencia, CA: American Scientific
EnergyAwareCommunicationintheSmartGrid
137

Publishers.
IBM. (2012) Managing big data for smart grids and smart
meters. Information Management. USA.
LabVIEW. (2007) LabVIEW Fundamentals. Austin,
Texas: National Instruments Corporation.
MADDEN, S. R., FRANKLIN, M. J., HELLERSTEIN, J.
M. & HONG, W. (2005) TinyDB: An Acquisitional
Query Processing System for Sensor Networks. ACM
Transactions on Database Systems, 30(1), 122–173.
McNamara, K. & Meynardi, A. (2010) Navigating the
Road to Smart Grid: Modernizing the Critical
Communication Infrastructure. Smart Grid. USA:
Verizon.
Miao, G., Himayat, N., Li, Y. & Swami, A. (2009) Cross-
layer optimization for energy-efficient wireless
communications: a survey. Wireless Communications
and Mobile Computing, 9(4), 529-542.
Miller, J., Pullins, S. & Bossart, S. (2008) ″ The Modern
grid ″ U.S. Department of Energy, Office of
Electricity Delivery and Energy Reliability. U.S.
Department of Energy, Office of Electricity Delivery
and Energy Reliability.
Naoto, K. & Shahram, L. (2005) A survey on data
compression in wireless sensor networks. In:
Information Technology: Coding and Computing,
2005. ITCC 2005. International Conference on, 4-6
April 2005 2005. IEEE Computer Society, 8-13.
Pourmirza, Z. & Brooke, J. M. (2013a) Data Reduction for
an ICT Network in the Smart Grid. In: The 9th
International Conference on Intelligent Environments -
IE'13, 2013a Athens, Greece. IEEE Explore.
Pourmirza, Z. & Brooke, J. M. (2013b) Monitoring and
Visualising a Neighbourhood Area Sub-Grid.
SMARTGREENS 2013-2nd International Conference
on Smart Grids and Green IT Systems. Aachen,
Germany: SCITEPRESS – Science and Technology
Publications.
Pourmirza, Z. & Brooke, J. M. (2013c) A Realistic ICT
Network Design and Implementation in the
Neighbourhood Area of the Smart Grid. Smart Grid
and Renewable Energy, 4(6), 436-448.
Pourmirza, Z. & Brooke, J. M. (2013d) The Wireless
Sensor Network and Local Computational Unit in the
Neighbourhood Area Network of the Smart Grid. In:
International Conference on Sensor Networks
(SENSORNETS), 2013d Barcelona, Spain.
SCITEPRESS – Science and Technology Publications,
84-88.
Tan, H. O., Korpeoglu, I. & Stojmenovic, I. (2007) A
Distributed and Dynamic Data Gathering Protocol for
Sensor Networks. Proceedings of the 21st
International Conference on Advanced Networking
and Applications. IEEE Computer Society.
Thangaraj, M. & Ponmalar, P. P. (2011) A Survey on data
aggregation techniques in wireless sensor networks.
International Journal of Research and Reviews in
Wireless Sensor Networks (IJRRWSN), 1(3), 36-42.
SMARTGREENS2014-3rdInternationalConferenceonSmartGridsandGreenITSystems
138
