
Flexible Peak Shaving in Data Center
by Suppression of Application Resource Usage
Masaki Samejima
1
, Ha Tuan Minh
2
and Norihisa Komoda
1
1
Graduate School of Information Science and Technology, Osaka University, 2-1, Yamadaoka, Suita, Osaka, Japan
2
School of Engineering, Osaka University, 2-1, Yamadaoka, Suita, Osaka, Japan
Keywords: Peak Shaving, Data Center Management, Application Resource Usage, Regression Analysis.
Abstract: We address the peak shaving of the electricity consumption in the data center. The conventional peak
shaving method is “power capping” that limits the electricity consumption by all the applications in the
server. In order to shave the peak of only the unimportant applications, we propose the flexible peak shaving
by suppression of application resource usage. By monitoring the resource usage of all the applications, the
proposed method decides how much the electricity consumption should be decreased with multiple
regression analysis on the linear model between the electricity consumption and the CPU usage. As
preliminary investigation, we constructed the linear model with using the observed values of the power
consumption and CPU usage on the actual servers.
1 INTRODUCTION
It became possible to use various convenient
applications online as “cloud services” by the
progress of the internet technology (Pallis, 2010).
Many cloud services run on servers in the data
centers because the data centers provide high
performance servers and necessary reliability
inexchange for a regular cost. Managers in the data
centers have to keep the performance and the
reliability that the cloud service provider hopes by
running multiple servers. On the other hand, the
servers consume much electricity, which increases
the electricity cost in the data center (Zomaya, 2012)
(Beloglazov, 2010).
In the near future, the price of the electricity
changes dynamically to reduce the variance of the
electric consumption because the variance of the
electric consumption needs to generate additional
electricity, which costs the electricity industry
highly. One of the pricing methods to reduce the
variance is “Demand response” (Albadi 2008). The
demand response increases the price of the
electricity under the high demand of the electricity
and decreases the price of the electricity under the
low demand of the electricity.
Considering the situation of the electricity
consumption, the managers in the data center have to
decrease the amount of the electricity consumption
to an upper limit when the price of the electricity is
high. This is called as “Peak shaving” (Wang 2012).
The conventional method for the peak shaving
makes the servers deploy several virtual machines
that have different computer resources and operating
systems by using virtualization technology (Schulz,
2009). And, the peak of the electricity consumption
is shaved with the hardware devices in the servers to
control the power consumption in the servers, e.g.
decrease the number of CPU cores that the cloud
services can use. This function is called as “Power
capping” (Panda, 2010) (Kontorinis, 2012)
(Almoosa, 2012). The conventional method can
decrease resource usage of the applications on the
virtual machines in the servers. Even if both of
important applications and unimportant applications
run on the same server, the conventional method
decreases the resource usage of both applications.
This prevents the important applications from
running normally.
In this paper, we propose the flexible peak
shaving method that enables to decrease the resource
usage of unimportant applications. By monitoring
the resource usage of all the applications, the
proposed method decides how much the electricity
consumption should be decreased. By displaying the
electricity consumption to be decreased, the manager
can select the unimportant applications and decide
355
Samejima M., Tuan Minh H. and Komoda N..
Flexible Peak Shaving in Data Center by Suppression of Application Resource Usage.
DOI: 10.5220/0004939503550360
In Proceedings of the 16th International Conference on Enterprise Information Systems (ICEIS-2014), pages 355-360
ISBN: 978-989-758-028-4
Copyright
c
2014 SCITEPRESS (Science and Technology Publications, Lda.)
the electricity consumption to be suppressed at the
unimportant applications.
The rest of the paper is organized as follows.
Section 2 describes peak shaving in data center and
its problems. Section 3 describes flexible peak
shaving method. Section 4 describes the preliminary
experiment to evaluate the validity of the proposed
method. Section 5 deals with the conclusion derived
from the experimental results.
2 PEAK SHAVING IN DATA
CENTER
2.1 Target Data Center Model
Data center needs to provide many kinds of the
computers that have different performance and
operating systems to run applications that can run on
different computers. Virtualization technology
enables to deploy different computers virtually on
the same server. This contributes to decreasing the
number of servers. The computers that are deployed
virtually are called “Virtual machine”. Virtual
machines can use the resource usage such as CPU in
the server and any operating systems. Applications
can run on the virtual machines. Based on the
relations among applications, virtual machines and
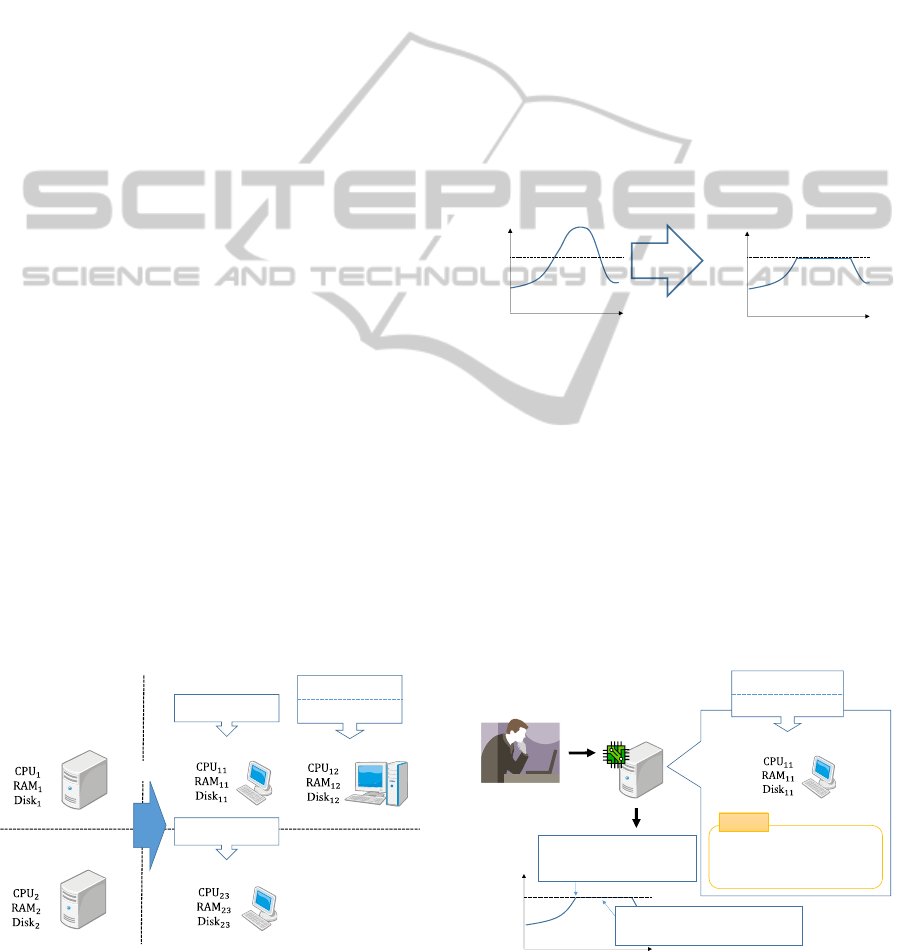
servers, we have modelled the target data centers as
shown in Figure 1.
Each physical server has its resource of CPU,
RAM and disk. Each virtual machine uses the
resources of the physical server where the virtual
machines are deployed. The total resource usage by
virtual machines have to be under the resource of the
physical servers. Only the physical servers consume
the electricity. The power consumption can be
observed every seconds by smart meter.
Figure 1: Target data center model.
2.2 Problems on Peak Shaving in Data
Center
Figure 2 shows the power consumption of the
physical servers to provide services that are related
to the web application (Palasamudram, 2012). In the
management of the web applications, much
electricity is consumed in the afternoon and the less
electricity is consumed in the night. This is because
the web application uses the resource of the servers
to deal with the many requests from users in the
afternoon. If the data center is located in a hot place,
the power consumption for cooling down the servers
in the afternoon is also high. In this case, the
managers often do “peak shaving” that decreases the
power consumption of the servers under an upper
limit in order to avoid excess consumption of the
electricity as shown in Figure 2.
Figure 2: Example of peak shaving.
The conventional method of peak shaving is power
capping that limits the power consumption to the
upper limit (Kontorinis, 2012) (Almoosa, 2012).
Figure 3 shows the outline and the problem of power
capping. The manager sets the upper limit to the
controller of power capping. When the controller
detects the situation that the electricity consumption
is over the upper limit, the controller decreases the
power consumption by changing the voltage in CPU.
This means that the resource usage of the virtual
machine is also limited.
Figure 3: Problem of power capping.
Server 1
Server 2
Virtual machine 1
Virtual machine 2
Virtual machine 3
APP1
APP2
APP3
APP4
Physical servers
Virtualization
time
Electricity consumption
a.m. 0:00 p.m. 0:00
Upper
limit
timea.m. 0:00 p.m. 0:00
Upper
limit
Electricity consumption
Peak
shaving
Manager
Server
Controller
chip
Set upper
limit
timea.m. 0:00 p.m. 0:00
Upper
limit
Electricity
consumption
Detect the situation that
Electricity
consumption
> Upper limit
Electricity consumption is decreased
by limiting resource usage
Power capping
Virtual machine 1
APP1(important)
APP2(unimportant)
All the applications that include
important applications can not
use resource sufficiently
Problem
ICEIS2014-16thInternationalConferenceonEnterpriseInformationSystems
356
In the data center, both of important applications
and unimportant applications run on the same server.
In case of applying power capping to the server, the
resource usage of both applications are limited.
When the important applications have to run
normally without limiting the resource usage, the
power capping method can not be applied for
limiting the resource usage.
3 FLEXIBLE PEAK SHAVING BY
SUPPRESSION OF
APPLICATION RESOURCE
USAGE
3.1 Outline of the Flexible Peak
Shaving System
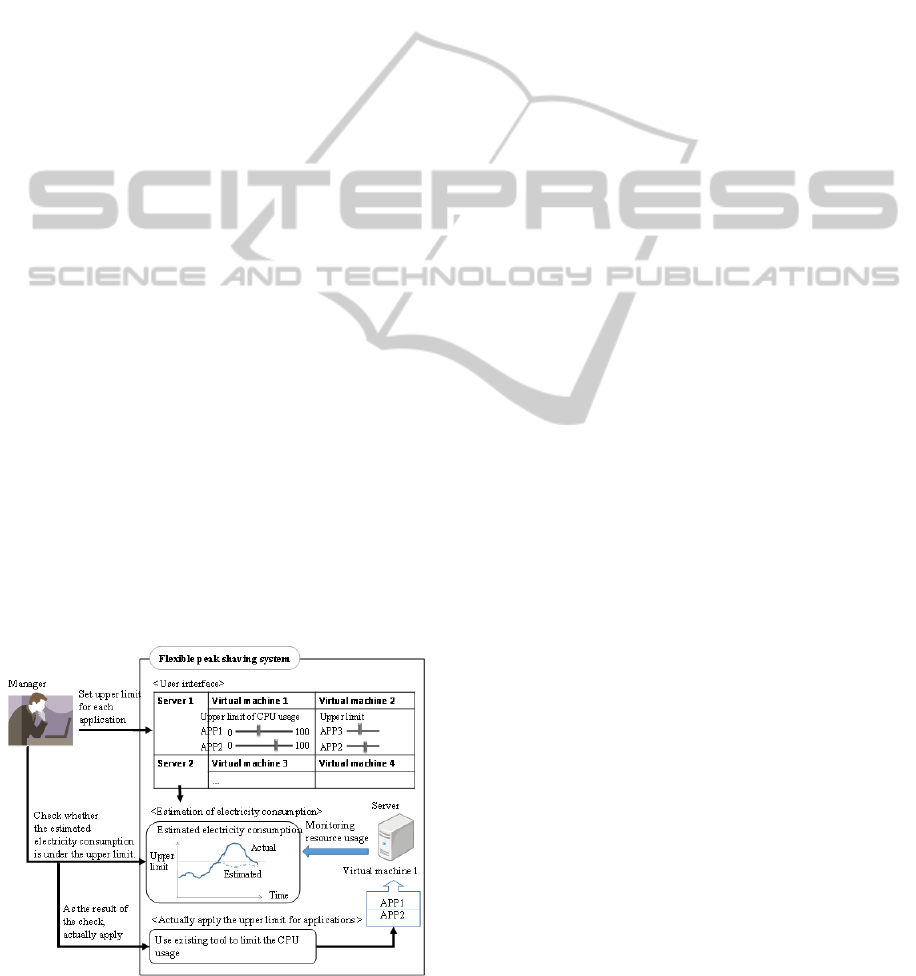
Figure 4 shows the outline of the flexible peak
shaving system. First the manager sets the upper
limit of resource usage for each application on the
user interface. As indicated in literatures
(Tsirogiannis , 201) (Elnozahy, 2003), the resource
that uses much electricity is CPU. So, we consider
only the upper limit of CPU usage. As shown in
Figure 4, the manager can set the upper limit of CPU
usage with slide bars. The manager selects the
unimportant applications from shown names of the
applications, and slides the pointer to lower CPU
usage by using the software tools such as CPU limit
(CPUlimit, 2012). At this point, the server does not
limit the CPU usage. Until the manager actually
applies the upper limit of CPU usage to the servers,
the manager can not know whether the electricity
consumption is under the upper limit of the power
consumption.
Figure 4: Outline of the flexible peak shaving system.
So, the flexible peak shaving system estimates
and displays the power consumption if the upper
limit of CPU usage is applied. The graph in Figure 4
shows two kinds of transitions of the power
consumption: one is, shown by a solid line, the
actual power consumption without applying the
upper limit of CPU usage, the other is, shown by a
broken line, the estimated power consumption with
applying the upper limit of CPU usage. When the
estimated power consumption is different from that
the manager hopes, the manager has to change the
upper limit of CPU usage. The electricity
consumption is estimated statistically by monitoring
the resource usage and the electricity consumption
of the servers.
3.2 Estimation of Electricity
Consumption
Referring the conventional researches (Tsirogiannis,
2010) (Elnozahy, 2003), we assume that there is a
linear relationship between CPU usage and the
electricity consumption.
(1)
where
is CPU usage of th server and
is the
electricity consumption of th server. And
0
is the electricity consumption per CPU usage and
is the electricity consumption for other resources.
When the th virtual machine in the th server uses
CPU by
,
is expressed by the following
formula:
∈
(2)
where
is CPU usage by processes except for
virtual machines and
is the set of index of virtual
machines that run on the th server. Let
denote the th application’s CPU usage on th virtual
machine in the th server.
is expressed by the
following formula:
∈
(3)
where
is CPU usage by processes except for
applications and
is the set of index of
applications that run on the th virtual machine.
Summarizing the above 3 formulas, we can
obtain the following formula that indicate the
relation between the electricity consumption and the
application’s CPU usage.
FlexiblePeakShavinginDataCenterbySuppressionofApplicationResourceUsage
357

∈
∈
(4)
If it is possible to know
,
,
and
, the
proposed system can estimate the electricity
consumption in changing the upper limit of
.
As we mentioned in the previous section, the
proposed system monitors
,
,
and
. Because each formula is a linear
combination, the coefficient such as
,
,
and
can be estimated statistically by multiple regression
analysis. In the multiple regression analysis, the
values of the coefficients are decided by least-
squares method for the observed
,
,
and
.
4 PRELIMINARY EXPERIMENT
4.1 Outline of the Experiment
In order to confirm that the linear model of the
electricity consumption can be used for estimating
the electricity consumption, we observed the data of
,
,
and
from an actual server.
The server specification has Xeon E5620 2.4GHz
CPU, 8GB Memory and run on CentOS 6.4 (64bit).
We installed KVM (Kernel-based Virtual Machine)
to the server as the virtualization technology. And,
to put a load on the virtual machines, we
implemented the following applications:
App1: An application with high computational
effort and small memory consumption by
calculating square root of random numbers
App2: An application with low computational
effort and large memory consumption by
allocating a certain size of memory
We perform 3 kinds of experiments to confirm the
following linear relationships that are related to the
formula (1), (2) and (3), respectively.
(1) Linear relationship between
and
We run App1 on a server and observe
and
every seconds for 600 seconds.
(2) Linear relationship between
and
We run App1 on multiple virtual machines on a
server and observe
and
every seconds
for 600 seconds. The number of virtual
machines is randomly changed within the range
of [0, 4].
(3) Linear relationship between
and
We run App1 and App2 on a virtual machine
and observe
and
every seconds for
600 seconds.
To judge the linear relationship, we apply multiple
regression analysis to each observed data. In the
multiple regression analysis, it is possible to
measure how well the observed data fit a certain
linear function by multiple correlation coefficientR.
When the multiple correlation coefficientR is over
0.8, we can regard that the liner regression fits the
observed data.
4.2 Experimental Result
The results of the experiments of (1), (2) and (3) are
described in the following:
(1) Linear relationship between
and
Figure 5 shows the scatter plot of the
electricity consumption and CPU usage when
one application runs on a server. Applying the
linear regression, we obtain the following linear
equation and the multiple correlation
coefficientR:
Regression equation
0.17
58
Multiple correlation coefficient R 0.90
(2) Linear relationship between
and
Figure 6 shows the scatter plot of the
electricity consumption and CPU usage when
one application run on several virtual machines
deployed in a server. Applying the linear
regression, we obtain the following linear
equation and the multiple correlation
coefficientR:
Regression equation
0.14
59∀
Multiple correlation coefficient R 0.85
Figure 5: Relation between
and
.
(3) Linear relationship between
and
Power consumption [W]
CPU usage [%]
0
10
20
30
40
50
60
70
80
0 20406080100
ICEIS2014-16thInternationalConferenceonEnterpriseInformationSystems
358
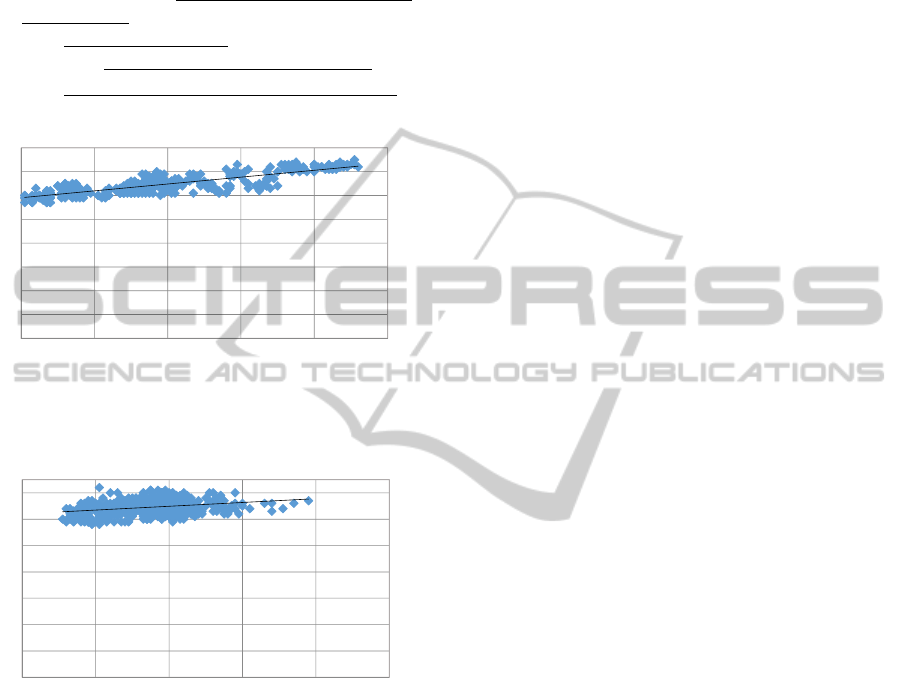
Figure 7 shows the scatter plot of the
electricity consumption and CPU usage when
two kinds of applications run on a virtual
machines on a server. Applying the linear
regression, we obtain the following linear
equation and the multiple correlation
coefficient:
Regression equation
0.07
62∀,∀
Multiple correlation coefficient 0.28
Figure 6: Relation between
and
.
Figure 7: Relation between
and
.
4.3 Discussion
By comparing the results of the experiments of (1),
(2) and (3), the following relations are clarified:
In running one application on virtual machines, the
relation between the electricity consumption and
CPU usage can be regarded to be linear because
the multiple correlation coefficient is over 0.8 in
the experiments of (1) and (2). So the assumption
of the formulas of (1) and (2) in section 3.2 is
considered to be valid for the estimation of the
electricity consumption.
In running several kinds of applications on virtual
machines, the relation between the electricity
consumption and CPU usage does not indicate a
linear relation ship because the multiple
correlation coefficient is 0.28 in the experiment of
(3). So the assumption of the formula of (3) in
section 3.2 is considered not to be valid for the
estimation of the electricity consumption.
Based on the conventional surveys (Kansal,
2010) (Chen, 2011) [10] on the electricity
consumption by CPU, we are discussing the
following reasons why running several applications
breaks the linear relationship:
Even though CPU usage by the applications are
the same, different processes in the applications
consume different value of electricity. For example,
floating-point arithmetic operations consumes
relatively large amount of electricity.
Each process in the application uses a cache on
CPU to reduce the access time to the memory.
When difference processes use the cache, the hit
ratio of the cache tend to become low. This
increases the electricity consumption due to the
increase of the memory access.
If it were possible to know the kinds of the
process and the state of the cache, the information
would be available for the estimation of the
electricity consumption. However, in data center
management, the manager has to manage many
applications. So, it is too difficult to know the kinds
of the process and the state of the cache. On the
other hand, there is a possibility to estimate how
much electricity is consumed by each application if
the difference of the electricity consumption is
statistically significant. Also, considering how many
applications run on the virtual machines may
improve the accuracy of the estimation.
5 CONCLUSIONS
We proposed the peak shaving of the electricity
consumption in the data center. The conventional
peak shaving method is “power capping” that limits
the electricity consumption by all the applications in
the server. In order to shave the peak of only the
unimportant applications, we propose the flexible
peak shaving by suppression of application resource
usage. By monitoring the resource usage of all the
applications, the proposed method decides how
much the electricity consumption should be
decreased with multiple regression analysis on the
linear model between the electricity consumption
and the CPU usage. As preliminary investigation, we
constructed the linear model with using the observed
values of the power consumption and CPU usage on
0
10
20
30
40
50
60
70
80
0 20406080100
Power consumption [W]
CPU usage [%]
0
10
20
30
40
50
60
70
0 20406080100
Power consumption [W]
CPU usage [%]
FlexiblePeakShavinginDataCenterbySuppressionofApplicationResourceUsage
359

the actual servers. However, when multiple
applications run on the virtual machines, the liner
model from the observed data is not valid. Surveying
the reason why the linear relationship is realized in
running multiple applications, we discuss how to
improve the accuracy of the estimation by changing
the regression formula. For the future, we perform
the experiment for many virtual machines on the
servers.
ACKNOWLEDGEMENTS
This work was supported by JSPS KAKENHI Grant
Number 24360154.
REFERENCES
Albadi, M. H., El-Saadany, E. F., 2008. A summary of
demand response in electricity markets, Electric
Power Systems Research, Vol.78, No.11, pp.1989-
1996.
Almoosa, N., Song, W., Wardi, Y., Yalamanchili, S.,
2012. A Power Capping Controller for Multicore
Processors, American Control Conference (ACC),
pp.4709-4714.
Beloglazov, A., Buyya, R., 2010. Energy Efficient
Resource Management in Virtualized Cloud Data
Centers, Proc. of the 2010 10th IEEE/ACM
International Conference on Cluster, Cloud and Grid
Computing (CCGRID '10), pp.826-831.
Chen, Q., Grosso, P., van der Veldt, K., de Laat, C.,
Hofman, R., Bal, H., 2011. Profiling Energy
Consumption of VMs for Green Cloud Computing,
Proc. of 2011 IEEE Ninth International Conference on
Dependable, Autonomic and Secure
Computing(DASC), pp.768-775.
CPUlimit, 2012, http://cpulimit.sourceforge.net/.
Elnozahy, E.N., Kistler, M., Rajamony, R., 2003. Energy-
Efficient Server Clusters, Power-Aware Computer
Systems, Lecture Notes in Computer Science, Vol.
2325, pp. 179-197.
Jaiantilal, A., Jiang, Y., Mishra, S., 2010. Modeling CPU
energy consumption for energy efficient scheduling,
Proc. of the 1st Workshop on Green Computing (GCM
'10), pp.10-15.
Kansal, A., Zhao, F., Liu, J., Kothari, N., Bhattacharya,
A.A., 2010. Virtual machine power metering and
provisioning, Proc. of the 1st ACM symposium on
Cloud computing (SoCC '10), pp.39-50.
Kontorinis, V., Zhang, L.E., Aksanli, B., Sampson, J.,
Homayoun, H., Pettis, E., Tullsen, D.M., Rosing, T.S.,
2012. Managing distributed UPS energy for effective
power capping in data centers, 2012 39th Annual
International Symposium on Computer Architecture
(ISCA), 2012, pp.488-499.
Palasamudram, D. S., Sitaraman, R. K., Urgaonkar, B.,
Urgaonkar, R., 2012. Using batteries to reduce the
power costs of internet-scale distributed networks,
Proc. of the Third ACM Symposium on Cloud
Computing (SoCC '12), No.11, pp.1-14.
Pallis, G., 2010. Cloud Computing: The New Frontier of
Internet Computing, IEEE Internet Computing, Vol.
14, No. 5, pp.70-73.
Panda, P.R, Silpa, B.V.N., Shrivastava, A., Gummidipudi,
K., 2010. Power-efficient System Design, Springer.
Schulz, G., 2009. The Green and Virtual Data Center,
Auerbach.
Tsirogiannis, D., Harizopoulos, S., Shah, M.A., 2010.
Analyzing the energy efficiency of a database server,
Proc. of the 2010 ACM SIGMOD International
Conference on Management of data (SIGMOD '10),
pp. 231-242.
Wang, D., Ren C., Sivasubramaniam, A., Urgaonkar, B.,
Fathy, H., 2012. Energy storage in datacenters: what,
where, and how much?, Proc. of the 12th ACM
SIGMETRICS/PERFORMANCE joint international
conference on Measurement and Modeling of
Computer Systems (SIGMETRICS '12). pp.187-198.
Zomaya, A. Y., Lee, Y. C., 2012. Energy Efficient
Distributed Computing Systems, John Wiley & Sons.
ICEIS2014-16thInternationalConferenceonEnterpriseInformationSystems
360
