
A Simple and Generic Interface for a Cloud Monitoring Service
Augusto Ciuffoletti
Dipartimento di Informatica — Universit
`
a di Pisa, Pisa, Italy
Keywords:
Cloud Monitoring, Open Cloud Computing Interface (OCCI), RESTful Service, Cloud Ontology, Cloud
Interoperability.
Abstract:
The paper addresses the definition of an ontology for cloud monitoring activities, with the aim of defining a
standard interface for their configuration. To be widely adopted, such ontology must be extremely flexible,
coping with a wide range of use cases: from the minimalist plug-and-play user, to the one governing a complex
infrastructure.
Our work is based on the Open Cloud Computing Interface, that is an open, community driven OGF standard
allowing boundary-level interfaces to be built using RESTful patterns over HTTP. Among others, OpenStack
and OpenNebula adopt OCCI.
Using the OCCI ontology we define two kinds that are associated with the basic components of a monitoring
infrastructure: the collector link, that performs measurements, and the sensor resource, that aggregates data
and undertakes actions.
This paper is a compact and self-contained revision of a document currently under discussion inside the OCCI
community.
1 INTRODUCTION
In the current terminology a Cloud is a collection
of resources that are dynamically provisioned to a
user: see for instance the NIST definition in (Mell and
Grance, 2011). Whenever the task such resources are
involved in becomes critical, for any of the many rea-
sons and ways a computing task may become critical,
the user wants to evaluate its performance: the NIST
definition referenced above is explicit about this fact,
and indeed a growing attention is paid to the topic of
cloud monitoring.
The purpose of cloud monitoring is to extract
quantitative performance evaluations of cloud re-
sources in the form of metrics. During the operation,
cloud monitoring produces measurements, that are in-
stances of given metrics.
The measurements produced during monitoring
are used for several reasons. Among them:
• Fault Treatment — historically this is the main
purpose for resource monitoring. However a
Cloud Computing environment gives a differ-
ent perspective, since hardware failures now are
softly coped with by the cloud provider (VMware,
2007). Fault treatment is still needed for marginal
conditions that damage the application while be-
ing admitted by the Service Level Agreement
(SLA) stipulated with the provider;
• Billing — the provider expects a revenue that is
related with the amount of resources consumed by
the user. A billing rule that is adherent to the ef-
fective use, and not to the reserved resources, is
more effective from both the user and the provider
side: the user pays only for what it uses, and the
provider has further optimization margins;
• Service Level Agreement Verification — the user
that signs a service level agreement with the
provider wants to be able to verify that the ser-
vice meets the terms of the contract. The provider
that meets this demand increases its credibility;
• Quality of Service Implementation — the user
that implements a service in the cloud may want
to ensure a given QoS whose terms are different
from the SLA signed with the cloud provider: the
availability of resource performance metrics en-
ables the user to undertake actions to ensure the
QoS.
The above non-exhaustive taxonomy justifies the
claim that the monitoring activity deeply depends on
user needs: the provider is in charge of making avail-
able the resource measurement tools, but the user is
143
Ciuffoletti A..
A Simple and Generic Interface for a Cloud Monitoring Service.
DOI: 10.5220/0004940901430150
In Proceedings of the 4th International Conference on Cloud Computing and Services Science (CLOSER-2014), pages 143-150
ISBN: 978-989-758-019-2
Copyright
c
2014 SCITEPRESS (Science and Technology Publications, Lda.)

left the final word about their configuration to meet
specific use cases.
This paper aims at the definition of an ontology
for the domain of cloud monitoring, thus defining the
contents crossing the interface between the provider
and the user, in view of the definition of a widely ac-
cepted standard.
In the next section we give a taxonomy of use
cases, and then we explore the monitoring tools cur-
rently offered by a selection of cloud providers.
2 AN ONTOLOGY FOR CLOUD
MONITORING
The monitoring of cloud resources is a complex task,
and many entities contribute to its unfolding. It is
therefore appropriate to identify a limited set of fun-
damental concepts — an ontology — that helps the
coordination among the involved parties. This ap-
proach has been already adopted in cloud computing
(Youseff et al., 2008; Di Modica et al., 2012; Bern-
stein and Vij, 2010), and it is tightly related with in-
teroperability and service discovery.
We first observe that the final user of measure-
ments does not always identify with the user of the
monitored infrastructure. We distinguish three alter-
natives:
• the user of resource measurements is the cloud
provider. In this case monitoring is directed ei-
ther to billing purposes using raw usage metrics
on real hardware resources, or to implement a Ser-
vice Level Agreement,
• the user of resource measurements is the cloud
service end-user. In this case the user is mostly
interested in checking Service Level Agree-
ment Compliance, or in the implementation of
application-specific resource optimization,
• the user of resource measurements is a user that,
in his turn, provides critical services based on
resources leased by another provider. The case
is similar to the above, but with a number of
challenging variants since the measurements may
come from dynamically provisioned virtual re-
sources from both a private and public clouds.
The way raw measurements are processed before
being delivered introduces further variance in the sce-
nario: resource performance is usually expressed as
a multi-dimensional metric, while an aggregate uni-
dimensional metric, tailored for a specific application,
is more appealing for the user. For business related
reasons, also the provider prefers to expose an aggre-
gated metric, instead of a fine grain set of raw metrics.
An example is the measurement of network per-
formance in an IaaS cloud, since performance mea-
surements should be dynamically configured on de-
mand, depending on a changing user activity: the
provider has to figure out the filters to be applied to
networking devices so to select and measure relevant
traffic characteristics.
The description of resource monitoring capabili-
ties becomes relevant when it is considered as a part
of the provided service, considering the monitoring
infrastructure itself as a leased resource. Its descrip-
tion should cross the same interface used to convey
the description of the service.
There are currently a lot of such interfaces, which
is one of the problems a potential cloud user finds on
his way. Cloud providers want to make their services
more attractive, and thus they design straightforward
interfaces for their specific provision. Such an ap-
proach tends to fragment the access to cloud services
into a number of narrow, vendor-specific interfaces:
let us explore the offer.
2.1 Cloud Monitoring in the Market
The majority of cloud providers offer resource mon-
itoring as part of the provided service: at a point in
time, the user may decide to subscribe to an additional
service that reports measurements or that undertakes
actions based on the monitoring activity.
The AWS monitoring service is named Cloud-
Watch. It is available for all of the AWS resources,
like compute resources, various forms of database and
storage facilities, and other infrastructure components
like queues and load balancers. In total, more than
one hundred metrics are available. The typical fre-
quency is of one measurement every 5 minutes, but
periods as low as 1 minute are allowed. One no-
table fact is that, among the available metrics, there
is the financial cost of the cloud provision. The mea-
surements may be directly used to trigger compensat-
ing actions in a closed control loop, or they may be
presented for human inspection. To improve flexibil-
ity, AWS allows the user to perform custom measure-
ments, and to submit them as an input to CloudWatch,
for instance to shut down an unused resource.
AzurWatch solution has a typical period of one
hour, and around twenty metrics are offered on the
various components of a cloud provisioning, that are
either used as a trigger for elastic behaviors, or di-
rectly presented.
RackSpace approach consists of providing a soft-
ware package that implements a Monitoring Agent.
Once installed on a compute instance in the cloud, it
is able of producing measurements from that server.
CLOSER2014-4thInternationalConferenceonCloudComputingandServicesScience
144

The user controls which measurements are collected
and how they are used through a management page,
which is embedded in the cloud management inter-
face. In addition, measurements feed automatic actu-
ators represented with checks: for instance, one check
consists in sending a series of ping to an IP address
and reporting problems by email.
Private cloud platforms may live without a struc-
tured way to deal with monitoring: for instance, the
open cloud computing platform OpenStack does not
provide a structured solution, but its open source na-
ture lets the user free to implement a custom solution.
In contrast, OpenNebula offers both a nuts and
bots solution based on software probes that push mea-
surements to the cloud monitoring front-end, and a
closed loop mechanism, that implements automatic
scaling decisions based on measurements. OpenNeb-
ula offers also a less scalable pull mechanism based
on the same software probes.
A totally different approach consists of the pro-
vision of a stand-alone monitoring service. For in-
stance, StackDriver provides an agent that is in-
stalled on the user premises to monitor cloud re-
sources: it is designed to inter-operate with the
monitoring services offered by AWS and RackSpace
clouds. The Stackdriver dashboard integrates the
know-how that helps the user to design an effective
analysis of the measurements, thus obtaining sensi-
tive and reliable alarms.
CompatibleOne is a project that follows a simi-
lar approach, and aims at providing the widest pos-
sible compatibility with existing cloud computing
platforms: a unique tool to interact with all major
providers. Therefore they embed in an interface the
tools to describe a monitoring framework, that envi-
sions the presence of a specialized monitoring agent
coordinating the monitoring probes activity.
After this partial overview, we understand that
there are a lot of ways to provide a cloud monitor-
ing service, which is regarded as a positive symptom
of vitality, and we expect new and innovative ways
to emerge. An attempt to contain them within a rigid
standard would be a mistake, ultimately unsuccess-
ful. On the other hand, the existence of an agreement
about a few relevant aspects allows interoperability,
with all of the advantages that we learned from the
history of the Internet.
The challenge is in finding the balance between
what is specified in the standard, and what is left un-
specified, so that a new service can be both innovative
and complying.
2.2 The OCCI Way to Cloud Standards
The OCCI approach to the definition of a standard
for cloud computing (Edmons et al., 2012) consists
in defining the interface to the service, giving as little
detail as possible to the definition of the service itself.
The interface is defined in a way that is easily imple-
mented with tools that, in their turn, are firmly based
on widely used and accepted standards.
The document that describes the core of the OCCI
standard (OGF, 2011a) lays the foundations, binding
the cloud management interface to be RESTful, ac-
cording with the principles defined in (Fielding and
Taylor, 2002). This gives an HTTP framework to the
interface between the cloud user and the provider, and
restricts the interaction between the two so to preserve
the advantages of the HTTP infrastructure (like prox-
ying, caching etc.). According to the REST paradigm,
the resource with its representation are subject of the
communication between a client and the server.
Besides the core standard, designed to be long-
living as valuable standards need to be, there is a se-
ries of satellite documents, that enrich the core with
the details of a specific interface and provisioning.
One series of standards specifies the language used
to represent entities, i.e. its rendering. At this time,
there are three such renderings: embedded as HTTP
attributes, using the JSON language and, the last to
appear and not yet fully specified, using XML. An-
other series of standards is bound to a specific kind of
cloud provisioning: at this time there is one such doc-
ument that focuses on an IaaS provisioning, defining
entities like compute and storage resources.
The proposal addressed in this document is in the
spirit of defining resource monitoring as just another
kind of cloud service provisioning
1
. Since we use
the OCCI ontology, we summarize the features of the
OCCI API scheme before going into the details of our
proposal.
3 OCCI — AN OPEN CLOUD
COMPUTING INTERFACE
The OCCI working group of the Open Grid Forum
(OGF) has produced the description of an interface
for the description of a Cloud Computing infrastruc-
ture. It representes the front gate of a cloud provider:
the users willing to obtain resources from a provider
1
The concepts exposed in this paper are the basis of a
more technical paper, that can be found browsing the repos-
itory of the OCCI project at http://redmine.ogf.org, in git
branch named monitoring
ASimpleandGenericInterfaceforaCloudMonitoringService
145

need to submit a request that follows a given protocol.
The intent of the OCCI working group is to foster the
convergence towards a widely adopted standard.
Both users and providers have an interest in the
existence of a standard, since its introduction usually
carries a development in the market as well as tech-
nology advances. The ideal place for its development
is not a private enterprise, since it is subject to pres-
sures from the market. A better result is expected
from an independent forum, where the suggestions
coming from industries may meet with the results of
independent research: the OGF, together with other
standardization bodies, played an important role on
this respect, and the OCCI working group is a branch
of it.
The OCCI interface is based on a server that op-
erates following the Representational State Tranfer
(REST) paradigm. According with it, the client and
server exchange messages that contain the descrip-
tion of resources: in this context, the resource is any
concept that admits a formal representation, and its is
not directly related with a computing resource, whose
monitoring is the matter of our investigation.
In a REST framework (Fielding and Taylor, 2002),
the client and the server exchange request and re-
sponse messages that contain representations of the
state of REST resources. In this respect the REST
framework defends a coherent utilization of the
HTTP protocol, against new communication tools
like WebSockets, by introducing four fundamentals
constraints:
• the communication between the client and the
server uses a uniform interface carrying the rep-
resentation of resources
• there is no session-related state in the server, and
each request-response pair is a self-contained op-
eration
• the existence of an intermediate processing of the
messages (like caching) is trasparent
• the client may provide code to extend server ca-
pabilities
The request message contains the indication of an
operation to be performed on the resource: the REST
paradigm indicates four operations that correspond to
the well known HTTP verbs: GET, PUT, POST and
DELETE.
The OCCI interface uses a REST interface to de-
scribe the interaction between the user and the service
provider aimed at the specification of the infrastruc-
ture the user wants to obtain from the server. A great
deal of attention is paid to the structure of the infor-
mation that may be included in the message, and that
describes the operation of infrastructure resources.
According with OCCI proposal, the representa-
tion of a cloud infrastructure is carried out by de-
scribing REST resources represented as instances of
an entity type. An entity instance is characterized by
a unique identifier, but it is otherwise left abstract: it
needs to be related with a kind and to one or more
mixins in order to be fully specified. The kind gives an
entity its basic features, described as attributes. Kinds
are arranged in a tree structure, where each kind is put
into relationship with another higher level one, in a
sub-typing hierarchy.
The OCCI working group has defined two core
kinds: the resource, here intended as an IT resource
2
,
and the link, that represents a relationship between re-
sources. Each core type can be sub-typed in its turn
to take into account the multitude of IT resources and
their relationships, thus generating the kinds hierar-
chy.
The association of a mixin to an entity instance
corresponds to a further characterization of it. A
mixin can be used to bind attributes already defined
by the kind, or to introduce new attributes, like a root
filesystem with a preconfigured OS. Mixins are re-
lated with a many-to-many relationship: in partico-
lar, a mixin can be defined as a tag with an associated
semantic, but no attributes. The UML class diagram
that describes the OCCI model is in figure 1, and its
exhaustive definition is in (OGF, 2011a).
The core ontology is in fact more general than
what strictly needed for the definition of an IaaS
cloud. In a distinct document (OGF, 2011b) the
OCCI working group defines a specialization of the
core model that addresses such task. In a nutshell,
three sub-kinds of the resource kind are defined that
model IaaS resources (Compute, Network and Stor-
age), and two sub-kinds of the Link kind to de-
scribe relationships among them (NetworkInterface
and StorageLink).
In the end, the task of describing a cloud infras-
tructure is carried out in a natural with the instan-
tiation of a number of Compute, Storage and Net-
work resources, configuring them with appropriate at-
tribute values, and interconnecting them using Stor-
ageLinks and NetworkInterfaces links. Appropriate
mixins are associated to those entities that need fur-
ther specification.
Note that the hierarchical nature of kinds and
mixins allows the user to discover the capabilities of
a provider: for instance, the availability of a Celeron
2
in this document the term resource is used in two quite
different but close meanings: one is the content addressed
with an URI, as defined in sec. 1.1 of (Berners-Lee et al.,
2005), the other is the representation of a cloud resource. To
disambiguate we use the term REST resource for the former
CLOSER2014-4thInternationalConferenceonCloudComputingandServicesScience
146
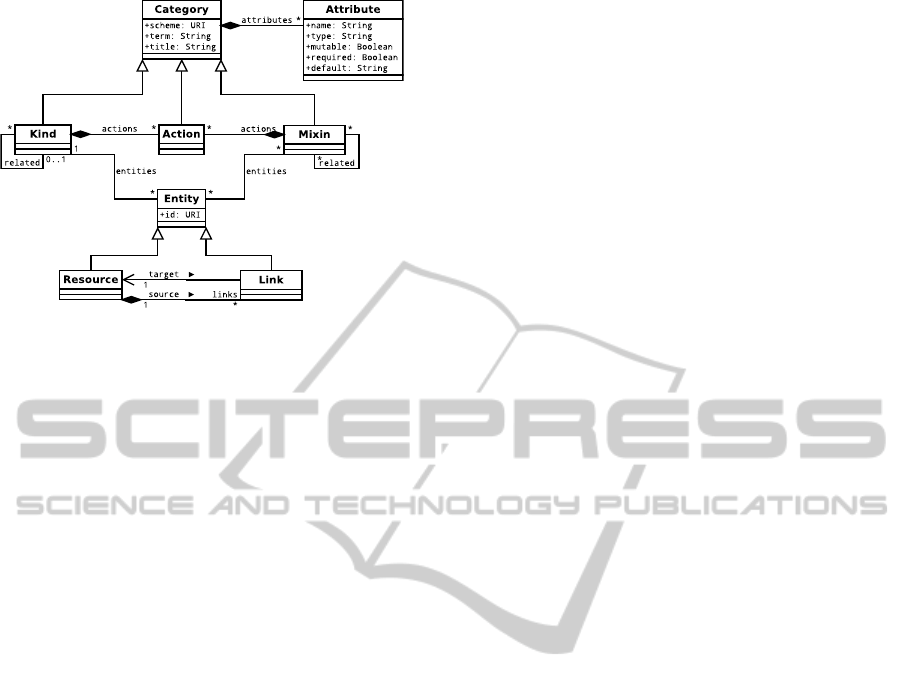
Figure 1: The OCCI core model – A UML class diagram
Copyright
c
Open Grid Forum (2009-2011). All Rights
Reserved.
CPU might be discovered browsing the mixins that
can be associated with a Compute entity. In fact,
a provider may define provider-specific mixins, thus
leaving the overall structure open to unlimited exten-
sion.
All operations involved in the instantiation of En-
tities in the above scheme are carried out using the
basic HTML verbs: once a system is populated with
Entities, it can be browsed using associations. For
instance, the discovery of available resources is im-
plemented with a GET /-/, while the instantiation of
new entities is obtained with a POST. The descriptions
of the available mixins is learned using the above dis-
covery mechanism, and mixin instances are associ-
ated to Entity instances using POST requests.
The next step is to introduce an OCCI extension
to describe a monitoring infrastructure.
4 DEFINITION OF A
MONITORING
INFRASTRUCTURE USING
OCCI
In our view, a monitoring infrastructure can be de-
fined as a service using an extension of the OCCI
core model: this approach follows the one used to
define an IaaS in the OGF document (OGF, 2011b).
The adherence to the OCCI model is deemed appro-
priate, since that standard has the favorable proper-
ties of being open, and of being designed to be long-
living. There is no need to introduce a dependency
from the IaaS entities defined in (OGF, 2011b), and so
our monitoring framework may extend to other com-
putational models, different from a plain IaaS.
In a simplistic view, a monitoring capability might
be associated to a generic resource using a mixin de-
scribing the available metrics, in analogy with the
OpenNebula pull mechanism. However this scheme
is able to capture only very simple cases, and it is
unable to model a metric that aggregates several raw
metrics, like the average load of a pool of servers. In
addition, the inclusion of measurements in the render-
ing of a resource introduces scalability issues, since
such attributes are frequently updated, and devoids
caching: it is definitely in contrast with the RESTful
paradigm.
Instead, our option is to introduce a specialized
resource kind, that we call sensor, that embeds the
capabilities of processing and delivering the measure-
ments: it is not directly involved with their produc-
tion. It can be approached to the monitoring agent as
introduced by CompatibleOne and Stackdriver, and
that we successfully adopted in a Grid-oriented re-
search prototype (Ciuffoletti et al., 2003; Ciuffoletti
and Polychronakis, 2007). A single sensor is able to
collect measurements from many sources, and to de-
liver metrics obtained processing the inputs in many
ways.
The user defines across the interface the timing of
the sensor resource, and operational details are de-
fined using provider specific mixins: the definition of
the available monitoring capabilities is thus left to the
provider. This is appropriate since the provider wants
to define monitoring capabilities according with its
own business strategy: as shown in the introductory
overview, each provider has a distinguished one.
We consider that a representative ontology must
be powerful for the demanding user, and simple for
minimal tasks: on one end we want a simple met-
ric (in the values {green, yellow, red}) for a large in-
frastructure moving the complexity in the aggregation
of raw metrics (in Rackdriver style), on the other we
want a raw metric on a single resource (Mb/s on a net-
work interface) (in RackSpace style). A truly generic
ontology must capture both use cases, as well as all
those in between. So we define a designated resource
whose task is to represent and coordinate the monitor-
ing activity.
The next step is the description of the relationships
between the sensor and the resources from which it
receives measurements: it is a way to associate a met-
ric to a (resource,sensor) pair. The link entity is the
tool offered by the OCCI core model for this case.
The metric is thus attached to a link between a sensor
and a generic resource: we call collector the kind of
this link. This solution has the favorable property of
making discoverable the association between sensors
and monitored resources. It can be approached with
Rackspace and CompatibleOne probe.
ASimpleandGenericInterfaceforaCloudMonitoringService
147
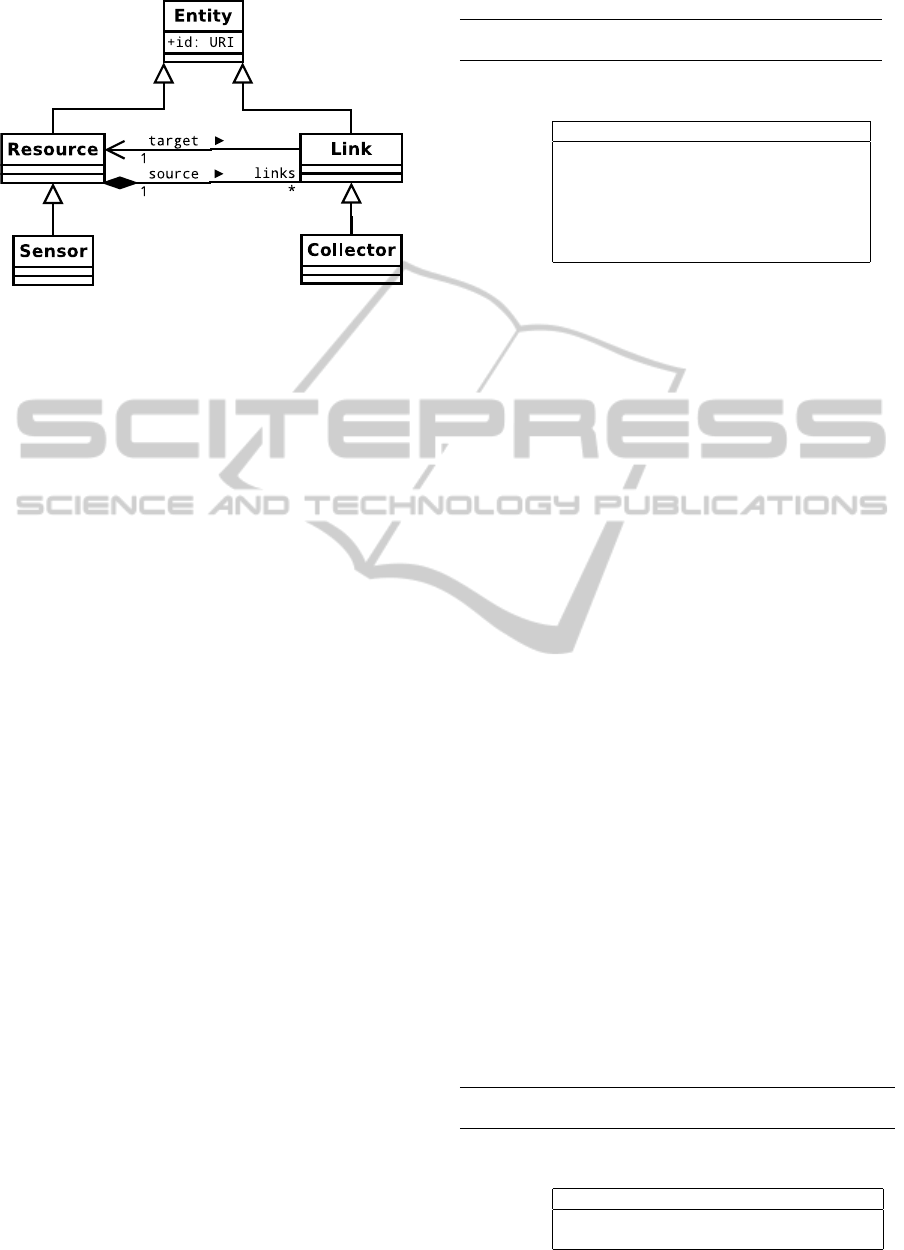
Figure 2: A model for monitoring entities – UML class di-
agram.
Like in the case of the sensor, the generic interface
transfers only the timing aspects of the collector, and
leaves to provider-specific mixins the work of giving
the operational definition of the collector.
The introduction of the sensor and of the collector
subtypes can be described in the UML diagram that is
shown in figure 2.
In conclusion, to introduce a monitoring service in
an existing infrastructure we proceed as follows:
1. we attach an instance of a collector link to each of
the monitored resources, and define the collected
metrics by way of mixins;
2. we define a sensor that receives the measurements
from the collectors and associate processing and
publishing funcionalities by way of mixins;
The approach defined above does not allow a plain
pull mechanism, consisting in a direct access of met-
ric attributes inside the resource description. Such op-
tion has an heavy footprint on the provider, and it is
not RESTful compliant: so we consider this restric-
tion as justified.
With some effort, it is possible to treat very simple
use cases by unifying the monitored resource and the
sensor, so that the two functionalities live together in-
side the same resouce: this is near to the RackSpace
solution. However, the same solution can be repre-
sented in a cleaner way using two distinct entities.
5 DESCRIPTION OF REST
RESOURCES FOR CLOUD
MONITORING
This section is devoted to the description of the two
abstract REST resources in our ontology: the sensor
resource and the collector link.
Table 1: Definition of the Sensor Resource Kind.
Model
attribute
value
scheme http://schemas.ogf.org/occi/monitoring#
term sensor
title Sensor Resource
attributes
name type mut. req.
occi.sensor.period number true true
occi.sensor.periodspec string true false
occi.sensor.timebase number false true
occi.sensor.timestart number true true
occi.sensor.timestop number true true
occi.sensor.timespec string true false
A sensor resource defines the timing of the mea-
surements (see table 1): how frequently measure-
ments are collected, during which time period, the
accuracy and the granularity of the time scale. Any
further specification is left to mixins that describe the
relevant aspects of the sensor, namely:
• the way input metrics are aggregated to produce
an output metric and
• how output metrics are published
To clarify the semantics associated to the two
types of mixin, we describe the role of their attributes.
In the case of the mixins that define the aggrega-
tion function, we have input attributes that bind the
measurements provided by one of the ingress collec-
tors to variables in the aggregation algorithm, and out-
put attributes that bind the results of the aggregation
to a mixin that defines the way they are published.
Other attributes indicate the value to assign to con-
stant parameters used in the aggregation algorithm.
In the case of mixins that describe a publishing
method, we have input attributes that bind the metrics
computed locally or coming from ingress collectors
to items in the communication protocol. The binding
between input and output attributes is implemented
with labels, that are assigned as values to input and
output attributes. The scope of such labels is limited
to the sensor and to the set of input collectors. Ex-
ample of publishing mixins are those that deliver the
measurements through a graphical interface, but also
those that store the data in a database, or that trigger
cloud management activities in a closed loop scheme.
Table 2: Definition of the Collector Link Kind.
Model
attribute
value
scheme http://schemas.ogf.org/occi/monitoring#
term collector
title Collector Link
attributes
name type mut. req.
occi.collector.period number true true
occi.collector.periodspec string true false
CLOSER2014-4thInternationalConferenceonCloudComputingandServicesScience
148
A collector link (see table 2) defines a relation-
ship between a sensor resource and another generic
cloud resource. Like the sensor resource, also the col-
lector link has attributes that define the timing of the
measurement activity. The operation of a collector
instance is further defined by mixins that indicate the
collected metrics. Such mixins are characterized by a
title that is reminiscent of the measured metric and of
the methodology used to perform the measurement.
Other parameters control the application of the spe-
cific methodology (e.g, the length of a ping packet),
and output attributes convey the measurements to the
sensor.
Table 3: The Mixin tags defined for the monitoring API.
Model
attribute
value
scheme http://schemas.ogf.org/occi/monitoring/collector#
term metric
scheme http://schemas.ogf.org/occi/monitoring/sensor#
term aggregator
scheme http://schemas.ogf.org/occi/monitoring/sensor#
term publisher
As seen, mixins for resource monitoring fall into
three categories: those that describe how metrics are
aggregated, those that indicate how they are published
and those that stand for the metrics themselves. To
give a representation of this fact, we introduce three
tagging mixins that are used to apply structural con-
straints that are specific for each set of mixins. The
three tags are defined in figure 3.
These mixins play a fundamental role, since their
semantics define the monitoring that is introduced in
the system. To leave the provider free to define a busi-
ness strategy for the monitoring service, they are left
defined as not fully qualified entities. In this way the
applicability of the proposed ontology is not limited
to the compute/storage/network triad: for instance,
the scheme described above can be easely adapted to
a PaaS infrastructure, where the monitored resource
is a NoSQL repository and the metric is the number
of queries per second.
Finally, we see how to represent a simple mon-
itoring activity that consists of an alarm that sends
an email when the load of a CPU is steadily above
a threshold, using a filter to avoid false alarms.
6 A SIMPLE CASE: ALARM FOR
AN OVERLOADED CPU
The user wants to create an alarm that sends an email
to a given address when the load of a compute re-
source (id=urn:uuid:1111) is steadily over 80%.
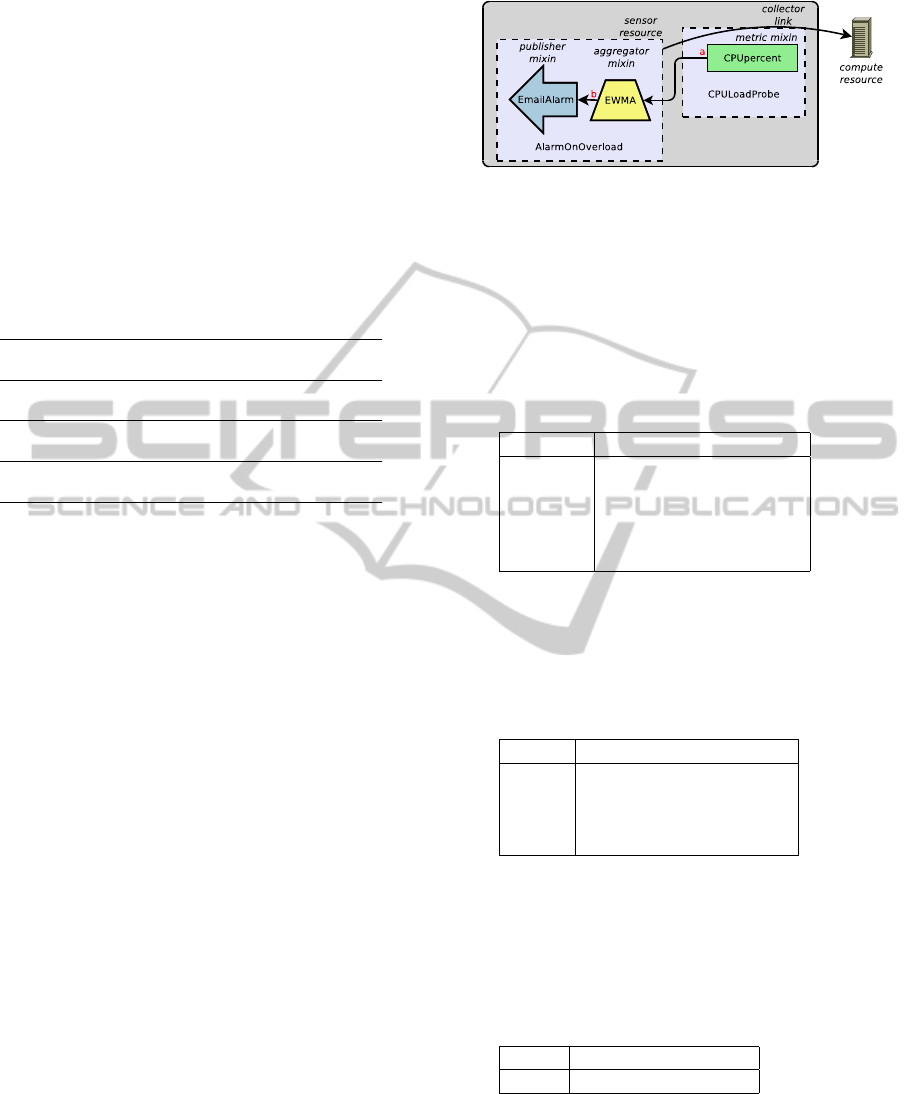
Figure 3: Block representation of a CPU overload alarm.
The check is run evey minute starting ten minutes
from now, and it lasts during one hour.
The block diagram of the alarm is shown in figure
3, and we now explain how the user can incrementally
implement it using the API defined in this paper.
The first step in the workflow is the instantiation of
a blank sensor with the following attributes (optional
attributes are omitted):
name value
title ”AlarmOnOverload”
period ”60”
timebase ”1386925386”
timestart ”600”
timestop ”3600”
AlarmOnOverload sensor attributes
The server returns an id=urn:uuid:2222 for the
sensor. The next step is the instantiation of the collec-
tor link, with timing attributes consistent with those
of the sensor:
name value
title ”CPULoadProbe”
source urn:uuid:2222
target urn:uuid:1111
period ”60”
CPULoadProbe collector attributes
Now the user agent browses the capabilities of the
provider looking for one that measures the CPU load,
and finds the CPUpercent one. The mixin is added to
the CPULoadProbe with a POST carrying the added
attribute:
name value
out a
CPUpercent metric attributes
indicating a label attached to the output stream.
Next the user explores provider’s capabilities
looking for a robust average, an it finds the exponen-
tially weighted moving average inplemented by the
EWMA mixin: three attributes are indicated, respec-
ASimpleandGenericInterfaceforaCloudMonitoringService
149

tively for the gain, the input and the output stream.
The mixin is added to the AlarmOnOverload sensor
with a POST and the attributes are given a value:
name value
gain ”16”
instream a
outstream b
EWMA aggregator attributes
The same is for the EmailAlarm mixin, that has
threshold, input and email attributes. It is posted to
the AlarmOnOverload sensor with:
name value
threshold “80”
email ”myself@example.com”
input b
EmailAlarm collector attributes
The operation, here split in a series of 5 POST op-
erations, can be aggregated in a unique POST, using a
suitable syntax defined for OCCI resources.
The user interface can be simplified by defining a
template that embeds the whole structure, thus allow-
ing the presence of a single button on an hypothetical
graphic user interface. In the same spirit, the email
alarm might be replaced with a WebSocket (Fette and
Melnikov, 2011) connection driving a green/red light
on the graphic user interface.
7 CONCLUSIONS
One conclusion of this work is about the OCCI ontol-
ogy in itself. The fact that the core model can be used
for a purpose distant from the original one (that was
the description of IaaS provisions) confirms that it is
a good standard, potentially stable in time. This is rel-
evant as a guarantee of the return of an investment in
compliance.
Monitoring has recently emerged as a relevant as-
pect of a cloud provisioning. This reflects on the in-
terest for an extension of the OCCI core to express a
monitoring infrastructure, which is the subject of this
paper. Being based on the core model, it is potentially
extensible to applications beyond the current horizon.
In this paper we have validated our ontology with
respect to a number of providers that offer a cloud
monitoring, showing that their services can be de-
scribed using our model. By the time this paper
will be published, an formal XML description of the
model will be available, and we consider the imple-
mentation of a proof of concept prototype.
REFERENCES
Berners-Lee, T., Fielding, R., and Masinter, L. (2005). Uni-
form Resource Identifier (URI): Generic Syntax. RFC
3986 (INTERNET STANDARD). Updated by RFC
6874.
Bernstein, D. and Vij, D. (2010). Using semantic web
ontology for intercloud director ies and exchanges.
In International Conference on Internet Computing
(ICOMP).
Ciuffoletti, A., Ferrari, T., Ghiselli, A., and Vistoli, C.
(2003). Architecture of monitoring elements for the
network element modeling in a grid infrastructure. In
Proc. of Workskop on Computing in High Energy and
Nuclear Physics, La Jolla (California).
Ciuffoletti, A. and Polychronakis, M. (2007). Architecture
of a Network Monitoring Element, volume 4375 of
Lecture Notes in Computer Science, chapter 2, pages
4–14. Springer.
Di Modica, G., Petralia, G., and Tomarchio, O. (2012). A
semantic framework to support cloud markets in inter-
operable scenarios. In Utility and Cloud Computing
(UCC), 2012 IEEE Fifth International Conference on,
pages 211–214.
Edmons, A., Metsch, T., Papaspyrou, A., and Richardson,
A. (2012). Toward an open cloud standard. IEEE
Journals and Magazines, (4):15–25.
Fette, I. and Melnikov, A. (2011). The WebSocket Protocol.
RFC 6455 (Proposed Standard).
Fielding, R. T. and Taylor, R. N. (2002). Principled design
of the modern web architecture. ACM Trans. Internet
Technol., 2(2):115–150.
Mell, P. and Grance, T. (2011). The NIST definition of
cloud computing. Technical Report Special Publica-
tion 800-145, US Department of Commerce.
OGF (2011a). Open Cloud Computing Interface - Core.
Open Grid Forum. Available from www.ogf.org. A
revised version dated 2013 is available in the project
repository.
OGF (2011b). Open Cloud Computing Interface - In-
frastructure. Open Grid Forum. Available from
www.ogf.org.
VMware (2007). Vmware high availability: Concepts, im-
plementation and best practices. White paper.
Youseff, L., Butrico, M., and Da Silva, D. (2008). To-
ward a unified ontology of cloud computing. In Grid
Computing Environments Workshop, 2008. GCE ’08,
pages 1–10.
CLOSER2014-4thInternationalConferenceonCloudComputingandServicesScience
150
