
Multiple Line System for Visualizing and Sharing
Students’ Commitment on the Tablet PC
Keita Muratsu
1
, Hideo Funaoi
2
, Etsuji Yamaguchi
1
and Shigenori Inagaki
1
1
Graduate School of Human Development and Environment, Kobe University, 3-11 Tsurukabuto, Kobe, Japan
2
Faculty of Education, Soka University, 1-236 Tangimachi Hachioji, Tokyo, Japan
Keywords: Visualizing Commitment, Sharing Commitment, Tablet PC.
Abstract: We enhanced and evaluated a system for visualizing and sharing the students’ commitment to multiple ideas
that runs on the iPad/iPad mini. This system has the following two functions: a) the function for the student to
represent his/her commitment to multiple ideas, and b) the function to count the distribution of the students’
commitment. We conducted a science lesson using this system targeting Japanese sixth grade elementary
school students. Students were asked to input their commitment to the ideas each time they conducted an
experiment. Subsequent to drawing the line the second time, the whole class discussed the commitment
situations using the counting function. After the lesson, we investigated students’ impression about the
usability of the system and class discussion using the counting function. The results showed that this system
was quite easy to use and effective in supporting learning that focuses on tracking the process of commitment
change.
1 INTRODUCTION
It has been pointed out that it is important to
visualize and share students’ concept as an external
representation in science education that support
conceptual change (e.g., Duit and Treagust, 2012).
This is because conceptual change is promoted when
students share their own concepts and examine the
differences among them.
Among the representation methods
recommended by the theoretical study of conceptual
change, a model that researchers and teachers
consider promising is the conceptual ecology model
by Posner et al. (1982). It regards conceptual change
as a process of natural selection of multiple ideas
(encompassing theory, knowledge, etc.) that exist
within the intellectual environment. Each student is
considered to have multiple ideas, rather than a
single idea, ranging from the ones higher in the
ecological hierarchy, which have successfully
adapted to the intellectual environment, to those
lower in the ecological hierarchy and facing
extinction. A curriculum aiming to promote
conceptual change in students by using the
conceptual ecology model is required to visualize
and share students’ commitment to multiple ideas
related to the lesson. In the past, a method that
shows the commitment as a line by using pen and
paper has been used (White and Gunstone, 1992).
In recent years, there have been attempts to
display the commitment line on a system instead of
using pen and paper. For example, Funaoi et al.
(2006) and Nakashin et al. (2012) have developed
systems to visualize and share the commitment to
multiple ideas. These systems run on an iPod Touch.
However, since the iPod Touch has an inherently
small screen, its operation is not necessarily easy. In
terms of visualization of commitment, difficulties
have been observed in tracking the process of
students’ commitment change and its reason.
Therefore, in order to overcome the challenges
described above, we developed a system in this
study that visualizes and shares the commitment
running on an iPad/iPad mini, which have become
increasingly popular in recent years. The purpose of
this study is to introduce this system to a science
lesson at an elementary school in Japan, and conduct
a preliminary assessment of its usability and
effectiveness in supporting learning that focuses on
tracking the process of commitment change.
258
Muratsu K., Funaoi H., Yamaguchi E. and Inagaki S..
Multiple Line System for Visualizing and Sharing Students’ Commitment on the Tablet PC.
DOI: 10.5220/0004943302580263
In Proceedings of the 6th International Conference on Computer Supported Education (CSEDU-2014), pages 258-263
ISBN: 978-989-758-021-5
Copyright
c
2014 SCITEPRESS (Science and Technology Publications, Lda.)
2 OUTLINE OF THE SYSTEM
2.1 Development Environment
The development environment for the client side
(iPad/iPad mini) is Xcode 5. The development
environment for the server side is Windows 7
(Professional), Tomcat 6.0, and MySQL 5.5. The
system can run on other operating systems if
equivalent services are available.
2.2 Operation of the System
This System has the following two functions: a) the
function for the student to represent his/her
commitment to multiple ideas (hereinafter referred
to as “the representing function”), and b) the
function to count the distribution of the students’
commitment (hereinafter referred to as “the counting
function”). The representing function is performed
on the iPad/iPad mini operated by each student. The
counting function is performed on the PC operated
by the teacher. The teacher’s PC screen is displayed
using a projector or large LCD TV in the classroom.
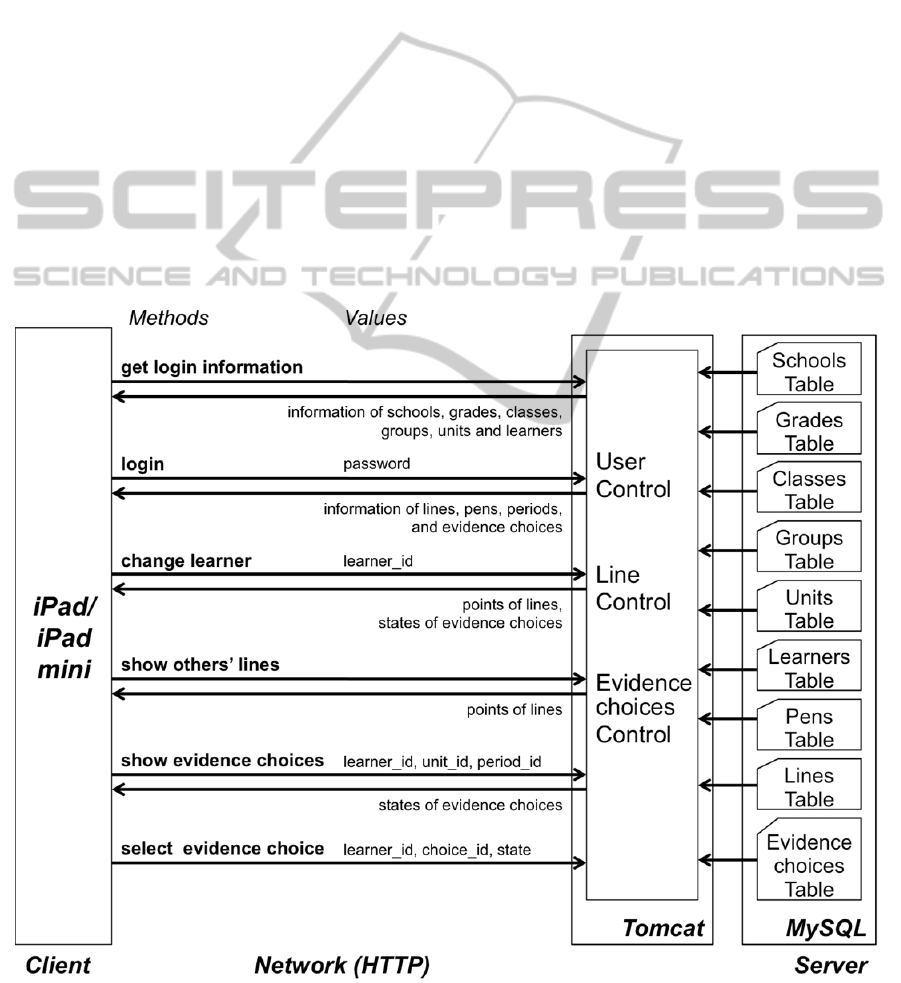
First, we will explain the representing function.
Figure 1 shows the system configuration. Although
it only shows one iPad/iPad mini, multiple devices
can be connected to the server to share the inputted
commitment. Once the System is launched and the
school, grade, class, group, lesson unit, name of the
student, and password are entered, the commitment
input screen is displayed as shown in Figure 2. The
vertical axis represents the level of commitment and
the horizontal axis represents the progress of the
lesson in time. First, tapping the button on the
bottom left corner of the screen shown in Figure 2
will allow you to begin inputting your commitment.
You can specify the level of commitment by
dragging the square cursor up and down, and then
confirm the level by tapping the cursor. Once
confirmed, a line connecting the level of
commitment inputted earlier to the level of
commitment inputted most recently is displayed.
When inputting commitments for different ideas,
Figure 1: The system configuration.
MultipleLineSystemforVisualizingandSharingStudents'CommitmentontheTabletPC
259
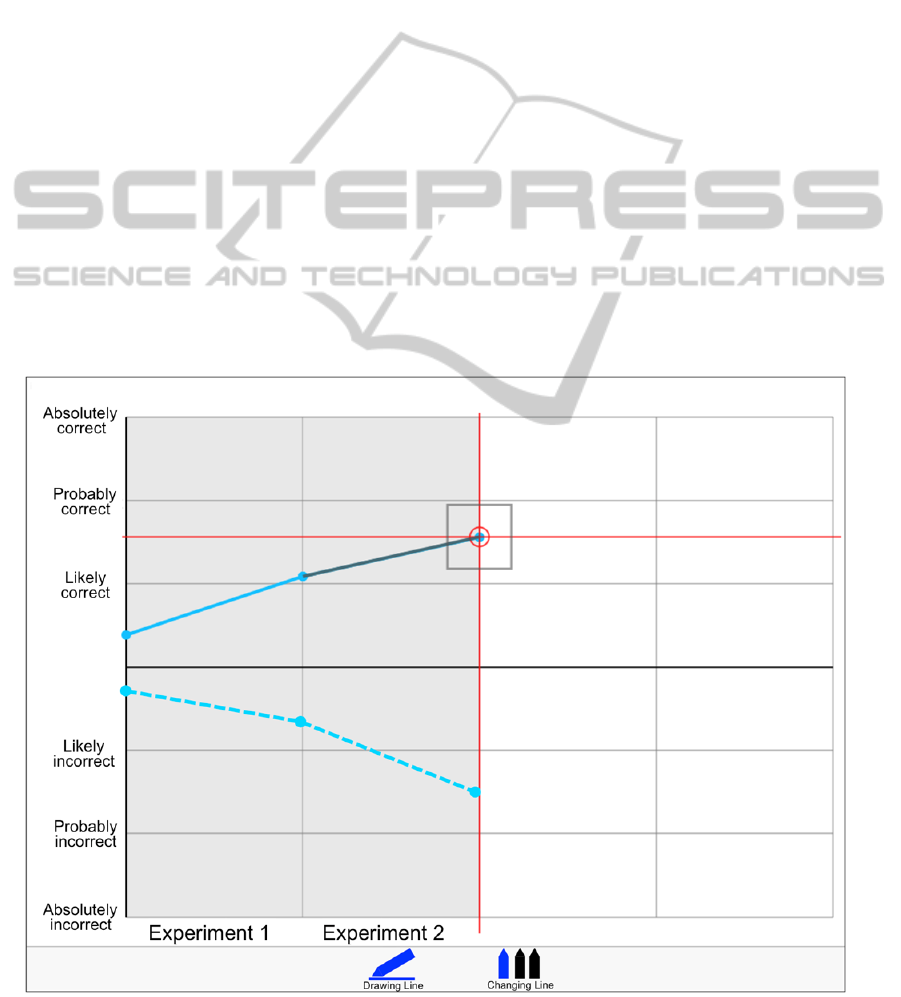
tapping the button on the bottom right of the screen
shown in Figure 2 will display the idea selection
screen for inputting the commitment. The data on
inputted commitment is sent to the server via the
network and then stored in a MySQL Database
through the control unit in Tomcat.
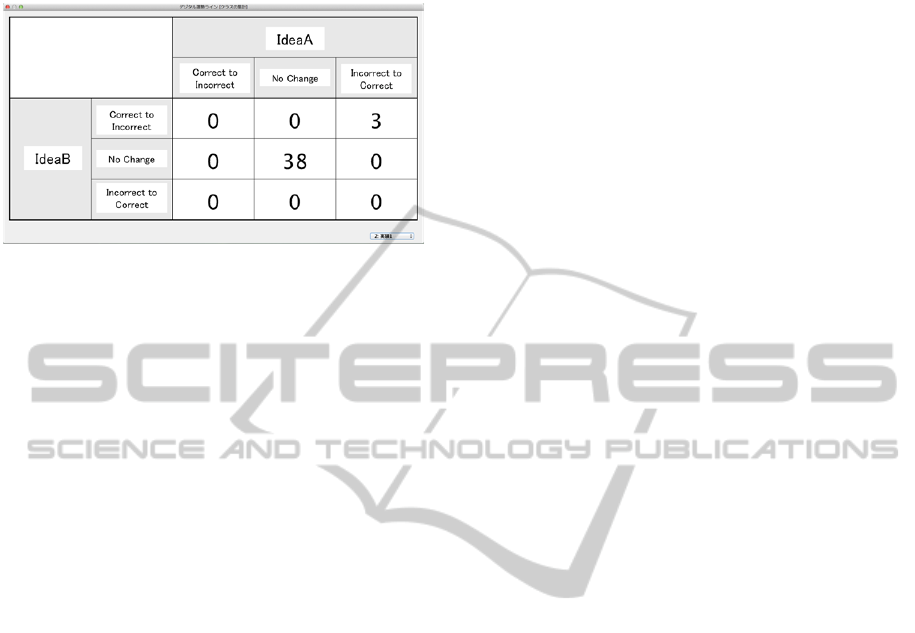
Next, we will explain the counting function. The
counting function features the ability to list
combinations of commitment changes to multiple
ideas. When the request is sent from a teacher’s PC,
the commitment information inputted by students is
read from the MySQL Database and then the
combination of commitment changes to multiple
ideas is displayed. This counting function focuses on
the commitment inputted by students for the second
time among all instances of input. It is possible to
count the number of students who changed their
commitment in the second round of input from
“correct” to “incorrect”, or vice versa and display a
matrix of the commitment change combinations for
two ideas. Figure 3 is the counting function screen.
Here we can see that there were three students who
changed their commitment to Idea A from “incorrect”
to “correct”, and their commitment to Idea B from
“correct” to “incorrect”. The use of this function
allows us to track the process of the change in
commitment to two ideas.
3 EVALUATION OF THE SYSTEM
3.1 Evaluation Method
3.1.1 Purpose
The purpose of the evaluation was to clarify the
following two points: 1) whether the system is easy
for the participants to use, and 2) whether class
discussion using the counting function promotes the
sharing of commitment among students.
3.1.2 Participants
The participants included 40 sixth-grade students
(11-12 years old) at an elementary school in Japan.
They had never used this System prior to this study.
One iPad mini was assigned to every two students
for inputting their commitment. The counting
function was performed on a laptop operated by the
teacher. The teacher, who was certified to teach
Figure 2: The commitment input screen.
CSEDU2014-6thInternationalConferenceonComputerSupportedEducation
260
science, had 15 years of teaching experience. The
PC screen was mirrored on a LCD.
Figure 3: The counting function screen.
3.1.3 Tasks
The evaluation tasks were to investigate the students’
impressions about the usability of the system and
class discussion using the counting function.
3.1.4 Procedure
First, a total of nine science curriculum units (one
unit is 45 minutes) were conducted. The lesson
subject was static electricity. The aim of the lesson
was to change a scientifically invalid idea (“There
are two types of non-conductive objects: those that
become electrically charged, and those that do not,”
referred to by the teacher and the students as the
“Two Types Theory”) to a scientifically valid one
(“All non-conductive objects become electrically
charged,” which was referred to as the “All Theory”)
through hands-on experiments and discussions.
Students were asked to input their commitment to
these two ideas each time they conducted an
experiment. In the first experiment, the students
brought a charged drinking straw, charged paper bag,
and charged plastic ruler into close proximity to a
charged drinking straw. In the second experiment,
they brought several charged objects into close
proximity with a thick enamel wire. The charged
objects were the following: a drinking straw, plastic
ruler, candle, glass rod, and rubber hose. In the third
experiment, they brought a charged drinking straw
into close proximity with several non-charged
objects: a piece of wire, plastic ruler, glass rod,
spring onion, and pretzel snack. The line was drawn
for a total of four times during the science curricular
units. Subsequent to drawing the line the second
time, the counting function screen was displayed on
a large LCD every time the line was drawn, and the
whole class discussed the commitment situations.
After the lesson, an interview survey was conducted
among four randomly selected students regarding
the evaluation tasks. The tasks were performed using
the individual interview method, which took about
10 minutes per person.
3.2 Results
First, we will describe the results of the interview
survey on the usability of the system. Table 1 shows
comments regarding the usability of the system
extracted from the interview survey. S1 stated that it
was possible to quickly draw a line when inputting a
commitment because the drag and drop response
time was good. This is a comment related to the
response speed of the System. S2 commented on the
screen size and the ease of the steps used to draw a
line. S2 said it was easy to draw lines because there
were no unnecessary steps before inputting the
commitment. Regarding the iPad mini’s screen size,
S2 said it was appropriate and pointed out that it
could become difficult to read if the screen size were
smaller than that of iPad mini. Both S3 and S4
mentioned the fact that they were able to get used to
inputting the commitment. They reported it was
because they were able to immediately grasp the
information necessary for operation.
Next, we will describe the interview results about
the counting function. Table 2 shows comments
regarding the counting function. First of all, S1
mentioned a case in which he asked why a few
students changed the commitment that they
supported. S1 said he understood from the counting
function that there were three students who changed
their commitment to All Theory from “incorrect” to
“correct;” consequently, he became interested in
those three students since only a few in the class
made this commitment change, and felt like asking
why they changed their commitment. Next, S2 stated
that from the counting function he understood that
the majority of students did not change their
commitment to All Theory and Two Types Theory,
which made him want to ask each student why their
commitment didn’t change.
This is a comment on a
case in which a student asked why the commitment
supported by the majority didn’t change.
Furthermore,
S3 mentioned a case in which he asked others who
made a commitment change different from his to
express their reason. S3 did not change his
commitment because he thought All Theory was
incorrect at the first opportunity he had to input his
commitment as well the second. However, he said
that it made him want to ask why there were others
who changed their commitment to “correct” in the
second round even though they had thought All
MultipleLineSystemforVisualizingandSharingStudents'CommitmentontheTabletPC
261

Theory was incorrect, as S3 did, when the first
commitment was inputted. Finally, S4 said that he
became eager to hear what others thought when he
noticed there were others who changed the
commitment as he did, because he thought there
Table 1: Comments regarding the usability of the system,
extracted from the interview survey.
S1:
It was nice because when I used the system to
draw a line, it responded well to normal touch
and I was able to draw the line in a minute or so.
S2:
It was easy to use because it is compact, there are
no unnecessary steps to draw a line, and the
procedure to draw a line was easy. The size of the
screen was also just right. I think it would
probably be difficult to read the screen if it were
smaller than that.
S3:
Using this system was really easy, and I
immediately found out what was written where. I
think I also got used to writing on it right away.
S4:
I got used to the steps to draw a line within
minutes because it was easy to draw the line. The
screen was okay to read.
S1:Subject1 / S2:Subject2 /
S3:Subject3 / S4:Subject4
Table 2: Comments regarding the counting function,
extracted from the interview survey.
S1:
Even though there were only three who changed
from “incorrect” to “correct”, I think it was
rather useful because it got me interested in how
people changed their thinking based on this
experiment.
S2:
Because I immediately saw on the screen that
there were many people who did not change, I
thought it would be a good idea to ask each
person what he/she thought.
S3:
I kept thinking that All theory was incorrect. So
when I saw there were three people who changed
from “incorrect” to “correct”, it made me wonder
why they changed their mind, why they thought
All theory was correct, and so on. It just got me
thinking.
S4:
It made me want to ask people who changed their
mind from All theory is “incorrect” to “correct”
their opinions. I wanted to ask because I changed
my mind the same way, you know, and I thought
it might influence my thinking if I heard the
reason why they thought that way.
S1:Subject1 / S2:Subject2 /
S3:Subject3 / S4:Subject4
might be other reasons even though the commitment
change was the same. This is a comment about a
case in which a student asked why others made the
same commitment change.
4 CONCLUSIONS AND FUTURE
WORK
The purpose of this study was to introduce the
system for visualizing and sharing the students’
commitment running on the iPad/iPad mini to a
science lesson at an elementary school in Japan, and
to conduct a preliminary assessment of its usability
and effectiveness in supporting the learning.
First, we will consider the interview results
regarding the usability. The results of the survey
showed the operational effectiveness from the
following four perspectives: 1) the responsiveness of
the screen when inputting commitment is fast, 2) the
steps to input commitment are easy, 3) the
information necessary for inputting commitment is
easy to understand, and 4) visually confirming
information such as words on the screen is easy
because the screen is large. Based on these results,
we found that the System was easy for the
participants to use.
Next, we will consider the interview results
regarding the counting function. The four cases
obtained in the interview survey can be roughly
divided into two categories. The first are cases in
which a student finds other individuals whom he
wants to ask questions based on the population
distribution trends displayed by the counting
function, as in the cases of S1 and S2. There, the
students were interested in the population
distribution that stood out, such as commitment
changes supported by a few students or by the
majority. Therefore, the examination of the
difference in ideas necessary for students’
conceptual change may be promoted. The second are
cases in which, like S3 and S4, a student compares
their own commitment change to other individuals’
commitment changes and finds whom to ask
questions. There, students were interested in others
who made the same commitment change or a
different commitment change. This case may be
more desirable because it may promote the
examination of the differences in ideas, which is
necessary for conceptual change among students,
even more so than in the case of S1 and S2, by
allowing students to compare commitment changes
among others with their own commitment change
for examination.
CSEDU2014-6thInternationalConferenceonComputerSupportedEducation
262

The future tasks include the following two. The
first is to conduct a quantitative analysis of the
usability of the system and the effectiveness of the
counting function in supporting the learning. The
second is to qualitatively analyze comments made
by students and the teacher during the class
discussion that used the counting function.
ACKNOWLEDGEMENTS
This research was supported by JSPS KAKENHI
Grant Number 24300270.
REFERENCES
Duit, R., & Treagust, D. F., 2012. How can conceptual
change contribute to theory and practice in science
education? In Fraser, B. J., Tobin, K., & McRobbie, C.
J. (Eds.), Second International Handbook of Science
Education, 107-118. Dordrecht, The Netherlands:
Springer.
Funaoi, H., Misawa, N., Deguchi, A., Inagaki, S., &
Yamaguchi, E., 2006. Digital Fortune Line System:
For externalizing and sharing learners’ commitments to
learning material. Proceedings of E-Learn 2006,
2823-2828. Honolulu, Hawaii.
Nakashin, S., Yamaguchi, E., Funaoi, H., Murakami, M.,
& Inagaki, S., 2012. Enhancement and evaluation of
the counting function of the digital fortune line system
toward supporting science learning. Proceedings of
E-Learn 2012, 2044-2049. Montreal, Canada.
Posner, G. J., Strike, K. A., Hewson, P. W., & Gertzog, W.
A., 1982. Accommodation of a scientific conception:
Towards a theory of conceptual change. Science
Education, 66 (2), 211-227.
White, R., & Gustone, R., 1992. Probing Understanding.
London: The Falmer Press.
MultipleLineSystemforVisualizingandSharingStudents'CommitmentontheTabletPC
263
