
TweetPos: A Tool to Study the Geographic Evolution of Twitter Topics
Maarten Wijnants, Adam Blazejczak, Peter Quax and Wim Lamotte
Hasselt University - tUL - iMinds, Expertise Centre for Digital Media,
Wetenschapspark 2, 3590 Diepenbeek, Belgium
Keywords:
Twitter, Social Networking Sites (SNSs), Social Media, TweetPos, Geographic Trends, Investigative Tool.
Abstract:
Popular Social Networking Sites (SNSs) like Twitter and Facebook are evolving into crowd-sourced, inter-
disciplinary sensor systems that “monitor” a wide spectrum of (physical) properties and topics. This paper
introduces TweetPos, a web service that is intended to facilitate the analytical study of geographic tendencies
in Twitter data feeds. To oblige the human cognitive features, the TweetPos tool maximally relies on visual
data structures like heatmaps and charts to represent the geo-spatial sources of tweets. The tool compiles data
bodies that grant insight in both past and present tweet posting behavior, incorporates an animation engine
to highlight temporal trends, and leverages layered visualization techniques so that multiple topics can be
offset against each other, all from a geographic perspective. Via the presentation of two representative use
cases, we comprehensively demonstrate TweetPos’ data mining and analytical features and we illustrate the
(geo-spatial) intelligence they can amount to. Thanks to a generic implementation, the TweetPos service is
not geared towards a specific target audience but instead is sufficiently versatile to be valuable for a vast and
varied collection of consumer profiles like social scientists and market analysts.
1 INTRODUCTION
Social Networking Sites (SNSs) were conceived as a
means to virtually connect users and to offer them an
intuitive forum to ubiquitously contribute and dissem-
inate information in real time. As their number of sub-
scribers rose over time, so did the amount of content
that is managed by SNSs. As a result, they nowadays
host a wealth of user-generated data that is highly het-
erogeneous in nature.
Over the years, SNSs have also evolved
functionality-wise. While many such services were
purely text-based upon their inception, they nowadays
typically grant users the option to attach multimedia
items like pictures and video clips to their contribu-
tions. Another feature that has become nearly com-
monplace in the SNS landscape, is geotagging (i.e.,
attaching geographic coordinates as metadata to mes-
sages). It is apparent that such novel facilities embel-
lish the core SNS content and further extend its value.
Given their popularity and broad adoption, it is
becoming evermore valid to regard SNSs as real-life,
real-time and crowd-sourced sensor systems that gen-
erate valuable, highly heterogeneous data feeds (see,
for example, (Sakaki et al., 2010)). Stated differently,
popular present-day SNSs are rapidly transforming
into representative data providers. By intelligently
exploiting the data feeds that can be accumulated
from them, innovative and value-added services can
be conceived. In addition, mining and analyzing the
information that is shared by end-users through social
media can lead to valuable insights and knowledge.
Possible application domains include consumer be-
havior modeling, consumer profiling, intelligent rec-
ommendation systems, and population sentiment as-
sessment. Extracting such kinds of intelligence from
SNSs however typically requires external tools, as
profound mining and analysis mechanisms by default
are lacking from their feature set.
In this paper, we tend to Twitter, the authoritative
microblogging platform in the western world, and we
focus on investigating the data that is hosted by this
SNS from a geo-spatial perspective. In particular, we
introduce the web-based TweetPos tool, a convenient
means to display and study the geographic origin of
tweets, and to uncover the geographical evolution of
the popularity of tweet topics. A hybrid visualiza-
tion method encompassing both heatmap- and chart-
based data representation allows for thorough analy-
sis and mining with regard to the geo-spatial distribu-
tion of tweeted material over time. The TweetPos web
service affords keyword-based topic selection and in-
cludes a layering system that allows for easy compar-
ison of the geographical trends of multiple subjects.
257
Wijnants M., Blazejczak A., Quax P. and Lamotte W..
TweetPos: A Tool to Study the Geographic Evolution of Twitter Topics.
DOI: 10.5220/0004943502570266
In Proceedings of the 10th International Conference on Web Information Systems and Technologies (WEBIST-2014), pages 257-266
ISBN: 978-989-758-023-9
Copyright
c
2014 SCITEPRESS (Science and Technology Publications, Lda.)

Furthermore, our tool is able to compile data sets that
integrate a representative sample of tweets from the
recent past with present-day tweet messages that are
captured in real time, in order to grant insight in both
historical and current tweet posting behavior. Finally,
the accumulated data collections can be aggregated
and studied on either a per-day or per-hour basis to
provide some degree of analytical granularity. We ar-
gue that, combined, these features offer all necessary
measures to perform significant research about the
geographical sources of Twitter data. We will back
this claim by presenting the results of two prototypi-
cal analyses that illustrate the versatility, effectiveness
and comprehensiveness of the proposed instrument.
At the same time, the provided demonstrations serve
as prove of the extensive applicability of TweetPos:
courtesy of its generic methodology, it may one way
or another cater to the demands of a variety of hu-
man investigators, including social researchers, mar-
keteers, analysts and journalists.
A primordial aspect of the TweetPos solution is
its emphasis on providing graphical representations of
the crawled Twitter data. Contrary to computers, the
typical human mind does not excel at handling large
quantities of raw data. On the other hand, our cog-
nitive features make us more adept than computers at
interpreting visual data structures (Pinto et al., 2010)
like heatmaps and charts, which are exactly the output
modalities that are supported by our platform. The
TweetPos tool is hence intended to offer human op-
erators an adequate graphical workspace that allows
them to readily and conveniently assess geo-spatial
trends in social media contributions.
The remainder of this article is organized as fol-
lows. Section 2 presents an overview of the functional
features of the TweetPos web service. Next, Section 3
handles the architectural design and implementation
of the tool. We then evaluate our work in Section 4
by discussing some representative examples of inves-
tigations into the geographical evolution of recently
trending Twitter themes that have been produced with
the proposed tool. Section 5 briefly reviews related
work on the analysis and mining of information that
has been shared via social networks, and at the same
time highlights our scientific contributions. Finally,
we draw our conclusions and suggest potential future
research directions in Section 6.
2 TweetPos
The TweetPos instrument is implemented as a web
service that is accessible via a standard web browser.
Screenshots of the tool’s input widgets are bundled
in Figure 1. As these images illustrate, keywords
or so-called Twitter hashtags are the service’s essen-
tial ingress parameters. Based on the specified topic
of interest, the tool will compile a corpus of tweets
that deal with this subject. This corpus will encom-
pass a representative sample of historical messages as
well as a completely accurate set of current and future
tweets on the topic at hand. The user is hereby granted
the option to apply geographical filtering by limit-
ing the tweet compilation to either Europe or North
America, if so desired (see Figure 1(b)). An identi-
cal filtering option is included in the input pane that
controls the visualization of the accumulated data (see
Figure 1(c)). Finally, a number of standard HTML in-
put elements allow for controlling the temporal con-
straints and the animation of the result set. In par-
ticular, via two HTML sliders and a checkbox, users
can enforce the discrete time interval with which (the
timestamps of) gathered tweets need to comply for
them to be included in the output. Two fixed lev-
els of granularity are supported for the specification
of the temporal constraints, which cause TweetPos
to aggregate filtered tweets per hour and per day, re-
spectively. An animation engine that utilizes either
hourly or daily increments allows for the animated,
video-like presentation of the tweet data set and as
such might yield valuable insights into the geo-spatial
trends that are exhibited by tweet topics over time.
On the output front, the principal GUI element
consists of a topographic map that scaffolds heatmap-
based visualization of the geo-spatial provenances of
filtered Twitter messages. Stated differently, this out-
put component displays the intensity, from a geo-
graphic point of view, of tweets that encompass the
specified input keyword. Besides a map, two addi-
tional output widgets are included in the tool. The first
is a line chart that visualizes the quantitative volume
of the compiled tweet archive, aggregated either on
a per-hour or a per-day basis, while the second enu-
merates the textual contents of the collected tweets.
Figure 2 illustrates the TweetPos output interface.
An important feature of TweetPos is its keyword
layering functionality. The tool allows multiple key-
word filters to be active simultaneously, by conceptu-
ally associating (the results of) each concurrent hash-
tag search with an individual layer. Figures 2(a)
and 2(b) for instance illustrate a setup in which two
queries are involved. Layers are rendered on top of
the topographic map as uniquely colored overlays,
whose visualization can be independently toggled on
and off. Analogously, distinct tweet volumes are plot-
ted in the line graph for each currently deployed key-
word filter. A layer can be eliminated from the visu-
alization process via the legend that is incorporated in
WEBIST2014-InternationalConferenceonWebInformationSystemsandTechnologies
258
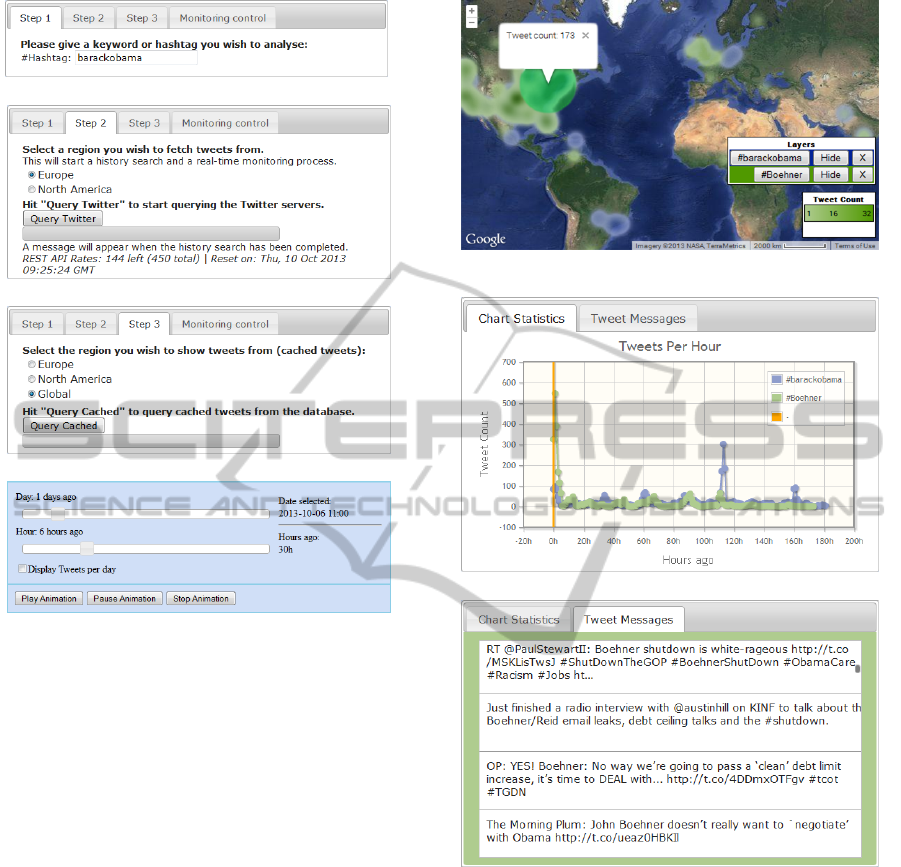
(a) Topic selection.
(b) Geographical filtering.
(c) Geographical constraints specification.
(d) Temporal constraints specification and animation control.
Figure 1: TweetPos input GUI.
the geographic map. The layering system provides a
powerful means to investigate (the geo-spatial evolu-
tion of) multiple subjects concurrently, to offset them
against each other, to reveal potential correlations be-
tween them, and so on.
Apart from temporal filtering parameters, the
TweetPos service also supports the specification of
spatial constraints. This type of constraint is deployed
by clicking on the topographic map, which causes a
circular area to be drawn around the selected loca-
tion (see Figure 2(a)). The map’s zoom level and
the stretch of the marked geographical region have
been designed to be inversely proportional properties,
which implies that the spatial extent of the highlighted
area is controllable by zooming the map in and out. In
effect, installing a spatial constraint under a relatively
high zoom level will result in the selection of a rel-
atively tight geographical region, while the opposite
holds true when the map is heavily zoomed out.
All output components are dynamic, in the sense
that their content is updated on-the-fly when the user
modifies one or more input parameters. Obviously
this applies to the keywords or hashtags that are
searched for. In particular, initiating a new search op-
eration causes an additional layer to be introduced in
(a) Heatmap-based output of tweet locations on a topographic map
(including a spatial constraint specification).
(b) Tweet volume presentation as a line diagram.
(c) Textual contents of the filtered tweets.
Figure 2: TweetPos output GUI.
both the 2D map and the line chart. Responding to
less profound input settings however also occurs in
real time. For example, exploiting the HTML slid-
ers to modify the time constraints causes the map, the
line chart as well as the list of tweet message to be
updated instantaneously. The map will be adjusted
to draw the geographic intensity that applied at the
specified timestamp, the volume plot will be updated
so that it correctly marks the currently selected time,
and the textual list will only display tweet messages
that satisfy the installed temporal restrictions. Analo-
gous actions are dynamically undertaken in reaction
to the definition of a spatial constraint. More pre-
cisely, the volume plot and textual message list only
TweetPos:ATooltoStudytheGeographicEvolutionofTwitterTopics
259

Figure 3: High-level system architecture.
reckon with tweets that originated from the desig-
nated spatial area, if any. This feature allows human
operators to zoom in on certain geographic regions
and to perform fine-grained, localized analyses. As
a final example of the dynamism of the output GUI,
switching between layers via the legend in the topo-
graphic map causes the contents of the textual tweet
enumeration widget to be updated so that it only dis-
plays those messages that apply to the keyword that
corresponds with the currently selected layer.
3 IMPLEMENTATION
The TweetPos implementation is completely web-
compliant. HTML and CSS are used for rendering the
GUI and for handling page layout and style, while all
programmatic logic is scripted in PHP and JavaScript
(at server and client side, respectively).
Our motivations for realizing the TweetPos appli-
cation as a web service are manifold. First of all,
selecting the web as deployment platform acknowl-
edges the pervasiveness of the Internet in modern so-
ciety. At the same time, it renders the TweetPos func-
tionality available on all environments and devices
that support widespread and standardized web tech-
nologies, which maximizes the portability of our im-
plementation. Finally, numerous utility libraries and
supportive tools exist for the web, which we have
gladly leveraged to expedite the development process.
3.1 Architectural Design
A schematic overview of TweetPos’ architectural
setup is given in Figure 3. TweetPos adopts a
client/server network topology. The back-end HTTP
server forms the heart of the system; it interfaces
with Twitter, implements the data filtering and com-
pilation, hosts a relational database (RDBMS) for
data persistence purposes, and responds to incom-
ing HTTP requests. The client on the other hand is
very lightweight, as its responsibilities are limited to
user interfacing and data visualization. As such, the
server (and the RDBMS which it encapsulates) forms
a level of abstraction in the TweetPos system archi-
tecture between respectively the external information
source (i.e., Twitter) and the client-side presentation
of the disclosed data.
3.2 Twitter Data Collection
Twitter provides multiple HTTP-based APIs to en-
able third-party software developers to interface with
the platform and to build socially-inspired applica-
tions. The TweetPos tool exploits two of these APIs
in order to harvest both historical and up-to-date (pub-
lic) Twitter data. First of all, the Twitter Search API
(which is embedded in the Twitter REST API as of
version 1.1) is leveraged to compose a non-exhaustive
yet representative sample of tweets from the past 7
days that dealt with a particular subject. The quanti-
tative incompleteness is intrinsic to Twitter and rep-
resents a deliberate strategy in the platform’s design
(Twitter Developers, 2013). In effect, the Search API
has been designed for relevance and not complete-
ness, which implies that it is not intended to deliver
a rigorous index of past tweets. The second Twitter
interface that fuels TweetPos’ data collection proce-
dure is a low-latency gateway to the global stream of
tweets, called the Streaming API. This particular API
allows developers to set up a long-lived HTTP con-
nection to the Twitter back office, over which tweets
from that moment on will then be streamed incre-
mentally. In combination with extensive filtering and
querying mechanisms, applications in this way ob-
tain near-real-time and exhaustive access to exactly
the type of tweets they are interested in. To facilitate
the interaction with the Twitter Streaming API, the
TweetPos tool integrates the 140dev Streaming API
framework (140dev, 2013).
For the sake of comprehensiveness, we will now
describe the complete set of actions and operations
that constitute TweetPos’ data ingestion pipeline.
When a user initiates a new data collection process
by transmitting a keyword-based query to the Tweet-
Pos server, the latter will spawn a total of seven PHP
daemons. Each of these background processes utilize
the Twitter Search API to jointly compile a pool of
relevant historical tweets that were contributed dur-
ing the past week (i.e., one process per day). At
the same time, the back-end server manages a (PHP-
based) daemon that permanently monitors the Twitter
Streaming API. As an end-point is only allowed to
set up a single connection to the Streaming API, this
background process runs a cumulative filter to guaran-
tee that all present and future tweets that satisfy one
of the currently active queries are captured. In con-
trast to the Search API daemons, which have a finite
execution time and are query-specific, the Streaming
API process runs indefinitely and is shared by queries.
WEBIST2014-InternationalConferenceonWebInformationSystemsandTechnologies
260

A dedicated widget in the client-side GUI empowers
users to stop the real-time monitoring of a particular
topic (which is enforced by updating the cumulative
filter of the Streaming API daemon).
3.3 Data Storage and Processing
Fetched tweets are persisted at server side in a
MySQL database. To streamline the integration of
the 140dev framework in the TweetPos tool, we
have opted to integrally adopt its cache architecture
and accompanying database schema. The caching
mechanism of the 140dev framework applies a two-
step approach. An aggregation step continuously fil-
ters JSON-encoded tweet data (including the actual
message and all sorts of metadata) from the Twit-
ter Streaming API and inserts the resulting data di-
rectly into a designated caching table in the back-end
database. In effect, this task is fulfilled by the Stream-
ing API daemon that was mentioned in Section 3.2.
Simultaneously, an independent background process
successively pulls single raw JSON items from this
table, parses and conveniently formats the composing
entities of the corresponding tweets (i.e., the textual
message itself, the encapsulated hashtags and men-
tions, etcetera), and distributes the outcome across
dedicated database tables. By isolating the aggre-
gation from the parsing of relevant tweets, real-time
and lossless data ingestion is guaranteed (the Twitter
Streaming API might yield tremendous quantities of
data, whose sheer volume might prohibit on-the-fly
parsing and processing).
Besides leveraging the 140dev caching methodol-
ogy and database schema for the Streaming API con-
text of the TweetPos tool, we have decided to extend
their application to the Twitter Search API component
of our implementation. This entails that historical
tweets that are harvested by the Search API daemons
are just as well cached in raw JSON format and then
parsed by the same process that also handles Stream-
ing API contributions. The beneficial implications of
this design are that it yields a clean software architec-
ture, ensures uniform treatment of tweets originating
from heterogeneous sources, and enables the elimina-
tion of data duplication in an integrated manner (i.e.,
without requiring an exogenous control loop).
Once the data collection procedure for a particu-
lar keyword-based query has been initiated, all client
requests that are related to this query are handled at
server side by means of pure RDBMS interactions.
As an example, the execution of adequate SQL state-
ments suffices for the server to be able to forward an
up-to-date overview of Twitter data pertaining to the
queried topic to the client.
3.4 Geocoding
As the TweetPos tool is chiefly concerned with the
geo-spatial provenance of tweets, it is clear that geo-
graphic metadata plays a primordial role in its opera-
tion. To be more precise, geographic coordinates are
needed in order to pinpoint a tweet on a topographic
map. Some Twitter users include these coordinates di-
rectly in their posts (e.g., users with smartphones with
built-in GPS receivers), yet the majority only inserts
a descriptive representation of the involved location
(e.g., in the form of a textual address), or even leave
out all geographic references altogether.
TweetPos’ data accumulation procedure is agnos-
tic of the presence of geo-spatial metadata in tweets.
Stated differently, tweets that lack any trace of ge-
ographical metadata are not filtered out by either
the Streaming API or Search API data compiler.
Tweets holding exact geographic footprints are di-
rectly cached, as they can be readily localized on a
map. In case the tweet only incorporates a descrip-
tive geo-spatial reference, the data processing dae-
mon described in Section 3.3 will invoke the Google
Geocoding API (Google Developers, 2013b) to trans-
late the description into geographic coordinates prior
to database insertion. Finally, although non-localized
contributions are not exploitable in the current imple-
mentation, they are still recorded in the database “as
is” for the sake of completeness (i.e., they may hold
some value in future extensions of the tool).
3.5 Visualization
All visualization and GUI interaction operations are
performed at client side by means of HTML and
JavaScript.
3.5.1 Heatmap-based Geolocation Clustering
The topographic output map has been implemented
by means of the JavaScript variant of the Google
Maps API (Google Developers, 2013a). Tweets are
positioned on this map on the basis of the geo-
graphic location from which they were posted. In-
stead of marking (the location of) individual tweets on
the map, a heatmap-based design has been adopted.
Heatmaps are a general-purpose data visualization
technique in which the intensity of data points is plot-
ted in relative comparison to the absolute maximum
value of the data set. Typically, data point inten-
sity is indicated by means of a color coding scheme.
Compared to mashups of discrete markers (which
might easily clutter the map in the case of voluminous
data sets), heatmaps hold the perceptual advantage
TweetPos:ATooltoStudytheGeographicEvolutionofTwitterTopics
261

that, without sacrificing much detail, they are natu-
rally surveyable and interpretable. The Google Maps
JavaScript API has built-in support for heatmap ren-
dering.
3.5.2 Line Graph
While the heatmap at a glance provides users with
an impression of the spatial characteristics of a par-
ticular Twitter topic, it fails to communicate exact
quantitative figures concerning the tweet volume. To
counter this deficiency, the TweetPos tool includes a
line graph visualization that discretely plots, either
per hour or per day, the number of tweets that address
the queried subject(s). As such, it visualizes a pre-
cise overview of the temporal evolution of the pop-
ularity of themes (expressed in tweet quantity). The
line diagram is implemented via jqPlot, a plotting and
charting plug-in for the jQuery JavaScript framework
(http://www.jqplot.com/). The data values that com-
pose the graph are interactive in the sense that they
can be clicked to leap the date selection sliders (see
Figure 1(d)) to the corresponding timestamp.
3.5.3 Tweet Message Enumeration
The TweetPos tool is also able to output the textual
contents of filtered tweets. This output method has
been realized by means of the MegaList jQuery plug-
in (http://triceam.github.io/MegaList/). Like the other
output widgets, it is adaptive in the sense that it dy-
namically adjusts its contents to imposed spatiotem-
poral constraints. This widget is intended to provide
users insight into the context in which the queried
topic is referenced. As such, it allows for accurate,
context-aware classification of tweets based on the
messages they carry. For instance, a tweet about a
certain incident might plead for or, conversely, against
it; by inspecting the textual context, the stance of the
tweet publisher becomes apparent.
4 EVALUATION
This section serves to showcase the capabilities of the
TweetPos instrument by presenting two representative
examples of (geo-spatial) analyses of Twitter content
that have been produced with it. The first test case is
intended to rigorously demonstrate TweetPos’ overall
practicalities and to generally exemplify the data min-
ing options which the tool scaffolds, while the second
example focuses on TweetPos’ layering functionality
and the analytical features it entails. Space limitations
force us to be brief in our discussion, and prevent us
from including additional demonstrations.
4.1 2014 FIFA World Cup Qualifiers
The final two qualifier matches for next year’s soccer
World Cup were played on October 11th and 15th,
2013, respectively. We have exploited the Tweet-
Pos service to investigate the (geographic) resonance
of these matches on Twitter, specifically for Bel-
gium’s national soccer team (which are nicknamed
the “Red Devils” or “Rode Duivels” in Dutch). We
issued a TweetPos data collection request for the
RodeDuivels hashtag on October 13th and kept this
query active until October 19th. Figure 4 shows the
geographic distribution of the tweets that were gath-
ered worldwide in the one hour interval immediately
succeeding the end of the two matches, as well as a
chart-based representation of the tweet quantity that
was harvested during the entire course of the experi-
ment (aggregated per hour). As the query was initi-
ated on October 13th, all tweet data in the result set
that precedes this date was acquired via the Search
API, while tweets with an older timestamp were fil-
tered from the Streaming API.
Analysis of the experimental results yields four
notable observations. First and foremost, the out-
put graph reveals two obvious peaks in tweet vol-
ume. These local maxima coincide nicely with the
Red Devils’ schedule of play. As such, this test
case corroborates Twitter’s capacity to act as a user-
driven distributed sensor system that is able to iden-
tify real-world events (see also Section 5). As the data
collection procedure was started in between the two
matches, this capacity applies to both the Search API
(for events from the recent past) and Streaming API
(for current and future events). Secondly, tweets deal-
ing with the match on October 11th appear to have
originated practically exclusively from Belgium and
its surrounding countries. In contrast, tweets about
the second game exhibit a quasi worldwide distribu-
tion, yet again with a strong concentration in West-
ern Europe. As the first set of tweets was ingested
via the Twitter Search API, this outcome can likely
be attributed to the operational principles of this in-
terface (recall from Section 3.2 that the Search API
aims for relevance, not comprehensiveness). Thirdly,
although their volume is rather marginal, tweets em-
bodying the RodeDuivels keyword were found to
also emerge from non-Dutch speaking countries like
the USA, Spain and Turkey (see the rightmost topo-
graphic map in Figure 4). After inspecting the tex-
tual contents of these contributions (by means of the
tweet message enumeration widget described in Sec-
tion 3.5.3), it became clear that these types of tweets
can roughly be classified into two categories:
• tweets written in Dutch by Belgian citizens (tem-
WEBIST2014-InternationalConferenceonWebInformationSystemsandTechnologies
262
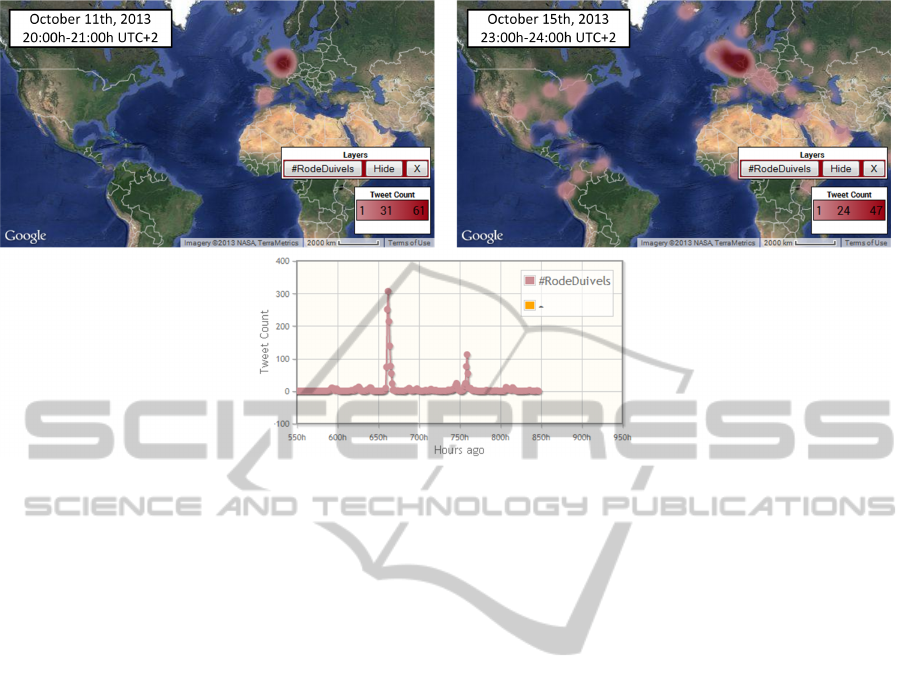
Figure 4: Results of the 2014 FIFA World Cup qualifiers experiment.
porarily) living abroad; e.g., “Come on #Rode-
Duivels, I am rooting for you from my hotel room
in Barcelona!” (English translation)
• retweets by the local population of English mes-
sages that include the (Dutch) RodeDuivels
hashtag; often, the original messages were posted
by Dutch natives who wanted to reach an internal
audience; e.g., “Belgium versus Wales qualifier
starting in 15 minutes #RodeDuivels #RedDevils
#belwal #wc2014”
The fourth and final observation pertains to location-
driven personalization of the tweeted contents. For
example, a tweet by Toby Alderweireld (a Bel-
gian soccer player who plays for Atletico Madrid in
Spain), written in English and communicating Bel-
gium’s qualification for next year’s World Cup, was
actively retweeted by his followers in Spain and
amounted to the majority of RodeDuivels tweets
that originated from that country. A single Spanish
Atletico Madrid fan mentioned not only Toby Alder-
weireld but also his Belgian teammate Thibaut Cour-
tois in his tweet: “Well done to #Atleti’s @thibaut-
courtois & @AlderweireldTob and their #RodeDuiv-
els teammates. We’ll see you in Brazil at #wc2014”.
4.2 Game Console Comparison
The market of (next-gen) gaming consoles is (for the
time being) dominated by Sony, Microsoft and Nin-
tendo with their PlayStation 4, Xbox One and Wii U
hardware, respectively. In this second test case, the
TweetPos tool was put to use to compare the atten-
tion these three consoles receive on the Twitter net-
work, and to uncover geographic dissimilarities be-
tween their respective popularity, if any. Therefore,
between November 1st and November 16th, 2013, the
ps4, xboxone and WiiU keywords were tracked with
TweetPos. An impression of the resulting data set
is given in Figure 5. This figure visualizes the geo-
spatial intensities of the three hashtags on the launch
day of the PlayStation 4 in the USA (i.e., on Novem-
ber 15th between 07:00h and 08:00h UTC-5), as well
as per-hour aggregated overviews of the volumetric
magnitudes of the collected data sets.
These experimental results validate that TweetPos
succeeds in layering multiple heatmaps, each associ-
ated with an independent query, on top of a single to-
pographic map. The same holds true for the tweet
volume plotting functionality of the line chart. Notice
however from the topmost row of images in Figure
5 that keyword visualizations might quickly conceal
one another in multi-layer scenarios, which in turn
is likely to impair analytical efficiency. Courtesy of
TweetPos’ ability to on-the-fly switch the rendering
of individual layers on and off, it nonetheless remains
feasible to interactively compare and interpret (the ge-
ographic provenance of) tweets in multi-query stud-
ies. In effect, the images in the bottom three rows in
Figure 5 communicate exactly the same information
as the ones in the upper row, yet in an itemized fash-
ion.
In-depth analysis of the composed data body falls
beyond the scope of this article. Instead, we will point
out two illustrative insights that we were able to ex-
TweetPos:ATooltoStudytheGeographicEvolutionofTwitterTopics
263
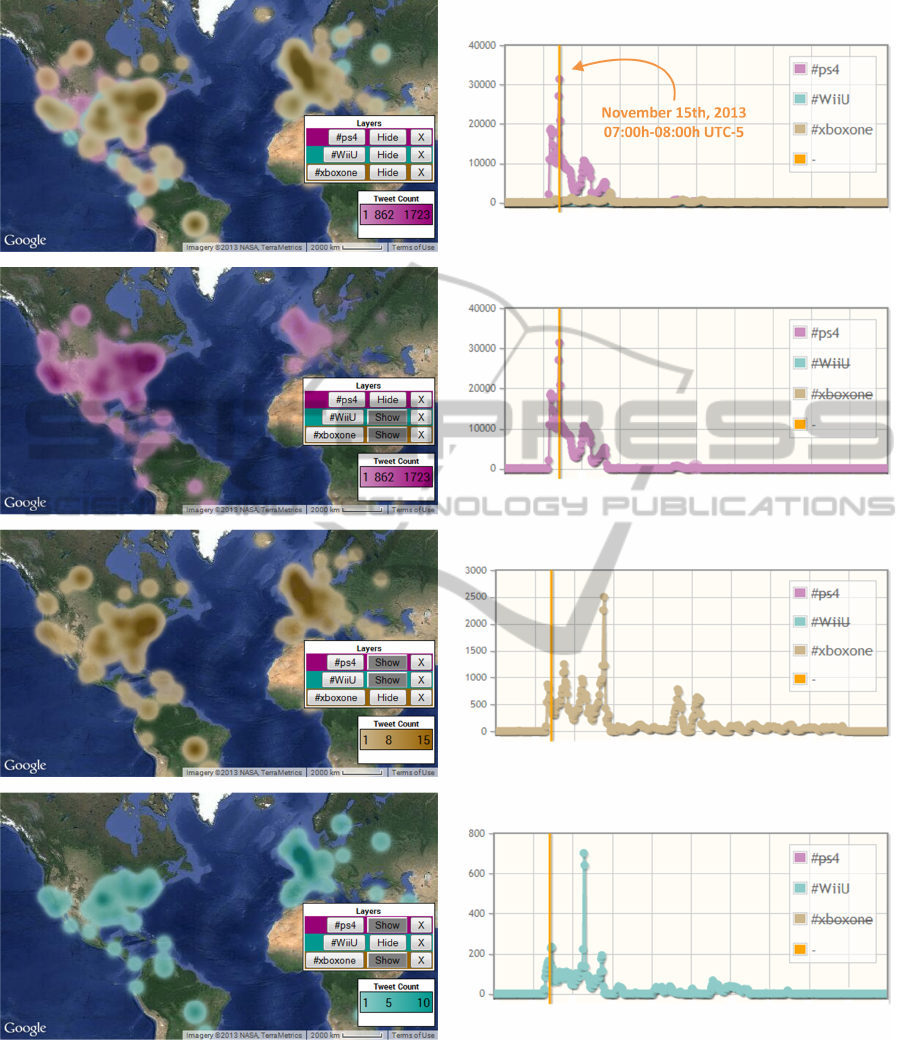
Figure 5: Heatmap-based as well as quantitative comparison of game console popularity.
tract from the collected tweets. Firstly, Figure 5 at a
glance reveals the existence of large quantitative dif-
ferences between the three tracked keywords. In the
monitored time interval, the Wii U console garnered
only a fraction of the attention that the Xbox One was
able to accumulate, whose Twitter coverage in turn
was outclassed by that of the PlayStation 4 by an or-
der of magnitude. The fact that the experiment en-
capsulated the PlayStation 4’s USA release date defi-
nitely contributed to this outcome. In particular, in-
spection of the captured tweet messages confirmed
considerable hype build-up as the PlayStation 4 re-
lease approached. For the same reason, the PlaySta-
tion 4 tweets geo-spatially tended towards the USA.
WEBIST2014-InternationalConferenceonWebInformationSystemsandTechnologies
264

Secondly, the volume diagrams show that Microsoft
was able to pierce the PlayStation 4’s Twitter hege-
mony exactly once in the course of the experiment.
This achievement can be attributed to a clever mar-
keting strategy: by retweeting a message from the of-
ficial Twitter account of Xbox France, users could re-
veal the identity of the French Xbox One ambassador,
an opportunity that was massively seized by fans. The
resulting retweets primarily originated from Western
Europe, and France in particular (not shown in Figure
5).
5 RELATED WORK
The principle of creating map mashups of the geo-
graphic sources of tweets has been considered by a
number of commercialized web services. Examples
include TweepsMap (http://tweepsmap.com/),
Trendsmap (http://trendsmap.com/), Twee-
real (http://tweereal.com/), Tweetping
(http://tweetping.net/) and GlobalTweets
(http://globaltweets.com/). The first maps (the
home location of) the followers of a particular user’s
Twitter account, the second provides a real-time,
localized mashup of currently trending Twitter
themes, and the final three offer real-time geographic
visualization of Twitter posts.
The academic literature also holds a number of ar-
ticles that deal with deriving geo-spatial insights from
Twitter data. Stefanidis et al. have proposed a frame-
work to harvest and analyze ambient geographic in-
formation (i.e., not specified in terms of explicit co-
ordinates) from tweets (Stefanidis et al., 2013). The
iScience Maps tool targets behavioral researchers in-
terested in exploiting Twitter for localized social me-
dia analysis purposes (Reips and Garaizar, 2011). The
global concept of applying Twitter as a distributed
sensor network to identify and locate events in the
physical world has been successfully explored by
a number of analogous research initiatives (Sakaki
et al., 2010; Boettcher and Lee, 2012; Crooks et al.,
2013; Takahashi et al., 2011); of particular relevance
is the social pixel/images/video approach by Singh
et al. that allows for Twitter-powered situation de-
tection and spatio-temporal assessments (Singh et al.,
2010). Field and O’Brien have investigated the appli-
cation of cartographic principles to Twitter-powered
map mashups (Field and O’Brien, 2010). Finally, the
software architecture proposed by Oussalah et al. af-
fords the deployment of geolocated services that are
fueled by Twitter data (Oussalah et al., 2013).
All systems that have been cited in this section,
both commercialized and academic ones, have their
specific merits and feature sets. The TweetPos in-
strument exhibits functional overlaps with all of them.
For example, the social pixel approach largely corre-
sponds with our animated heatmap-based visualiza-
tion solution. Some related tools even provide func-
tionality that is missing in TweetPos. When for in-
stance again looking at the social pixel framework, it
incorporates an automated situation detection scheme
and exploits domain semantics to autonomously rec-
ommend relevant control actions in response to de-
tected events. However, the TweetPos tool exceeds
every cited initiative in terms of the variety of analyti-
cal means it integrates and the synergistic benefits that
stem from this holistic design. As an example, only a
minority of the related systems grants insight in both
historical and current tweet posting behavior. Also,
the combination of a heatmap-based representation of
the geographic intensity of topics, a tweet volume di-
agram, and dynamic means to inspect the textual con-
tents of tweets fosters unprecedented deep mining of
(the geo-spatial evolution of) Twitter contributions. A
final example of a differentiating TweetPos feature is
its layering mechanism and the opportunities in terms
of comparative analysis it unlocks. Only the iScience
Maps tool provides similar functionality, yet its com-
parison options are limited to exactly two configura-
tions; in contrast, unlimited numbers of layers can be
constructed in TweetPos.
6 CONCLUSIONS AND FUTURE
WORK
SNSs have become prominent information channels
in present-day society, as is manifested by the massive
amounts of information that are shared and commu-
nicated through them. Given this quantitative over-
load, human operators benefit from tools that assist
in transforming the constituting raw data into prac-
tical knowledge. This article has proposed Tweet-
Pos, a web service that provides exactly such assis-
tive functions for the Twitter network, hereby allocat-
ing elevated attention to the geo-spatial characteris-
tics of tweets. As the human mind is very adept at
visual pattern recognition and at interpreting graphi-
cal data formats, TweetPos maximally invests in vi-
sual output modalities. The tool integrates and blends
multiple complementary functions in order to yield
a holistic solution for Twitter data analysis. Experi-
mental results collected from two isolated test cases
confirm this claim and prove the feasibility, effective-
ness and added value of our work. In particular, it
has been established that the TweetPos service suc-
ceeds in streamlining the ingestion, filtering, process-
TweetPos:ATooltoStudytheGeographicEvolutionofTwitterTopics
265

ing, analysis and mining of tweeted information, and
as such represents a valuable, highly versatile tool
with cross-disciplinary application options.
Decision making logic, provisions for automated
conclusion drawing and autonomous recommenda-
tion systems have deliberately been omitted from the
current instantiation of the proposed tool, as we be-
lieve these tasks are more suited to human operators
than to machines. As part of future research, we
nonetheless plan to investigate whether the incorpora-
tion of computer-mediated aids might assist users in
executing these actions more efficiently and swiftly.
Potential supportive technologies include visual pat-
tern recognition and edge detection algorithms to fa-
cilitate heatmap analysis, and linguistic processing
frameworks to aid human operators in categorizing
aggregated tweets on the basis of the textual message
they convey. Another trajectory of future work is dy-
namic data delivery. In the current implementation,
all tweet data pertaining to a particular query is trans-
ferred from the back-end server to the web browser in
bulk. Although this design renders the TweetPos ser-
vice highly responsive once all data has been down-
loaded, it also causes start-up delays to be high (i.e.,
they are directly proportional to the data set size).
At the same time, network bandwidth utilization is
suboptimal, as the client is likely to end up down-
loading data which the user will never inspect (or at
least not in detail). We will therefore implement a
demand-oriented transmission scheme in which rele-
vant data is transmitted just-in-time (i.e., when it be-
comes needed). By doing so, we will be able to in-
vestigate the trade-off between service responsiveness
and start-up delay, as well as the impact this balance
has on the usage experience.
REFERENCES
140dev (2013). 140dev Streaming API Framework. On-
line, http://140dev.com/free-twitter-api-source-code-
library/.
Boettcher, A. and Lee, D. (2012). EventRadar: A Real-
Time Local Event Detection Scheme Using Twitter
Stream. In Proc. GreenCom 2012, pages 358–367,
Besanc¸on, France.
Crooks, A., Croitoru, A., Stefanidis, A., and Radzikowski,
J. (2013). #Earthquake: Twitter as a Distributed Sen-
sor System. Transactions in GIS, 17(1):124–147.
Field, K. and O’Brien, J. (2010). Cartoblography: Experi-
ments in Using and Organising the Spatial Context of
Micro-blogging. Transactions in GIS, 14(s1):5–23.
Google Developers (2013a). Google Maps
JavaScript API v3. Online, https://developers
.google.com/maps/documentation/javascript/.
Google Developers (2013b). The Google
Geocoding API. Online, https://developers.
google.com/maps/documentation/geocoding/.
Oussalah, M., Bhat, F., Challis, K., and Schnier, T.
(2013). A Software Architecture for Twitter Collec-
tion, Search and Geolocation Services. Knowledge-
Based Systems, 37:105–120.
Pinto, N., Majaj, N. J., Barhomi, Y., Solomon, E. A., Cox,
D. D., and DiCarlo, J. J. (2010). Human versus Ma-
chine: Comparing Visual Object Recognition Systems
on a Level Playing Field. In Proc. Cosyne 2010, Salt
Lake City, UT, USA.
Reips, U.-D. and Garaizar, P. (2011). Mining Twitter: A
Source for Psychological Wisdom of the Crowds. Be-
havior Research Methods, 43(3):635–642.
Sakaki, T., Okazaki, M., and Matsuo, Y. (2010). Earthquake
Shakes Twitter Users: Real-time Event Detection by
Social Sensors. In Proc. WWW 2010, pages 851–860,
Raleigh, NC, USA.
Singh, V. K., Gao, M., and Jain, R. (2010). Situation Detec-
tion and Control Using Spatio-temporal Analysis of
Microblogs. In Proc. WWW 2010, pages 1181–1182,
Raleigh, NC, USA.
Stefanidis, A., Crooks, A., and Radzikowski, J. (2013). Har-
vesting Ambient Geospatial Information from Social
Media Feeds. GeoJournal, 78(2):319–338.
Takahashi, T., Abe, S., and Igata, N. (2011). Can Twitter
Be an Alternative of Real-world Sensors? In Proc.
HCI International 2011, pages 240–249, Orlando, FL,
USA.
Twitter Developers (2013). Using the Twitter Search API.
Online, https://dev.twitter.com/docs/using-search.
WEBIST2014-InternationalConferenceonWebInformationSystemsandTechnologies
266
