
Finding Reliable People in Online Communities of Questions
and Answers
Analysis of Metrics and Scope Reduction
Thiago Baesso Procaci, Sean Wolfgand Matsui Siqueira and Leila Cristina Vasconcelos de Andrade
Department of Applied Informatics, Federal University of the State of Rio de Janeiro,
DIA/CCET/UNIRIO – Av. Pasteur, 458, Urca, Rio de Janeiro - RJ, 22.290-240, Brazil
Keywords: Recommendation, Suggestion, Specialist, Expert, Helpful, Social Networks Analysis.
Abstract: Online communities of questions and answers became important places for users to get information and
share knowledge. We investigated metrics and strategies that allow the identification of users that are
willing to help and provide good answers in a community, which we call the reliable people. In order to
provide better performance on finding these users, we also raised some strategies for scope reduction. Then,
we applied these metrics and strategies to three online communities of questions and answers available on
the Web, which also provide user reputation grades, so it would be possible to verify the results on finding
the reliable people.
1 INTRODUCTION
Sometimes, seeking an answer for a specific task is
not easy. One can try searching on the Web,
contacting his friends or experts he knows, but in
some situations, the best way is making use of an
online community of questions and answers.
However, one may not get an answer or even get
wrong or conflicting answers, then we are interested
on providing mechanisms for finding people who are
willing to help and provide good answers (usually,
people who have good reputation), which we call
reliable people, in order to improve the results of
these communities. In addition, as processing the
whole community data and profiles can be time-
consuming, we are interested on strategies for
making this task (of finding reliable people) easier.
Due to an increased demand for knowledge in
the organizations and a restrict availability of
resources and competences for fulfil such demands,
several professionals, from industry and academy,
look for specialized knowledge in external sources
in order to solve their problems (Constant et al.,
1996) (Zhang and Watts, 2003) (Wasko et al., 2004).
These external sources usually are Web search
engines, sites or even online communities, in which
people aim at finding solutions for their daily
problems. Alan et al. (2013) argue that online
communities (or online social networks) intended to
support knowledge sharing are effective places for
finding help because of their structure as in general
they are composed of individuals that share common
interests and voluntarily work together for
expanding their comprehension of a knowledge
domain. In general, the members of these
communities do not know each other, may be
identified by pseudonyms and are willing to help
each other for several reasons: altruism, reputation,
expected reciprocity and the learning benefits
(Kollock, 1999) (Lakhani and Von Hippel, 2000).
Online communities that are intended to
knowledge sharing are strongly dependent of their
cooperating members. Through the members and
their participations, the communities grow and, as a
consequence, bigger are the chances of successful
collaborations and better knowledge building.
Yimam-Seid and Kobsa (2003) state the
knowledge sharing is not effective considering only
the knowledge exposed (published) on some
environment. According to the authors, in order to
this sharing be effective, it is also necessary to have
the experts. A written knowledge can be ambiguous
or incomplete. Then, an specialist (or expert) can
help to make clear something that looks dubious at
certain point. In addition, differently from traditional
organizations, in which those with unique and
526
Baesso Procaci T., Wolfgand Matsui Siqueira S. and Cristina Vasconcelos de Andrade L..
Finding Reliable People in Online Communities of Questions and Answers - Analysis of Metrics and Scope Reduction.
DOI: 10.5220/0004954005260535
In Proceedings of the 16th International Conference on Enterprise Information Systems (ICEIS-2014), pages 526-535
ISBN: 978-989-758-028-4
Copyright
c
2014 SCITEPRESS (Science and Technology Publications, Lda.)

specific knowledge about a subject are considered
the experts, the definition of experts in online
communities is much broader in the sense each
member can have some degree of specialization in a
specific area (Ackerman et al., 2002).
The work presented in this paper investigates
how to find people willing to help and provide good
answers (reliable people) in online communities.
Imagine a computer science student who wants to
start a project using Java technology. However, to
this student, Java development is something new.
Then, he has problems when compiling his first
application. With the objective of solving his doubts,
the student first tries to search through a Web search
engine. However, due to his low knowledge level on
Java programming, he does not get satisfactory
results using the search engine. Then, he decides to
look for help in an online community of questions
and answers. Therefore, the student posts his
question and waits for answers.
The process of posting questions in an online
community and waiting for answers is called social
query (Souza et al., 2013) (Banerjee and Basu,
2008). It can be considered an alternative for search
engines. According to Horowitz et al. (2010), some
problems are better solved by people: more
contextualized questions, recommendation requests,
advices or opinions etc. Computational systems can
perform well specific tasks in a known environment
and with few changes. In such a way, search engines
fall short when something more contextualized is
searched. It means that the results from search
engines do not correspond to what is searched in a
specific moment (Fritzen et al., 2013). Huberman et
al. (2013) and Mui et al. (2010) state the
environments of online communities with millions
of users, such as Twitter and Facebook, are good and
effective places to find information through the use
of social query. It happens due to the presence of
several users that increases the chances of getting
some kind of information or response.
However, the use of social query has also some
limitations. When a question is posted in a
community, unexpected results can be found such
as: getting wrong or contradictory answers; keep
getting answers even after the problem was solved;
never getting an answer, since some communities
tend to prioritize the visualization of the most recent
posts (Paul et al., 2013).
It is possible to minimize some limitations of
social query finding people who are more adequate
to answer a question (experts or reliable people).
This way, the online community can guarantee a
posted question can be directed to a group of experts
previously identified. Then, the chances a user gets a
good answer can improve.
Considering this scenario and looking for ways
of minimizing some of the limitations of social
query (wrong answers and no answers at all), we
studied three online communities, looking which
user's attributes can allow to infer he has a high
reputation (i.e., is willing to answer and usually
provides good answers) in the community. In
addition, we analyzed strategies for reducing the
scope of these communities in order to find if there
are smaller parts of the network (or community) in
which the experts can be found in a more effective
way than considering the whole community. The
idea is that identifying these attributes related to the
reputation can be used in different communities such
as those considered in this work, aiming at finding
the experts.
The remaining of this work is organized as
follows: Section 2 presents related works. In section
3 we describe the empirical study on three different
online communities aiming to characterize and
explore the networks. In addition, the results of the
analysis of possible indicators that allow finding the
experts are also presented. Finally, in section 4 we
draw some conclusions and present future works.
2 RELATED WORKS
One alternative to the search engines for solving
problems or doubts are the online communities of
questions and answers such as Stackoverflow, Quora
and Yahoo! Answers, where the users voluntarily
ask and answer questions. However, some people
prefer to post questions only to their friends than
posting to unknown people on questions and
answers communities (Morris et al., 2010).
Morris et al. (2010) presented results confirming
that social query is a good method for getting
answers in an online community. This study was
performed in Microsoft with their own
communication tools. In that work, the authors
concluded that 93,5% of the users had their
questions answered and in 90,1% of the cases, the
users got answers in less than one day. Paul et al.
(2013) performed similar studies on Twitter, but
with different results. They concluded that only
18,7% of questions posted by a Twitter user got
answers. They also concluded the number of
answers received by a user had a positive correlation
with his number of followers. In addition, 67% of
the answered questions in Twitter got answers fairly
fast (in last than 30 minutes). One of the reasons for
FindingReliablePeopleinOnlineCommunitiesofQuestionsandAnswers-AnalysisofMetricsandScopeReduction
527

the low percentage of answers was due to the fact
that Twitter prioritizes the visualization of most
recent posts. Therefore, it is probable that some
followers had not even known about the existence of
a specific question.
Studies for finding the experts in a community
have already been explored in other works on the
scientific community. Some of them focus on
information retrieval techniques with natural
language processing (also known as document-
based) to identify user's competences (Streeter and
Lochbaum, 1988) (Krulwich and Burkey, 1996)
(McDonald and Ackerman, 1996). In this approach,
usually, the texts that are produced in a virtual
environment are represented as a term vector (words
or tokens) with their respective frequency. Then, it is
possible to infer which kind of competence a user
has, based on his discourse. However, the use of the
approach focusing on information retrieval makes
difficult to capture the level of competence of each
user, since it is difficult to judge if a user provides a
good answer only parsing and processing his texts
posted in a community (Zhang et al., 2007).
According to Littlepage and Mueller (1997) this
approach is limited.
Balog et al. (2009) proposed a way for
identifying the experts based on queries executed on
an environment and a collection of texts associated
to the experts candidates. Their work based on
information retrieval techniques and probabilistic
methods aimed at setting the relevance between a
query and the experts candidates. Another similar
work was proposed by Liu et al. (2012). In their
work, a framework automatically generated the
specialized user profiles of a community. These
profiles had information about the user competences
and were built based on the association between the
community topics with the common user profile.
Another approach is the use of ranking
algorithms in graph for finding expert users in a
network. Algorithms were applied on a community
(represented by a graph) and a number was assigned
for each user, representing his competence degree on
some subject. Campbell et al. (2003) and Dom et al.
(2003) used the HITS ranking algorithm on graphs
for finding the experts that composed an email list.
The results of these studies were rousing, since the
approach based on graphs showed effective.
However, these studies had a weakness: the online
network size, which was relatively small and the
results could not reflect the reality. Zhang et al.
(2007) proposed an algorithm based on graph for the
same goal, but applied to a traditional discussion
forum. Although their approach was interesting, the
authors concluded, through the simulations, that the
communities with different characteristics should be
analysed separately because of the characteristics
that can influence the results, then adaptations could
be necessary in the measures or techniques that were
applied. Alan et al. (2013) proposed a new approach
for identifying experts, built a hybrid model based
on the information retrieval approach with the
ranking algorithms on graphs approach.
Banerjee and Basu (2008) presented a
probabilistic algorithm that enabled directing the
questions to the users who were more apt to answer
them. This algorithm worked based on repeated
actions on the network on the past. Davitz (2007)
developed a similar work, in which there was a
global entity (agent) in the system that monitored the
network and decided which users would get
(visualize) a specific posted question through
probabilistic analysis. However, this solution based
on agents was tested only on a small community.
Souza et al. (2013) proposed an algorithm for
finding expert users based on a list of the user's
followers on Twitter. Their idea was to find the
follower with the profile that was more adequate to
answer a question on Twitter. Their results were
interesting because the proposed algorithm was
effective to find experts on Twitter.
In the work described in this paper, we revisited
the approaches based on graph with ranking
algorithms combined with the information retrieval
approach for finding experts in online communities.
The approach is based on graphs because the
communities are represented through a graph, while
based on information retrieval because we extract
metadata (information about the user) from the
communities for making the analysis.
However, we propose a different way of finding
experts that we call “scope reduction”, in which we
make analysis on parts of the network. The proposed
analysis consists on dividing a community on
several components (parts) and analysing them
separately aiming at investigating strategies for
finding experts more easily (with less data and
therefore allowing faster processing). In addition to
these strategies, this work lists some attributes of the
network such as the results of the ranking algorithm
for making possible the strategies of finding the
experts.
ICEIS2014-16thInternationalConferenceonEnterpriseInformationSystems
528

3 AN EMPIRICAL STUDY ON
COMMUNITIES - LOOKING
FOR THE RELIABLE PEOPLE
We conducted empirical studies on three
communities in order to identify the experts with
more confidence. We analysed some users’
attributes that could indicate they are reliable people
(or experts in the social networks). These attributes
were extracted directly from the network (such as
the number of answers or comments) or were
derived through the model that we used to represent
the communities. We investigated such attributes in
order to reach a common strategy that could be
applied to different networks. In this work, we
assume the user with higher reputation is the reliable
person (or the expert).
3.1 Dataset and General
Characteristics of the Networks
For analysing the measures and testing the strategies
for identifying the reliable users, it was necessary to
extract a set of data from real online communities.
We choose three distinct communities of questions
and answers:
Stackoverflow: a community for subjects related
to computer programming;
English Language and Usage: a community
focused on the learning of the English language;
Travel Answers: a community intended for
elucidate doubts on travels.
Usually, people log in, make some question and
quickly get some answer due to the number of users.
In this kind of online communities, the discussions
are structured in threads, i.e. a user posts a question
or topic and soon after that, other users post answers
or comments related to the question. In addition,
each thread belongs to at least one category of the
community (for instance: Java, database, verbs etc.)
and each user is evaluated by other users based on
their posted questions or answers. This evaluation
scheme allows the users to build their reputation on
the network. These three communities have similar
characteristics, although they attract different
participants.
In order to extract data from these communities
we developed a crawler that consumed data from
each community. Through this crawler, it was
possible to get all data from the communities
English Travel and Usage and Travel Answers.
However, as the Stackoverflow community is much
bigger, we extracted only a data sample of it.
The crawler was developed using Python
programming language. A crawler is a program that
systematically browses online systems, typically for
the purpose of collecting data. Our crawler sent
several HTTP requests to each community and then,
saved all returned data in several files. We read all
files and discarded the data not needed in our work.
We were only interested in data related to the users’
participation. Then, we transformed these data in to
two models: class model and graph. The class model
allowed us to extract simple users' attributes (such as
questions and answers) or calculate those which do
not depend on any graph based algorithm (such as
entropy and z-score). The graph model allowed us to
extract measures based on graphs, such as indegree
and the results provided by the Page Rank algorithm.
Afterwards, we evaluated the metrics extracted using
statistical correlation. The measures, attributes and
the evaluation are described in the next sections.
Table 1 shows general characteristics of
extracted data from the network, such as: number of
users, number of messages, number of answers,
number of comments, number of threads (which is
the number of main posts or topics) etc. Through
Table 1, it is possible to notice that Stackoverflow
community is the biggest, followed by the English
Language and Usage and, then, the Travel Answers.
This fact is noticed through the number of
messages, answers, comments, threads and users.
The average amounts of characters of the posts are
similar in the three communities. However, the
average size of a thread is bigger in the English
Language and Usage community. This may show
that this community has bigger (or deeper)
discussions when compared to the others.
3.2 Representing the Communities as
Graphs
In order to make the necessary analysis, we
represented the communities as directed graphs,
following the proposal presented in (Zhang et al.,
2007). In this representation scheme, the graph
nodes represent the users while the edges represent
their interactions. Then, if a user A posts a question
and, the user B answers it, the graph has a node A
representing the user A and a node B representing
the user B. In addition, this graph has an edge that
departs from node A in direction to B, symbolizing
that B answered A. An example is shown in Figure
1. The green arrows (dotted) represent a user posted
a question (topic) and the black arrows (continuous
lines) represent a user answered a question. The
right side of the figure shows the corresponding
FindingReliablePeopleinOnlineCommunitiesofQuestionsandAnswers-AnalysisofMetricsandScopeReduction
529
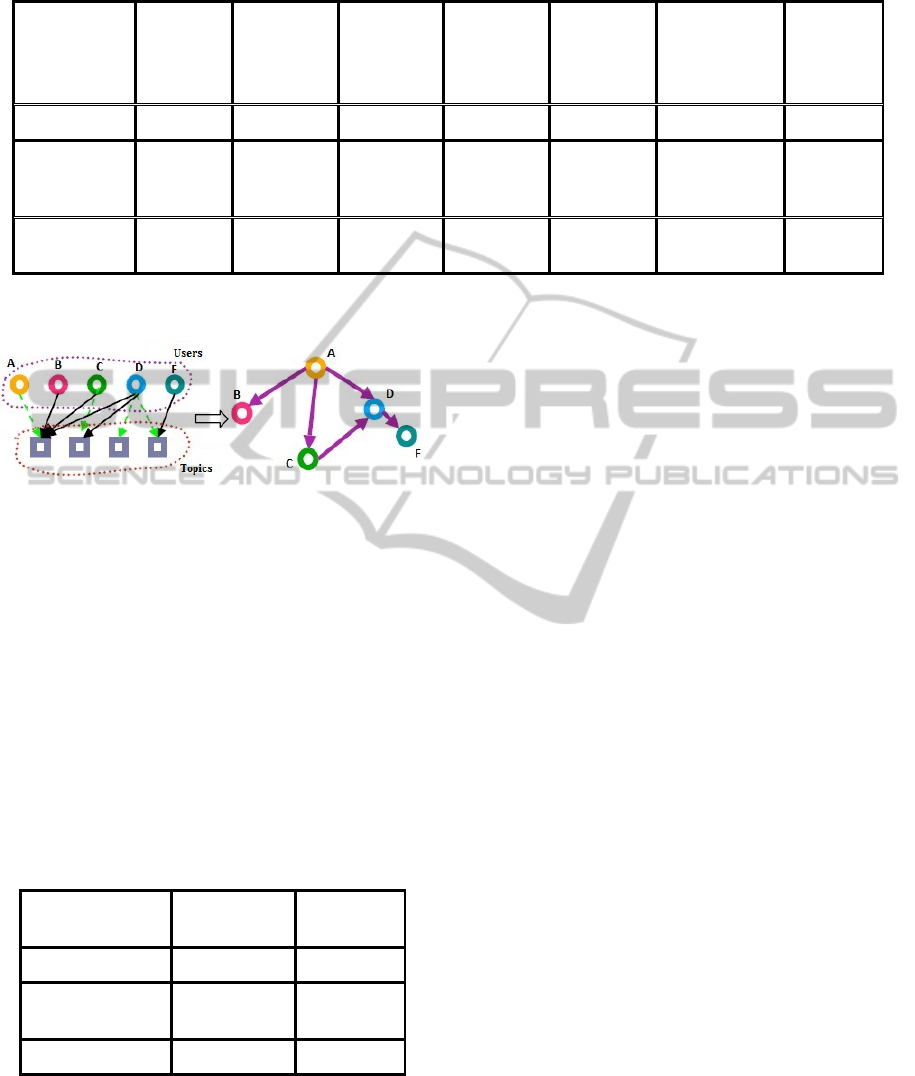
Table 1: General Characteristics of the Communities.
Community
Number of
messages
Number of
threads
Number of
answers
Number of
comments
Average
size of a
thread
Average
amount of
characters /
posts
Number of
users
Stackoveflow 1.000.925 149.269 248.047 603.609 3 270 180.740
English
Language and
Usage
326.915 30.044 79.978 216.893 6 236 20.408
Travel
Answers
42.322 5.529 10.526 26.267 4 275 3.579
graph to this scheme of questions and answers.
Figure 1: Example of a community and its graph.
We extended this model in order to better
represent the interactions among the users of the
communities. As in the analysed communities it is
also possible to comment a question or an answer, if
user X comments a question of user Y, then an edge
departing from the user (node) Y and arriving at the
user (node) X is also represented. Similarly, if the
user Z comments an answer of the user K, then an
edge departing from the user (node) K and arriving
at the user (node) Z is also represented.
The three communities that were analysed in this
work were represented through graphs with the
characteristics presented in Table 2.
Table 2: Data from the Communities Graphs.
Community
Number of
Nodes
Number of
Edges
Stackoverflow 180.740 508.410
English Language
and Usage
20.408 149.993
Travel Answers 3.579 16.792
3.3 The Bow Tie Structure
After representing the network as a graph, it was
possible to use the Bow Tie structure (Broder et al.,
2000), to analyse the communities according to six
distinct components: Core, IN, OUT, Tendrils,
Tubes and Disconnected.
The Core component has the users who
frequently help each other. Considering the graph
representation, the Core components are the strongly
connected nodes of a graph.
The IN component has the users who only make
questions and get answers from some Core member
(i.e., a node that has indegree equals to zero,
outdegree bigger than zero and an edge that departs
from it and arrives at some Core member). Then, the
nodes that compound the IN are those that can reach
some member of Core, but can’t be reached by any
member of Core.
The OUT component contains the users that only
answer questions posted by some member of the
Core component (an OUT member is a node whose
outdegree is equal to zero, the indegree is bigger
than zero and there is an edge that departs from a
Core member and reaches it). Then, the OUT
members can be reached by Core members, but can’t
reach the Core.
The Tendrils and Tubes components are
connected to the IN or OUT components, but are not
connected to the Core. The Tendrils are those who
can be reached by some member from IN and do not
reach the Core or those who can reach some OUT
member and can’t be reached by someone from
Core. On the other hand, the Tubes are those who
can be reached by some member of IN and do not
reach the Core and those who can reach some
member of OUT and can’t reach someone from
Core. The Disconnected are those who do not fit any
of the previous components.
Broder et al. (2000) used the Bow Tie structure
to understanding the Web (two Web crawlers visited
around 200 million pages and 1,5 billion of links
each). The Web was represented by a graph in which
the Web pages were the nodes and the links between
ICEIS2014-16thInternationalConferenceonEnterpriseInformationSystems
530

the pages were the edges. Once having the Web
represented by a graph, Broder et al. (2000) found
out interesting results such as: pages which usually
connect to each other, for example, page A has a
link to page B and B has a link to A (Core
component members), or pages which only have
links to another pages and have never been
referenced by any other pages. Zhang et al. (2007)
analysed a traditional discussion forum through the
use of the Bow Tie structure (considering a graph
with 13.789 nodes and 55.761 edges). Table 3 shows
a comparison of the Bow Tie structure in the Web
(Broder et al., 2000), a traditional forum (Zhang et
al., 2007) and the online communities.
Table 3 shows that the structures of the
communities are different from the Web and a
traditional forum. The Core components from the
three analysed communities are bigger than from the
other networks. Therefore the analysed communities
are places where people are willing to help and be
helped. The Stackoverflow, for instance, is a
community in which a great amount of people
(45,2%) are willing to collaborate. 15,6% of the
users in the IN component, which shows that they
only make questions on the network. On the other
hand, 20,9% are in the OUT and only answer or
comment the topics, i.e., they never made any
question. The English Language and Usage
community has 48,0% of the users in the Core
component, which is similar to the 41,3% of the
Travel Answers community. The IN component of
the communities English Language and Usage
(25,6%) and Travel Answers (28,9%) are fairly
bigger than the IN from Stackoverflow. It means that
in these two communities there are more people
interested in only asking questions and not
answering (or helping) anyone when compared to
the Stackoverflow. The OUT component is similar
in the three analysed communities.
The Bow Tie structure is very important in the
context of this work because its components are
used to investigate the strategies of scope reduction.
Therefore, in this work we analyse each component
of the Bow Tie structure separately, aiming at
seeking evidences of experts. We expected that
analysing smaller structures (components), relevant
results as in the complete analysis of the network
could be provided, then avoiding extra processing
during the execution of the methods of finding
experts in a network.
Table 3: Comparison of the Bow Tie Structure.
Core IN OUT Tendrils Tubes
Discon
nected
Web 27,7% 21,2% 21,2% 21,5% 0,4% 8,0%
Traditional
F
orum
12,3% 54,9% 13,0%
17,5% 0,4% 1,9%
Stack
overflow
45,2% 15,6% 20,9%
6,0% 0,2% 12,1%
English
Language
and Usage
48,0% 25,9% 18,9%
3,1% 0,06% 4,04%
Travel
Answers
41,3% 28,9% 22,6%
3,2% 0,03% 3,97%
3.4 Degree Distribution
The Bow Tie structure is very useful when the goal
is to find the roles of a group of users in a network,
i.e., to capture in a general way the level of
interaction among the users. For detailing the level
of interaction it is possible to use the degree
distribution of a graph, which is a function that
shows the number of nodes of a graph that has a
specific degree. Since we represent the communities
as graphs, the degree of a node represents the
number of people the user has interacted with in the
network (asking, answering or commenting).
There are two types of degree: in and out. The
former is the number of edges that arrive at a node
(representing the number of people the user has
answered) and the latter is the number of edges that
departs from a node (questions posted by the user
that received at least one answer).
The three communities have similar degree of
distribution. Therefore, instead of everybody equally
helping each other, there are few users that are
extremely active and make several questions (a high
outdegree), but the majority of users makes few
questions (low outdegree). In a similar way, several
users answer or comment only a few topics (low
indegree) and a few users answer or comment to
several (high indegree).
3.5 Users' Attributes
We analysed some users’ attributes in order to seek
for evidences that a user is an expert (has a high
reputation). These attributes were analysed for the
whole network as well as for the specific
components of the Bow Tie structure. The attributes
FindingReliablePeopleinOnlineCommunitiesofQuestionsandAnswers-AnalysisofMetricsandScopeReduction
531

we chose for the analysis were:
User entropy: a measure for analysing the focus
of a user in specific subjects in the community,
to ascertain the relationship between the user
focus in specific subjects and his reputation.
Number of answers and number of comments:
the reputation of a user in a network is built
through his answers and comments within the
network. Then, we decided to analyse the
relationships between the number of answers and
comments with the users’ reputation.
z-score: combines the number of questions with
the number of answers of a user. Answering to
several questions can indicate the user is an
expert, but asking many questions can indicate
this user is not an expert. This metric provides a
balance between the number of questions and
answers of a user.
Indegree: represents the number of people the
user has answered. We believe the user
reputation depends on the amount of people he
answers.
Page Rank: several works use ranking algorithms
for finding experts, but not considering specific
parts (scope reduction strategies) of the network.
The idea was to analyse if it works in such
strategies.
Then, all these measures were extracted from the
network and analysed separately (analysis by parts,
scope reduction) for each component of the Bow Tie
structure.
3.5.1 User Entropy
In order to capture how answers and comments of a
user are focused on specific categories (or topics) of
the communities, we considered the user entropy.
The more grouped are the answers or comments of a
user in a specific category, the lower is the entropy
and higher is the focus. A person who has high
entropy usually answers or comments topics in
several categories, i.e., a person has a lower focus in
specific subjects. Adamic et al. (2008) shows the
user entropy can be defined by the formula (1):
entrop
y
∗log
2
(1)
The "P" in the formula is used to determine the
ability of a user to transmit information. In this
work, we call this ability as user participation. In
order to explain this formula in the context of this
work, imagine a user who posted ten answers in a
community of questions and answers. However,
three of the answers were related to the Java
category, three were related to the computer
architecture category and four were related to
compilers. Then, we calculate the “P” of each
category, an indicator of participation of a user in a
specific category. For instance, the “P” for this user
in the Java category is 0,3 since 3 of the 10 answers
were posted in the Java category (i.e., the division
3/10). For calculating this user’s entropy, it is
necessary to execute the following calculation:
∗ log
∗log
∗log
0,3∗log
0,3
0,3∗log
0,3
0,4∗log
0,4
1,57
(2)
Then, the users' entropies in the communities
were calculated in order to analyse if a user that is
focused in a specific category has higher reputation.
The user reputation provided by the network was
statistically correlated to the user entropy (Table 4).
In addition, correlation between user entropy and
reputation considering specific parts of the network
(components of the Bow Tie structure) allowed
understanding if it is better to analyse the entropy in
the whole network or it is enough a part of it.
Then it was possible to conclude the entropy is
moderately correlated to the user reputation (values
between 0,3 and 0,45), when analysing the whole
network (general), the Core component and the OUT
component in the three communities. According to
the results, analysing the whole network or parts of
it leads to similar results. For instance, in the
community English Language and Usage, the OUT
component of provided the best correlation among
the analysis. In the case of the Travel Answers
community, the Core component provided the best
correlation, although not really different from the
general entropy and the OUT component.
Table 4: Pearson Corr Coef (entropy vs. reputation).
Community
G
eneral
E
ntropy
Core
Entrop
y
IN
Entrop
y
OUT
E
ntropy
T
endrils
Entrop
y
Tubes
E
ntropy
Stack
overflow
0,43 0,36 0,02 0,34 0,33 0,16
English
Language
and Usage
0,36 0,34 0,12 0,4 0,2 -
Travel
Answers
0,44 0,45 0,25 0,43 0,16 -
The best correlations were provided by the Core
and OUT components, since the most participative
(active) users are found in the Core component
ICEIS2014-16thInternationalConferenceonEnterpriseInformationSystems
532

(those who ask and answer) and those who only
answer are found in the OUT component.
The correlation between the user entropy and
reputation in the IN component was weak. The
reason may be the fact the members of the IN
component only make questions and therefore they
do not build a good reputation in the network. The
Tendrils and Tubes components provided the worst
correlations, maybe because they are much smaller.
The correlations for the Tubes component in the
English Language and Usage and Travel Answers
communities were not calculated because they are
too small, so no conclusion drawn from them would
be relevant.
In summary, after the analysis in the three
communities, we can conclude a user with higher
entropy (less focus in the subjects), when analysing
the network as a whole or in parts of the network
(Core and OUT) may be a moderate indicator the
user has a high reputation in the network.
3.5.2 Correlating the User Reputation with
Other Attributes
With the goal of finding more attributes of a user
(besides entropy) that can indicate he has a high
reputation, we extracted some user’s measures (as
well as from the node in the graph that represents
him). These measures were: the number of posted
answers, the number of posted comments, the sum
of the number of answers and the number of
comments, the in degree, the z-score value and the
value given by the Page Rank algorithm for each
node (user) in the network.
The z-score is a measure proposed by Zhang et
al. (2007) and it can indicate the user reputation or
expertise in the network. Zhang et al. (2007) showed
how the z-score calculation was created, reaching
the formula (3):
zscore
QA
QA
(3)
Then, the z-score of each user was be calculated
considering the number of questions (variable “Q”)
and the number of answers (variable “A”) that he
posted. In the context of this work, the variable “A”
was the sum of the number of answers with the
number of comments of a user, since a comment can
be considered as an answer to a question or a
compliment to another answer.
The Page Rank algorithm (Page et al., 1998),
attributes a value to all the nodes of a graph,
indicating its importance in the network. We used
the Page Rank for identifying the most relevant
users in the network.
After extracting all the measures from the
network, they were correlated to the user reputation.
Then, analogous to the entropy, these measures were
correlated for the whole network and for parts of the
network (components of the Bow Tie structure).
Tables 5, 6 and 7 show the correlations of the user
attributes of each community with the reputation
from the network in each component of the Bow Tie
structure. In these tables, the label “Answer#” stands
for the number of answers, while “Com#” is the
number of comments, and “A + C” the sum of the
number of answers with the number of comments.
Table 5: Pearson Correlation Coef – Stackoverflow.
Attribute General Core IN OUT Tendrils Tubes
Answer# 0,66 0,72 0,068 0,07 0,18 0,10
Com# 0,54 0,63
-
0,037
0,34 0,30 0,15
A + C 0,60 0,68
-
0,022
0,36 0,34 0,18
z-score 0,58 0,61
-
0,038
0,38 0,26 0,14
Indegree 0,61 0,70 - 0,35 0,34 0,15
PageRank 0,52 0,62 - 0,22 0,26 0,12
Table 6: Pearson Corr Coef - English Lang and Usage.
Attribute General Core IN OUT Tendrils Tubes
Answer# 0,92 0,93 0,07 -0,06 -0,10 -
Com# 0,76 0,76 0,16 0,39 0,28 -
A + C 0,82 0,83 0,17 0,35 0,19 -
z-score 0,81 0,81 0,05 0,40 0,14 -
Indegree 0,88 0,86 - 0,36 0,20 -
PageRank 0,86 0,84 - 0,32 0,21 -
Table 7: Pearson Correlation Coef – Travel Answers.
Attribute General Core IN OUT Tendrils Tubes
Answer# 0,94 0,97 0,21 0,36 0,14 -
Com# 0,83 0,85 0,28 0,18 0,02 -
A + C 0,91 0,89 0,31 0,38 0,16 -
z-score 0,76 0,81 0,12 0,41 0,09 -
Indegree 0,93 0,92 - 0,39 0,09 -
PageRank 0,91 0,90 - 0,28 -0,05 -
FindingReliablePeopleinOnlineCommunitiesofQuestionsandAnswers-AnalysisofMetricsandScopeReduction
533

Analysing the correlations, the Core component
results were in general better than the others. For
instance, in the case of Stackoverflow, the number
of answers of the Core component is strongly
(higher than 0,7) related to the user reputation. The
other attributes of Core, although not strongly
correlated, may be classified as a moderately high,
as all of them obtained correlations higher than 0,6
with the user reputation. Analysing the network as a
whole can also bring strong or moderate
correlations, but in general, the correlations were
worse than when analysing only the Core
component. The other components (IN, OUT,
Tendrils and Tubes) also obtained worse correlations
with the user reputation. Comparing the correlation
between the number of answers and the indegree in
the Core component, we can see that the number of
people that a user answered (indegree) brings worst
correlation when compared to the number of
answers. It may indicate that the number of times a
user interacts is more important than the number of
people he interacts on expertise finding problems.
4 CONCLUSIONS
In this work we presented the characteristics of three
communities of questions and answers. First, these
communities were characterized according to the
Bow Tie structure and, then, they were compared to
the structure of other networks (the Web and a
discussion forum). The main difference from the
Bow Tie structure of these networks was the size of
their Core component. The majority of the members
of the communities of study, due to the size of the
Core component, seemed to be willing to help each
other. In addition, we analysed the distribution of the
degrees of the networks and we conclude that few
users are extremely active, making several
questions, but most of the users make few questions.
In a similar way, several users answer or comment
only a few topics and, few users answer or comment
several topics.
We also analysed the correlation between the
user entropy (focus on specific subjects) with his
reputation in the network. We conclude that the
entropy is moderately correlated with the user
reputation when we consider the whole network or
only the components Core and OUT. It means a user
that does not focus his participation in the network
(high entropy) in specific categories, probably has a
high reputation.
Finally, we analysed and correlated several
users’ attributes with their respective reputation. The
best correlations were obtained in the Core
component of the network. It means that, for finding
the experts (or at least the reliable users) in a
network, we may consider only the Core component.
It is important to mention that the obtained
results must be confirmed in other online
communities. The results depend on the three chosen
communities and may be different in others.
As future works, we intend to analyse the experts
in each category of the communities. In addition, the
study presented in this paper was limited to
identifying attributes that can indicate a user is
reliable and how to find him. However, only
identifying a reliable user is not enough for asserting
he is the most adequate person to answer a specific
question. For instance, an expert in software
engineering may not be the most adequate to answer
a question on compilers. Then, a possible future
work is to build a model that allows finding the most
adequate people to answer a specific question.
ACKNOWLEDGEMENTS
This work was partially supported by FAPERJ
(through grant E-26/102.256/2013 - BBP/Bursary
Associa: Exploring a Semantic and Social Teaching-
Learning Environment).
REFERENCES
Ackerman, M. S., McDonald, D. W., 1996. Answer
Garden 2: merging organizational memory with
collaborative help. In Proceedings of CSCW '96,
Boston, MA, 1996, ACM Press, 97-105.
Ackerman, M. S., Wulf, V., Pipek, V., 2002. Sharing
Expertise: Beyond Knowledge Management. MIT
Press, 2002.
Adamic, L., Zhang J., Bakshy E., Ackerman, M. S., 2008.
Knowledge sharing and yahoo answers: everyone
knows something, Proceedings of the 17th
international conference on World Wide Web, April
21-25, 2008, Beijing, China.
Alan, W. G., Jian, J., Abrahams, A S., Fan, W., Zhang, Z.,
2013. ExpertRank: A topic-aware expert finding
algorithm for online knowledge communities,
Decision Support Systems, Volume 54, Issue 3,
February 2013, Pages 1442-1451, ISSN 0167-9236,
http://dx.doi.org/10.1016/j.dss.2012.12.020.
Balog, K., Azzopardi, L., Rijke, M. D., 2009. A language
modeling framework for expert finding. Information
Processing and Management, 45(1), 1–19.
Banerjee, A., Basu, S., 2008. A social query model for
decentralized search. Proc. 2nd Workshop on Social
Network Mining and Analysis, ACM Press, 2008.
ICEIS2014-16thInternationalConferenceonEnterpriseInformationSystems
534

Broder, A., Kumar, R., Maghoul, F., Raghavan, P.,
Rajagopalan, S., Stata, R., Tomkins, A., Wiener, J.,
2000. Graph structure in the Web. Computer
Networks, 33 (1-6). 309-320.
Campbell, C. S., Maglio, P. P., Cozzi, A., Dom, B., 2003.
Expertise identification using email communications.
In the twelfth international conference on Information
and knowledge management, New Orleans, LA, 2003,
528-231.
Constant, D., Sproull, L., Kiesler, S., 1996. The kindness
of strangers: the usefulness of electronic weak ties for
technical advice, Organization Science 7 (2) (1996)
119.
Davitz, J., Yu, J., Basu, S., Gutelius D., Harris, A., 2007.
iLink: search and routing in social networks. Proc.
13th ACM SIGKDD International Conference on
Knowledge Discovery and Data Mining, ACM Press,
2007, pp. 931-940.
Dom, B., Eiron, I., Cozzi, A., Zhang, Y., 2003. Graph-
based ranking algorithms for e-mail expertise analysis.
In DMKD, New York, NY, 2003, ACM Press, 42-48.
Fritzen, E., Prates, J., Siqueira, S. W. M., Braz, M. H. L.
B., De Andrade, L. C. V., 2013. Contextual web
searches in Facebook using learning materials and
discussion messages. Computers in Human Behavior,
v. 29, p. 386-394, 2013.
Horowitz, D., Kamvar, S., 2010. The anatomy of a large-
scale social search engine. Proc. of the 19th
International Conference on World Wide Web
(WWW), ACM Press, 2010, pp. 431-440.
Huberman, B., Romero D., Wu, F., 2009. Social networks
that matter: Twitter under the microscope. First
Monday, vol. 14, 2009, pp. 1-8.
Kollock, P., 1999. The economies of online cooperation:
gifts and public goods in cyberspace. In Smith, M.A.
and Kollock, P. eds. Communities in Cyberspace,
Routledge, London, 1999.
Krulwich, B., Burkey, C., 1996. ContactFinder agent:
answering bulletin board questions with referrals. In
the 13th National Conference on Artificial
Intelligence, Portland, OR, 1996, 10-15.
Lakhani, K., Von Hippel, E., 2000. How open source
software works: "free" user-to-user assistance.
Research Policy, 32 (6), 923-943.
Lin, H., Fan, W. Zhang, Z., 2009. A qualitative study of
web-based knowledge communities: examining
success factors, International Journal of e-
Collaboration 5 (3) (2009) 39–57.
Littlepage, G. E., Mueller, A. L., 1997. Recognition and
utilization of expertise in problem-solving groups:
Expert characteristics and behavior. Group Dynamics:
Theory, Research, and Practice, 1. 324-328.
Liu, X., Wang, G. A., Johri A., Zhou, M., Fan, W., 2012.
Harnessing global expertise: a comparative study of
expertise profiling methods for online communities,
Information Systems Frontiers (2012) 1–13.
Morris, M., Teevan, J., Panovich, K., 2010. What do
people ask their social networks, and why?: a survey
study of status message Q&A behavior. Proc. 28th
International Conference on Human Factors in
Computing Systems (CHI), ACM Press, 2010, pp.
1739-1748.
Mui, Y., Whoriskey, P., 2010. Facebook passes Google as
most popular site on the Internet, two measures show.
The Washington Post, 2010.
Page, L., Brin, S., Motwani, R., Winograd, T., 1998. The
Pagerank Citation Ranking: Bringing Order to the
Web, Stanford Digital Library Technologies Project,
1998.
Paul, S., Hong L., Chi, E., 2013. Is twitter a good place for
asking questions? a characterization study. Proc. Fifth
AAAI International Copyright (c) IARIA, 2013. ISBN:
978-1-61208-280-6 152 ICIW 2013 : The Eighth
International Conference on Internet and Web
Applications and Services Conference on Weblogs and
Social Media (ICWSM), 2011, pp. 578-581.
Souza, C. C., Magalhães, J. J., Costa, E. B., Fechine, J.
M., 2013. Social Query: A Query Routing System for
Twitter. In: The Eighth International Conference on
Internet and Web Applications and Services (ICIW),
2013. Roma. Proceedings of the International
Conference on Internet and Web Applications and
Services.
Streeter, L., Lochbaum, K., 1988. Who Knows: A System
Based on Automatic Representation of Semantic
Structure. In Proceedings of RIAO, 1988, 380-388.
Wasko, M. S., Faraj, Teigland, R., 2004. Collective action
and knowledge contribution in electronic networks of
practice, Journal of the Association for Information
Systems 5 (11–12) (2004) 494–513.
Yimam-Seid, D., Kobsa, A., 2003. Expert Finding
Systems for Organizations: Problem and Domain
Analysis and the DEMOIR Approach, Sharing
Expertise: Beyond Knowledge Management, MIT
Press, Cambridge, MA, 2003.
Zhang, J., Ackerman, M.S, Adamic, L., 2007. Expertise
networks in online communities: structure and
algorithms, Proceedings of the 16th international
conference on World Wide Web, May 08-12, 2007,
Banff, Alberta, Canada.
Zhang, W., Watts, S., 2003. Knowledge adoption in online
communities of practice, Systemes d'Information et
Management 9 (1) (2003) 81–102.
FindingReliablePeopleinOnlineCommunitiesofQuestionsandAnswers-AnalysisofMetricsandScopeReduction
535
