
Using Technology to Accelerate the Construction of Concept
Inventories
Latent Semantic Analysis and the Biology Concept Inventory
Kathy Garvin-Doxas
1
, Michael Klymkowsky
2
, Isidoros Doxas
3
and Walter Kintsch
4
1
Center for Integrated Plasma Studies, University of Colorado, Boulder, CO, U.S.A.
(Present address: Boulder Internet Technologies, Columbia, MD, U.S.A.)
2
Department of Molecular, Cellular and Developmental Biology, University of Colorado, Boulder, CO, U.S.A.
3
Center for Integrated Plasma Studies, University of Colorado, Boulder, CO, U.S.A.
(Present address: BAE Systems, Columbia, MD, U.S.A.)
4
Institute of Cognitive Science, University of Colorado, Boulder, CO, U.S.A.
Keywords: Concept Inventory, Biology Concept Inventory, Misconceptions, Latent Semantic Analysis.
Abstract: Concept Inventories are multiple choice instruments that map students’ conceptual understanding in a given
subject area. They underpin some of the most effective teaching methods in science education, but they are
labour intensive and expensive to construct, which limits their wide use in instruction. We describe how we
use Latent Semantic Analysis to accelerate the construction of Concept Inventories in general, and the
Biology Concept Inventory in particular.
1 INTRODUCTION
Concept Inventories are multiple choice instruments
that explore students’ conceptual understanding in a
given subject area. To accomplish this, CI
developers look for verbal markers that can be used
as proxies for identifying students’ conceptual
structures, much as we try to find DNA markers for
various traits. Well constructed CIs provide
researchers with a map of the students’ conceptual
landscape, which can be used to inform instruction
in that area.
Research-based teaching methods that are firmly
based on misconception research and make
consistent use of collaborative learning are the most
widely used national-scale tested methods that
consistently produce learning gains significantly
superior to lectures in Physics and Astronomy (eg.
McDermott et al., 1998; Zeilik et al., 1997; Hake
1998). Short of one-on-one tutoring (cf. Bloom’s
“two sigma challenge”, Bloom, 1984), this is the
best model available for impacting student learning.
Although consistently successful, the model also
incorporates a significant barrier to its wide
adoption, replicability, and extensibility. It is
critically dependent on the existence of well-
researched assessment instruments that can reliably
diagnose a student’s misconceptions, and which
require considerable time and effort to produce.
Although several groups, both academic and
commercial are currently engaged in developing
such instruments in disciplines such as biology (e.g.
Garvin-Doxas and Klymkowsky, 2008; Smith et. al.,
2008; Kalas et. al. 2013), geoscience (e.g. Libarkin
and Anderson, 2006), and engineering (e.g. Midkiff
et. al., 2001), no substantial advance has been made
in the time, effort, and expense required to develop a
validated, reliable instrument.
Here we describe the construction of Concept
Inventories and how it differs from the construction
of tests, and we show how we use Latent Semantic
Analysis (LSA, Landauer et. al., 1998; Landauer and
Dumais, 1997) to facilitate the usually labour
intensive validation phase of Concept Inventories in
general, and the Biology Concept Inventory (Garvin-
Doxas and Klymkowsky, 2008; Klymkowsky and
Garvin-Doxas, 2008) in particular.
301
Garvin-Doxas K., Klymkowsky M., Doxas I. and Kintsch W..
Using Technology to Accelerate the Construction of Concept Inventories - Latent Semantic Analysis and the Biology Concept Inventory.
DOI: 10.5220/0004957403010308
In Proceedings of the 6th International Conference on Computer Supported Education (CSEDU-2014), pages 301-308
ISBN: 978-989-758-021-5
Copyright
c
2014 SCITEPRESS (Science and Technology Publications, Lda.)

2 CONCEPT INVENTORIES
AND TESTS
Although CIs bear a strong resemblance to
standardized tests, the two types of instruments are
very different, having fundamentally different aims.
Tests are basically designed to answer the question
“what percentage of the desired knowledge and
skills in this field has this student acquired?”. CIs
are meant to answer the question “what conceptual
constructs is this student using when solving
problems in this field?”. These same questions can
also be asked from the point of view of an ensemble
of students (rather than the individual student). From
that point of view tests are meant to rank the
students in the ensemble according to their skill and
knowledge, while CIs are meant to report the
percentage of students in the ensemble that use a
particular conceptual construct.
The two descriptions (individual and ensemble)
must of course be equivalent, since they are both
describing the same underlying system. This is
harder than it sounds, and it is the source of most
difficulties, both practical and conceptual, in all
statistical descriptions of systems from Physics to
Economics. What that means, is that for any given
case we should come up with the exact same
observable answers whether we are looking at the
individual view (eg. calculating the likely trajectory
of an electron hole in a semiconductor, or the likely
portfolio value of an individual investor) or the
ensemble view (ie. calculating the total current in the
semiconductor, or the total retirement savings of a
population). As a practical matter, most fields that
use statistical descriptions of their systems have
developed more-or-less distinct sub-disciplines that
study the two pictures, each with its own distinctive
tools and methods. In economics, for instance, the
Treasury and the Federal Reserve use
macroeconomic tools, theories and measures to
follow the economy as a whole, while investment
brokers use different tools to produce investment
strategies for individuals. The two pictures should be
exactly equivalent (and they are rigorously so for
systems like ideal gasses, if not necessarily so for
the economy) but nevertheless the two sub-
disciplines can often look very different.
In education too, different tools and methods
have traditionally been associated with individual
students than have been used with ensembles. In
particular, although tests can be (and sometimes
indeed are) used to guide individual students’
learning, most tests are mainly used to produce
grades (i.e. rankings). Concept Inventories on the
other hand are meant to map students’ prevalent
misconceptions in a field, and hence guide the
development of instructional materials and methods
that address these misconceptions explicitly. On the
student level, CIs can be used to assign supplemental
instructional materials that are specifically designed
to address that particular student’s misconceptions.
For example, during the development of the Biology
Concept Inventory (BCI), we discovered that an
entire class of difficulties that students encounter in
both genetics and molecular biology arise from
students’ misconceptions about random processes
(cf. Garvin-Doxas and Klymkowsky, 2008;
Klymkowsky and Garvin-Doxas, 2008). In short,
students do not understand that processes as diverse
as diffusion and evolution are underpinned by
random processes which are taking place all the time
(molecular collisions and mutations), but think
instead that they are driven processes that stop
taking place when the driver is removed (they
believe that there is no diffusion in the absence of
density gradients, and no evolution in the absence of
natural selection). This misconception can frustrate
learning unless it is directly addressed, and one can
envision instructional materials designed to address
it explicitly.
As a result of their main use as producers of
rankings, tests are therefore (in order of importance)
1) uni-dimensional 2) monotonic, and, as much as
possible, 3) linear. Of these properties, the one that
mostly defines the structure of a test is linearity.
2.1 Tests as Producers of Rankings
To ensure these properties, test developers look at
statistical measures like discrimination (ie. how
close can two scores be before we can no longer
assure that the higher score indeed represents higher
performance) and item difficulty.
Item difficulty is the fundamental weighting
factor on which most of the linearization schemes
rest. Perhaps the version of difficulty that is most
accessible intuitively is the percentage of students
that answered the question correctly; questions that
have been answered correctly by a large percentage
of students have lower difficulty. Item Response
Theory (IRT) for instance makes an explicit
assumption of true or near unidimensionality, and
posits that the probability, P, that a student of ability
will correctly answer a question of difficulty b is
given by the logistic function
P = exp(
-b) / [1+exp(-b)]
(1)
Both student ability and item difficulty can then be
CSEDU2014-6thInternationalConferenceonComputerSupportedEducation
302
place on the same scale (as we see from the logistic
function, a student whose ability
1
is equal to the
difficulty of some item b
1
will have a 50%
probability of answering that question correctly).
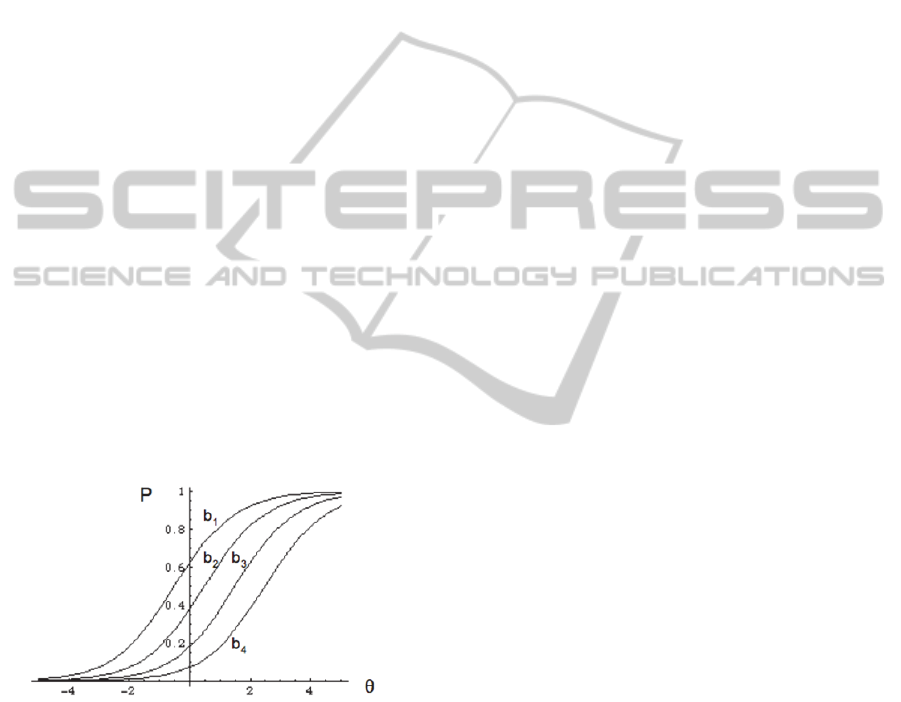
Difficulty is then used to linearize the response
of the test. The most intuitively accessible
linearization method, and the one most widely used,
consists of constructing the test with questions of
many different difficulty levels (b
1
-b
4
in Figure-1).
The higher the level of the student’s skill and
knowledge, the more questions s/he will answer
correctly. With a large bank of questions to choose
from, a test can be devised with questions that are
evenly spaced along the difficulty line, effectively
calibrating the instrument to insure a more-or-less
linear response: answering twice as many questions
(above some statistical floor) really means twice the
level of performance. We should note here that for
multiple choice tests the probability that a student of
very low ability answers correctly asymptotes to the
random floor (e.g. 25% for a four-option item), but
for concept inventories it usually asymptotes well
below the random floor, and often close to zero. This
is a consequence of having distracters that represent
common misconceptions; students who hold an
alternative model are lured to the answer that
corresponds to their model, and are therefore less
likely to pick the correct answer by chance.
Statistical treatments that take into account a
nonzero asymptote also exist.
Figure 1: Item Characteristic Curves (ICCs) for four items
of difficulty b
1
-b
4
. Evenly distributing test items along the
difficulty line produces a test with linear response.
Recently, more sophisticated linearization
techniques like Rasch analysis (Rasch, 1961) have
been used for instrument calibration, but all
calibration techniques aim for a linear instrument
response, and make explicit or implicit assumptions
about unidimensionality (or near-unidimensionality).
This is a direct and unavoidable consequence of
most tests’ main use, which is to produce rankings.
2.2 Concept Inventories and Rankings
Necessary as these statistical properties are for tests,
they are mostly irrelevant (and sometimes even
counterproductive) for Concept Inventories. CIs are
by nature multidimensional since what we really
want to know is each of the misconceptions that a
student holds, not some average over all
misconceptions. What we really want to know is
what specific instructional material to assign to a
student in order to address his/her misconceptions; a
measure of the student’s average performance level
is not at all informative on that task. Furthermore,
the percentage of students that answers a question
correctly is not an appropriate weighting factor for a
CI. The vast majority of the students can, and often
do, harbour the same misconception even after
repeated instruction; this is the very essence of
misconceptions. Leaving these questions out of the
instrument, or giving them minimal weight, because
they are at the tail of the difficulty distribution is not
a productive option.
Nevertheless, CIs have historically been used
essentially as tests, reporting a student’s
improvement in overall performance
(i.e. improvement in the total number of items
answered correctly) instead of reporting each
misconception a student is holding. This use of a CI
has proven to be useful in gaining the attention of
instructors (e.g. Hake, 1998), and should therefore
be considered during instrument constructions as a
possible (and even probable) use of the final
instrument. That said, results from CIs are inherently
much richer in the types of insights they can
provide. Given that the objective of a CI is to
provide detailed information that can be used to
explicitly address student misconceptions, it is
useful to have an analysis for each dimension
(concept) in the instrument, in addition to an average
over all dimensions. This can be done by performing
a statistical analysis not only for the correct answer
in each question, but also for the answers that
correspond to particular misconceptions. In the
context of IRT for instance, the Item Characteristic
Curve (ICC; Fig.-1) is no longer the probability that
the student will answer the question correctly, but
the probability that the student will pick the answer
that corresponds to a particular misconception, and
is the student’s “ability” with respect to that
misconception, or in other words the degree to which
the student holds that misconception.
The requirement of performing an analysis for
each dimension of a CI revives “the curse of
dimensionality” (the requirement of analyzing a very
UsingTechnologytoAcceleratetheConstructionofConceptInventories-LatentSemanticAnalysisandtheBiology
ConceptInventory
303

large number of items) which is precisely the
problem that modern test theories aim to alleviate.
Nevertheless, the requirement is a direct
consequence of the function of CIs, which is to
produce multidimensional information on the
conceptual state of students.
2.3 Validity and Reliability
For an instrument to be useful, be it a test or a CI, it
must be valid and reliable. Validity means that the
instrument measures what we want it to measure,
and doesn’t measure things we don’t want it to
measure (a thermometer should measure only
temperature, not some combination of temperature
and weight). Reliability means that the instrument
gives the same value when measuring identical
things. It is obvious from the definitions that validity
and reliability are closely related; if an instrument
measures only one thing (eg. temperature) then
there’s only one value it can give (the temperature of
whatever we are studying, no matter what its other
properties are). It is therefore clear that validity
implies reliability. What is less appreciated however,
is that reliability does not imply validity. Reliability
means that we are consistently measuring the same
one thing; but what is that thing? The answer to that
question cannot possibly come from the statistics of
the instrument alone; an additional input is needed.
That additional input is always theory. The
statistics of a reliable thermometer are identical to
the statistics of a reliable voltmeter (in fact, most
modern thermometers are actually measuring a
voltage); the only difference is the theory used to
translate the output of the device into a measurement
of temperature. In CI construction that additional
input is provided by experts who can consistently
associate students’ verbal cues with persistent
mental constructs.
Validation is a labour intensive and time
consuming process, the cost of which we can reduce
significantly with the use of technology. During the
development of the BCI we created Ed’s Tools, an
online suite of tools that allows us to collect, code,
and aggregate large amounts of text data,
considerably improving the speed of data collection
and analysis. The validation procedure and
validation results for the BCI are described in detail
in Garvin-Doxas and Klymkowsky, 2008, and
Klymkowsky and Garvin-Doxas, 2008. The
development and usage of Ed’s Tools are described
in detail in Garvin-Doxas et. al., 2007. Here we give
a short description of the method for completeness,
while referring the reader to the previously
published work for a detailed exposition.
We start by asking students to provide essay
answers to open-ended questions, which we then
code using Ed’s Tools. The coding allows us to
aggregate the language that students use to describe
their thinking for each concept that we identify. We
then use that language to formulate both the
questions and the answers (both the correct answer
and the distracters) for the CI items. We then
conduct interviews and think-alouds with a large
number of students and use these to refine our
wording of the Inventory items, and repeat the cycle
until the results from the interviews and the
instrument converge.
In the following section we describe how we use
Latent Semantic Analysis (LSA) to improve the
logistics of determining the prevalence of each
preconception in the student population, and we
show some initial results.
2.4 Latent Semantic Analysis and CI
Construction
LSA has been used successfully to provide grading
of student essays that correlates well with grades
given by experts (Landauer and Dumais, 1997;
Landauer et a.l, 1998), and can also be used
effectively to provide feedback that helps students
(or teachers) identify the elements of the text that
they have missed (Kintsch et al., 2000).
In addition to these general language
applications, we have recently achieved comparable
results in science specific tasks. The results of this
work show that with only a small (of the order of
~100) set of human-rated documents to train on,
LSA can classify documents that it has not trained
on along predefined concept categories in a way that
correlates well with the human classification. So far
we have analyzed student answers to three questions
in Physics, two in Astronomy, and six in Biology.
The Physics results shown in Figure-2 were
obtained with data collected with Ed’s Tools from
three different classes at the University of Northern
Colorado (UNC): an introductory calculus-based
course for scientists and engineers, and two physics
courses for pre-service teachers (an introductory
physics course, and a capstone physics course that is
required of all graduating pre-service teachers). The
essay was assigned during regular class time, and
students in all three classes were given 20 min to
complete it. The essay was given early in the
semester so that the students in the calculus based
class and the introductory pre-service class had not
covered the material in college.
CSEDU2014-6thInternationalConferenceonComputerSupportedEducation
304
A typical Physics question was:
In 60 words or more, describe what happens
when a light car and a heavy truck, which travel
with the same speed but in opposite directions,
collide head-on?
As a rule of thumb sixty-word answers are the
shortest documents on which LSA can be effective,
but with this question we wanted to test LSA’s
performance for the shortest answers on which the
method can be expected to give reasonable results.
We collected 65 responses from a class for majors,
and a total of 160 responses from two classes for
pre-service teachers. Although the overall number of
essays we collected was 225, nearly half of them had
no physics content (most of the invalid responses
concerned seat belt use, insurance rates, and the
safety disadvantages of fuel efficient small cars) so
the number of relevant essays on which LSA trained
was closer to 120. Two expert graders used
approximately half of the responses to train on, and
scored the remaining half independently. Four rubric
components were identified, along which each of the
answers was scored on a scale of 0-3. An answer
was given a 0 along a component if it did not contain
any treatment of the subject, and a 3 if it contained a
well articulated treatment (for a misconception, that
treatment is physically incorrect, but as long as the
concept is clearly present in the text the score for
that component is 3). The four components and
examples of answers are given in the Appendix. The
essays were analyzed using two spaces, TASA, and
a physics space constructed for the project. TASA
contains 1.2 million words in 37,000 documents and
750,000 sentences and has been selected to be
representative of the amount and type of material a
college student would have read in their lifetime.
The physics space was constructed using
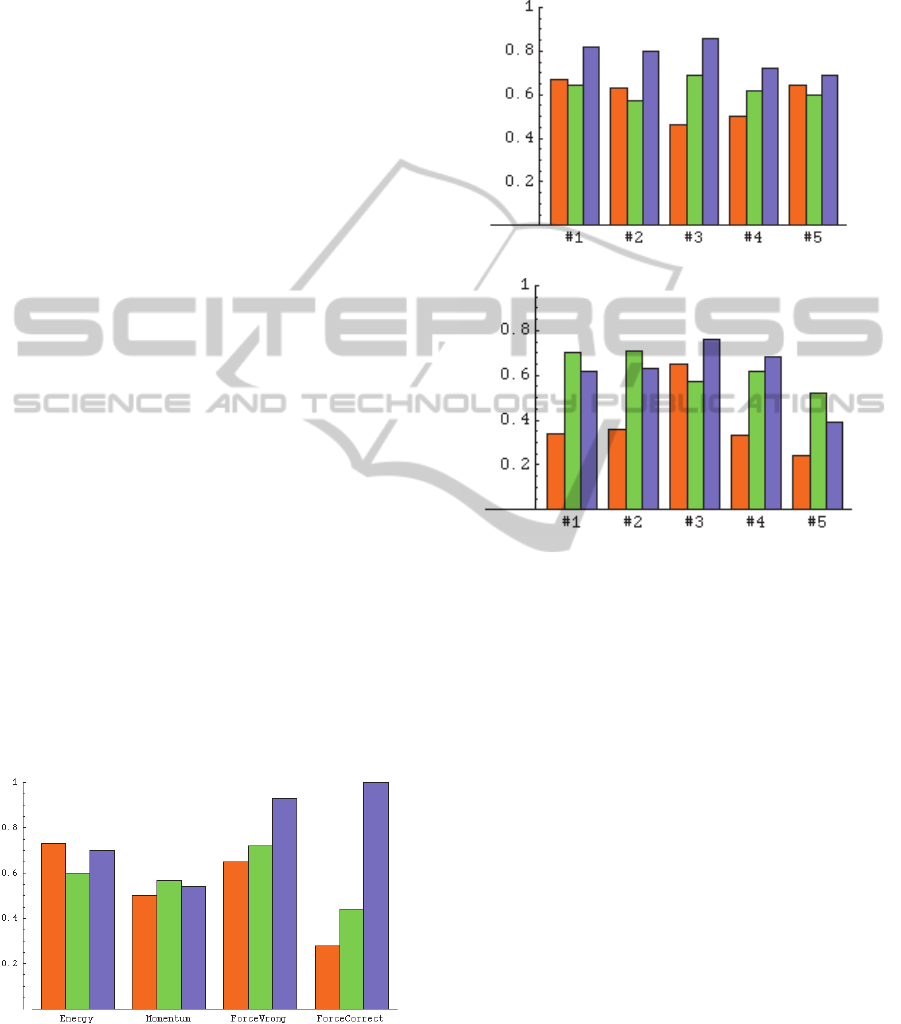
Figure 2: The correlation between the LSA score
assignment and the experts’ score assignment for each
rubric component. The bars represent the TASA-Expert,
(TASA+Physics)-Expert, and Expert-Expert correlations
respectively for the orange, green, and blue bar.
introductory physics texts available under the Open
Content license (http://opencontent.org/opl.shtml)
and contains 1465 documents.
Astronomy
Biology
Figure 3: Top frame: The correlation function between the
two experts (blue) and between the experts and the LSA
system using the TASA general English space (orange)
and TASA augmented with the physics space (green). The
rubric components are as follows:
#1: The Cosmological Constant (CC) provides a repulsive
force that counteracts gravity
#2: The CC is the same as Dark Energy
#3: Study of distant supernovae shows that the expansion
of the universe is accelerating
#4: Fluctuations in the microwave background radiation
show that the CC exists
#5: Dark Energy is a force that counteracts gravity
Bottom frame: The correlation function between the two
experts (blue) and between the experts and the LSA
system using the TASA general English space (orange)
and TASA augmented with the biology space (green). The
rubric components are as follows:
#1: Alternative forms of a gene are known as alleles
#2: Alleles can be dominant or recessive to one another
#3: For most genes, you carry two alleles, one from your
mother and the other from your father
#4: A recessive phenotype is visible if both alleles are
recessive; if one is dominant, the recessive phenotype will
not be visible, but the allele remains and can be passed to
offspring
#5: Phenotype refers to the visible traits displayed by an
organism.
UsingTechnologytoAcceleratetheConstructionofConceptInventories-LatentSemanticAnalysisandtheBiology
ConceptInventory
305

Figure-1 shows the correlation of the LSA
assigned scores (using the two spaces) to the score
assigned by expert-1 for each of the components,
and the correlation between the two experts.
Dimension-3 is the well-known dominant
misconception in the domain (that the heavy truck
will exert a greater force on the small car than the
other way around). We see that LSA is comparable
to the experts for component-1 (correct energy
formulation) and component-2 (correct momentum
formulation), although it performs lower than the
experts in component-3 (the dominant
misconception on the subject). Component-4 is the
correct force formulation of the problem.
It is important to note that TASA alone, which is
general space, produces results that are overall
comparable to the results produced with the addition
of a target-specific physics space. This plot shows
that by using human raters to rate a relatively small
number of documents, LSA can generally classify
documents on which it was not trained, with a
correlation which can be comparable to that of
different human experts. The exception in this case
seems to be the correct force formulation (which
states that the forces exerted by the car and truck on
each other are equal). It is not clear why this rubric
component faired so much worse than the rest. It is
worth noting that the experts were in perfect
agreement on this component (the correlation is one,
over all relevant answers).
Figure-3 shows results from two additional
questions, one in Astronomy, analyzed with TASA
and the same Physics test used in the Physics
questions, and one in Biology, analysed with TASA
and an open source Biology text. We see that in both
cases the system is consistently comparable to the
experts, especially when the general English space is
augmented with subject-specific texts.
3 CONCLUSIONS AND FUTURE
WORK
Although this is an ongoing project, the results so far
show that student essays, even of lengths that are
generally on the borderline of being too short for
treatment by LSA, can indeed give results that are
comparable to expert raters’, although some
challenges still remain. One of the questions that
will be important to the method, is the extend to
which the nature of the space in which the texts are
projected (eg. a general space like TASA versus a
discipline-specific space like the one we developed
from the textbooks) affects performance, and we
plan to conduct additional studies with a variety of
discipline-specific texts to address this question.
Perhaps the greatest limitation of the method is the
fact that, at this stage, the dominant misconceptions
are still being discovered “by hand” as it were, with
experts combing through large amounts of textual
data. Tools like Ed’s Tools can improve the logistics
of that search, and tools like LSA can improve the
logistics of identifying these misconceptions in very
large populations, but the discovery phase still
depends exclusively on experts. We plan to address
this limitation in future work, by using LSA to point
out possible new misconceptions that can then be
rated by content experts.
REFERENCES
Bloom, B. S., The 2 Sigma Problem: the Search for
Methods of Group Instruction as Effective as One-on-
One Tutoring, Educ. Res. 13, 4 (1984).
Garvin-Doxas, K. and M. W. Klymkowsky.
Understanding Randomness and its impact on Student
Learning: Lessons from the Biology Concept
Inventory (BCI). CBE Life Sci Educ 7: 227-233
(2008).
Garvin-Doxas, K., I. Doxas, and M.W. Klymkowsky. Ed's
Tools: A web-based software toolset for accelerated
concept inventory construction. Proceedings of the
National STEM Assessment Conference 2006. D.
Deeds & B. Callen, eds. Pp. 130-139 (2007).
Hake, R., Interactive engagement versus traditional
methods: A six-thousand-student survey of mechanics
test data for introductory physics courses, American
Journal of Physics, 66, pp. 64 (1998).
Kalas P, O'Neill A, Pollock C, Birol G., Development of a
meiosis concept inventory, CBE Life Sci Educ.
12(4):655-64. doi: 10.1187/cbe.12-10-0174 (2013).
Kintsch, E., D. Steinhart, G. Stahl, Developing
summarization skills through the use of LSA-based
feedback, Interactive Learning Environments, 8
(2000).
Klymkowsky, M.W. and K. Garvin-Doxas. Recognizing
Student Misconceptions through Ed's Tool and the
Biology Concept Inventory. PLoS Biology, 6(1): e3.
doi:10.1371/journal.pbio.0060003, (2008).
Landauer, T. K., P. Foltz, and D. Laham, An introduction
to Latent Semantic Analysis. Discourse Processes, 25,
259-284 (1998).
Landauer, T. K. and Dumais, S. T., A solution to Plato's
problem: the Latent Semantic Analysis theory of
acquisition, induction and representation of
knowledge. Psychological Review, 104(2), 211-240
(1997).
Libarkin, J., and S. Anderson, Development of the
Geoscience Concept Inventory, Proceedings of the
National STEM Assessment Conference, Washington
CSEDU2014-6thInternationalConferenceonComputerSupportedEducation
306

DC, p. 148-158, (2006).
McDermott, L.C., P.S. Schaffer, and the Physics
Education Group at the University of Washington,
Tutorial in Introductory Physics, Prentice Hall, New
York (1998).
Midkiff, K. C., T. A. Litzinger, D. L. Evans, Development
of Engineering Thermodynamics Concept Inventory
Instrument, 31st ASEE/IEEE Frontiers in Education
Conference, Reno, NV (2001).
Rasch, G. On General Laws and the Meaning of
Measurement in Psychology. Proceedings of the
Fourth Berkeley Symposium on Mathematical
Statistics and Probability, Volume 4: Contributions to
Biology and Problems of Medicine, 321--333,
University of California Press, Berkeley, Calif.,
(1961).
Smith, M. K., W. B. Wood, and J. K. Knight, The
Genetics Concept Assessment: A New Concept
Inventory for Gauging Student Understanding of
Genetics, CBE Life Sci Educ 7, 422, (2008).
Zeilik, Michael, C. Schau, N. Mattern, S. Hall, K. W.
Teague, and W. Bisard, Conceptual astronomy: A
novel approach for teaching postsecondary science
courses. American Journal of Physics 65:10, 987-996,
(1997).
APPENDIX
The rubric components for the Physics example:
Component-1: Energy Conservation
Answers that received a non-zero grade along this
component had a correct discussion of energy
conservation for the problem. Students usually
talked about kinetic energy being converted to other
forms of energy during the collision (eg. heat or
sound) and correctly stated that the total kinetic
energy after the collision is lower than before. Some
students even identified and explained elastic and
inelastic collisions. The more complete the answer,
the higher the score that was assigned to it in this
component. For example:
When the light car and heavy truck collide. Each
will apply a force to the other. The force from the
heavy truck will be greater than the force the car
applies to the truck. After the inelastic collision the
car will "bounce" off the truck and travel
backwards. The truck will slow considerably but
should continue forwards. In this collision
momentum of the car and truck system will be
conserved because momentum is always conserved.
Kinetic energy however will be lost because the
collision is inelastic. Energy will be lost in the form
of heat and sound.
This answer was scored as a 3 in the first
component (incidentally, it also scored a 3 in
component-3, the dominant misconception in the
domain).
Component-2: Momentum Conservation
Answers that received a non-zero score along this
component had a correct discussion of momentum
considerations for the problem. Students usually
talked about the truck having a greater momentum
because of its greater mass. They correctly stated
that the truck will continue to move in its original
direction, while the car will reverse directions, that
the combined mass of the car+truck will move at a
lower speed than either did before, and many
students even stated explicitly that momentum is
conserved in the collision. The more complete the
answer, the higher the score that was assigned to it
along this component. For example:
What happens when the light car and heavy truck
collide with each other is that they will have a non-
elastic collision. When they crash they will
somewhat stick together and continue to move in the
same direction as the heavy truck was moving before
the collision. The kinetic energy of the light car and
heavy truck will not be the same as the kinetic
energy of the total mass of the truck and car,
because the vehicles are not on a frictionless surface
and energy is lost in heat.
This answer scored a 3 in this component
(although it is missing an explicit statement for
conservation of momentum). It also scored a 3 in
component-1 (correct energy treatment) despite the
fact that it is ambiguous about the reason for energy
non-conservation. Very few answers were better
than this.
Component-3: The Force Exerted by the Truck is
Bigger
This is the best known misconception treated in the
literature. Answers that received a non-zero grade
along this component stated that the truck will exert
a bigger force on the car than the other way around.
For example:
Primarily, when a collision occurs between any
object, energy will always be conserved. What will
happen in a case where a light car and a heavy
truck, traveling at the same speed in opposite
directions, collide is each will have a certain
magnitude in force and after the collision the
vehicles will travel some distance. We know that the
heavier truck will have more force because it is
more massive. The light car will have less force
because it is less massive. The direction in which the
vehicles travel post impact depends on the net force
resulting between the two vehicles.
This answer scored a 3 in this component. It
clearly states the dominant misconception twice,
UsingTechnologytoAcceleratetheConstructionofConceptInventories-LatentSemanticAnalysisandtheBiology
ConceptInventory
307

both for the truck and for the car.
Component-4: Force Equal
This is the correct force formulation for the problem.
According to Newton’s laws, the force exerted by
the car on the truck is equal to the force exerted by
the truck on the car. For example:
When a light car and heavy truck collide head on
traveling at the same speed the light car will have
the most damage. This is not because the force was
greater on the car, both are hit with the same
amount of force, it is simply because the car is not
built as sturdy as the heavy truck.
This answer received a 3 on this component.
Some students not only stated this explicitly, but
they also quoted Newton’s law by name.
CSEDU2014-6thInternationalConferenceonComputerSupportedEducation
308
