
CG Teaching Material for the Electronic Laboratory Textbook
Esterification of Acetic Acid and Ethanol
Akira Ikuo,
Yusuke Yoshinaga and Haruo Ogawa
Department of Chemistry, Tokyo Gakugei University, Tokyo 184-8501, Japan
Keywords: Teaching Material, Visualization, Electrostatic Potential, Quantum Chemical Calculation.
Abstract: CG animation of the esterification of acetic acid and ethyl alcohol was made based on quantum chemical
calculations by use of MOPAC with PM5 Hamiltonian. The CG animation could simultaneously display
realistic shapes and electrostatic potentials of the intermediates of the reactants on the way of the reaction
profile besides the ball-and-stick model of the intermediates. A survey of five chemistry textbooks used in
Japanese high school revealed that molecular models in chemistry were illustrated by popular molecular
models such as ball-and-stick, space filling, and free-hand. There were only a few examples illustrated by
the models with characteristics of molecules for chemical reaction mechanism. The CG animation could
demonstrate these images of dynamical reaction mechanism for the esterification and can be loaded with
tablet PC and smart phone. We are trying to produce an electronic laboratory textbook of the esterification
in which the CG teaching material is combined with chemical experiments of student’s laboratory.
1 INTRODUCTION
Chemical education has the circumstances
performed through an experiment. Understanding
the observed phenomena, chemists use to imagine
and explain observations in terms of molecules.
Observed phenomena and molecular level models
are then represented in terms of mathematics and
chemical equation (Gilbert, 2009 and Tasker, 2010).
Student’s difficulties and misconceptions in
chemistry are from inadequate or inaccurate models
at the molecular level (Kleinman, 1987).
Visualization is great help for students to have
images in the molecular level. It is our aim to
produce computer graphics (CG) teaching material
based on quantum chemical calculations, which
provides realizable images of the nature of chemical
reaction (Ikuo, 2006 and 2009). If the CG teaching
material is combined with chemical experiments of
student’s laboratory, students would observe the
reaction from three thinking levels, namely,
phenomena in the observable level and CG teaching
material in the molecular level, and chemical
equation in the symbolic level. Our ultimate goal is
to produce an electronic laboratory textbook, which
integrates these three levels.
Chemical reaction is generally expressed by a
chemical formula that provides information of the
reaction about its stoichiometry; however, chemical
formula does not provide information about its
realistic shape and reactivity of molecule. This
information is essential to realize images of
chemical reaction. Molecular models such as wire,
ball-and-stick, and space filling, are popularly used
to realize images of molecule. They are used
properly for the purpose of getting information of
molecule about bond length and its angle, shape, and
so on. Generally, electron density iso-surface on CG
is displayed with realistic shape of molecule, and
electrostatic potential on CG provides information
about electrical character of a certain part of
molecule.
In this paper, we report here a CG teaching
material adopting the CG with electrostatic potential
on electron density that represents both of realistic
shape and electrostatic potential of molecule for the
purpose of making electronic laboratory textbook of
the esterification, which integrates the observable
level experiment and the molecular world, along
with a survey of five chemistry textbooks used in
Japanese high school about molecular models in
chemistry.
226
Ikuo A., Yoshinaga Y. and Ogawa H..
CG Teaching Material for the Electronic Laboratory Textbook - Esterification of Acetic Acid and Ethanol.
DOI: 10.5220/0004961702260231
In Proceedings of the 6th International Conference on Computer Supported Education (CSEDU-2014), pages 226-231
ISBN: 978-989-758-022-2
Copyright
c
2014 SCITEPRESS (Science and Technology Publications, Lda.)

2 PROCEDURE
2.1 Quantum Chemical Calculation
Structures of intermediates on the esterification of
acetic acid and ethyl alcohol and their electrostatic
potentials on electron density were calculated as
follows: the semi-empirical molecular orbital
calculation s MOPAC (Stewart, 1989) with PM5
Hamiltonian in CAChe Work System for Windows
(Former name of Scigress, ver. 6.01, FUJITSU, Inc.)
was used in all of calculations for optimization of
geometry by the Eigenvector Following method, for
search of transition state by use of the program with
Saddle point Search, and for search of the reaction
path from the reactants to the products via the
transition state by the intrinsic reaction coordinate
(IRC) calculation (Fukui, 1970). Details of
procedure of the quantum chemical calculations
were described in the previous paper (Ikuo, 2006).
The electrostatic potential on electron density
(EPED) (Kahn, 1986) was calculated based on
structures from the results of the IRC calculation.
2.2 CG Teaching Material
A movie of the reaction path was produced by the
software DIRECTOR (ver. 8.5.1J, Macromedia,
Inc.) following the display of the bond order of the
structure of the reactants in each reaction stage,
which was drawn by the CAChe. The obtained CG
of EPED model was combined with those of ball-
and-stick model and reaction profile in the same
reaction stage. It was confirmed that the drawn CGs
of the molecular models of reactants moves
smoothly. The red ball, which indicates progress of
the reaction, was arranged on the reaction profile
and simultaneous movements of the ball and the
reactants were confirmed. The movie file was
converted to the Quick Time movie by the Quick
Time PRO (ver. 7.66, Apple, Inc.) and was saved to
iPad (Apple, Inc.) by using the iTunes (ver. 10.7,
Apple, Inc.).
2.3 Survey of High School Textbooks
Survey of five chemistry textbooks of “Chemistry I,
II” used in Japanese high school (Textbooks of
“Chemistry I” and “Chemistry II” in Japanese high
school, 2003 and 2004) was conducted to investigate
how the molecular models were used in chemistry in
the actual circumstances.
3 RESULTS AND DISCUSSION
3.1 Reaction Mechanism
Esterification of acetic acid and ethyl alcohol is
described as shown in the equation (1).
CH
3
COOH + C
2
H
5
OH →
CH
3
COOC
2
H
5
+ H
2
O
(1)
The mechanism of the reaction is well known (For
example Loudon, 1984), and generally, the
esterification proceeds in the presence of proton
catalyst. The rate-determining step includes the
paths of an attack of the oxygen atom of hydroxyl
group of ethyl alcohol to the central carbon of the
formed carbonium ion and release of water as shown
in the Scheme 1. This step dominates all over the
reaction, and then the calculation based on quantum
chemistry on the rate-determining step was carried
out. Although another mechanism that involves
more than a pair of reactants is possible as reported
in the case of carbonic acid formation (Nguyen,
1984), it was not considered in this paper for
simplicity of program.
Scheme 1: Mechanism of the esterification on the rate-
determining step.
3.2 Optimization of the States of
Reactants and Products on the
Rate-determining Step
Appropriate geometry of reactants was calculated by
the Eigenvector Following method in MOPAC. The
calculation was carried out until the cut off value of
less than 1 in root mean square (RMS) gradient. The
calculation of optimization of the reactants was
started from a certain state where reactants of acetic
acid and ethyl alcohol with specific interactions.
Tentative heat of formation, ΔH
f
, was obtained by
MOPAC calculation. ΔH
f
s of the states of reactants
and products are shown in the Table 1.
The Δ H
f
value of the state of reactants was
decreased from 262.6089 to 84.23436 kJ mol
-1
after
40 cycles of geometry optimization with value of
0.96023 in RMS gradient. The value of RMS
indicates that the calculation was converged.
Therefore, calculated geometry of the reactants can
be considered as the lowest in energy in the present
calculation condition. Similarly, the calculation of
the state of products was started from a certain state
+
C
2
H
5
OH
C
2
H
5
O
H
C
H
3
C
O
H
O
H
H
3
CC
OH
OH
+
H
2
O
C
2
H
5
O
C
H
3
C
O
H
CGTeachingMaterialfortheElectronicLaboratoryTextbook-EsterificationofAceticAcidandEthanol
227
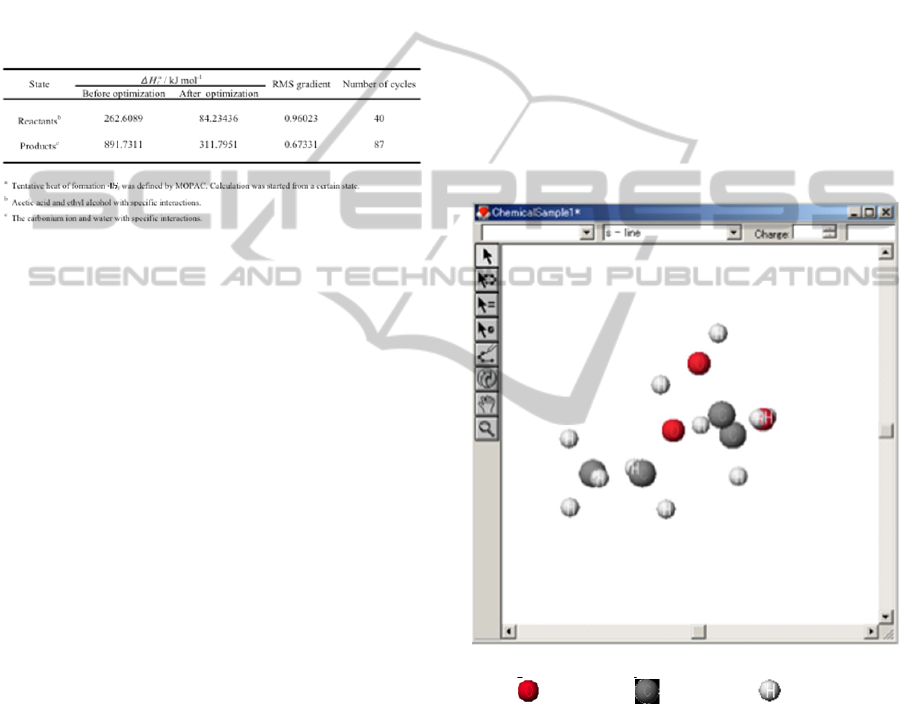
where the carbonium ion and water with specific
interactions. The Δ H
f
value of the state was
decreased from 891.7311 to 311.7951 kJ mol
-1
after
87 cycles of geometry optimization with value of
0.67331 in RMS gradient. The value of RMS
indicates that the calculation was also converged.
Geometries of both the reactants and the products in
the lowest energy were determined by these
optimizations.
Table 1: Optimization of the states of reactants and
products on the rate-determining step.
3.3 Determination of Transition State
on Reaction Path of
Rate-determining Step
Geometry of the intermediate in the transition state
was searched by use of the program with the saddle
point search in MOPAC. The optimized geometries
of the reactants and the products mentioned in the
above section were used with the data of starting
files for the saddle point search. Through the
calculation, reasonable structure of intermediate in
the transition state was obtained. The structure was
further refined by program refine transition state in
MOPAC.
The vibrational analysis of the intermediate was
performed by use of the program FORCE in
MOPAC. A single absorption peak in the negative
region was found at ca. -1200 cm
-1
. The result
indicates vibrational mode due to the decrease of
potential energy for the direction of only one path
via a true transition state at the saddle point. The
structure of intermediate obtained by MOPAC was
almost identical to that calculated by Gaussian 03W
at 6-31G(d) level. These mean a positive verification
of optimized structure of the intermediate in the
transition state.
The reaction path from the reactants to the
products via the transition state was searched by the
IRC calculation in MOPAC with the data files of the
obtained intermediate of the transition state, and the
files of the reactants and products as obtained in
section 3.2. After the calculation, each reaction path
from the transition state to the state of the reactants
or reaction path from the transition state to the state
of the products was searched individually where
1963 steps or 1046 steps were contained. Total
number of 3010 steps means the same number of
geometries of intermediates on all over the reaction
path.
3.4 Atom Coordinates of the
Intermediate
The atom-coordinates of the intermediate in
transition state were extracted from the results of the
IRC calculation in the above section. The Figure 1
shows them on three-dimensional coordinates, in
which sphere size of atoms is proportional to atomic
radius. The best angle of bird’s-eye view on CG was
selected to show all atoms composed in the
intermediate.
Figure 1: Geometry of atoms in the transition state.
: oxygen, : carbon, : hydrogen
3.5 Iso-surface of Electron Density in
the Transition State
An iso-surface of the electron density of the
intermediate was calculated based on the coordinates
of atoms mentioned in the above section and were
shown in the Figure 2. The coordinates of atoms
were converted to the iso-surface by this procedure.
The iso-surface of the electron density at the value
of 0.01 eÅ
-3
was illustrated with the mesh pattern.
The iso-surface demonstrates realistic shape of the
intermediate.
CSEDU2014-6thInternationalConferenceonComputerSupportedEducation
228
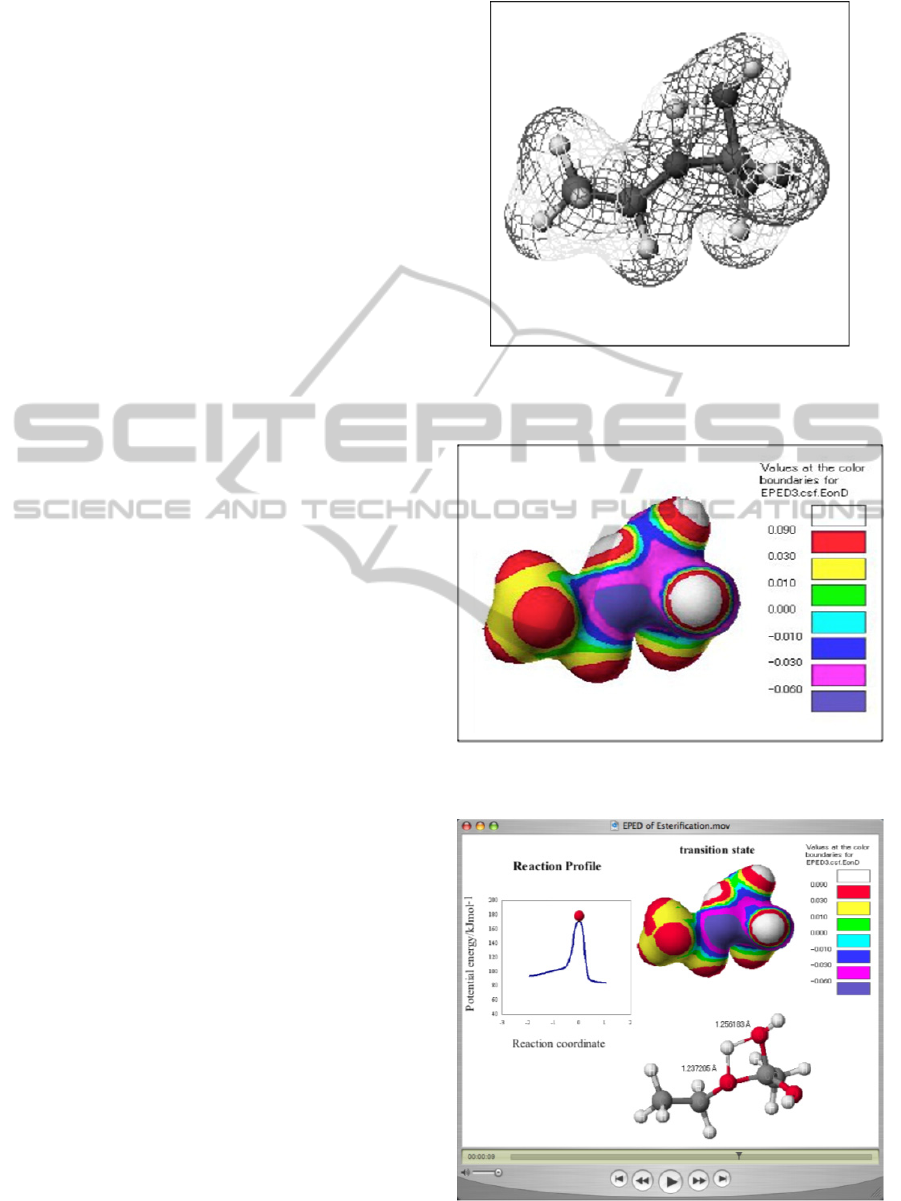
3.6 Electrostatic Potential in the
Transition State
The electrostatic potential (Kahn, 1986) was
calculated based on the coordinates of atoms
mentioned in section 3.4 and superimposed on to the
iso-surface as shown in the Figure 3. The values of
electrostatic potentials were represented in different
colour on the model of intermediate in the transition
state, and figure legend of colour boundaries for
electrostatic potential was also listed. Distribution of
the electrostatic potential among the intermediate
can be seen by the colours. For example, oxygen of
ethanol is negatively charged with relative value of -
0.06 based on evaluation of energy of interactions of
prove proton to the charge of iso-surface, and
hydrogen of carbonium ion is positively charged
with relative value of +0.09. The model by
electrostatic potential provides information about
electrostatic distribution of the intermediate on the
way of the reaction.
3.7 Combination of the Electrostatic
Potential Map, the Ball-and-stick
Model, and the Reaction Profile on
CG
The CGs of the EPED model mentioned in the above
section, ball-and-stick model, which have been
reported previously (Ikuo, 2006), and reaction
profile on the same state were combined, and the
obtained combination CG is shown in the Figure 4.
The EPED model displays distribution of
electrostatic potential on the surface of the
intermediate with realistic shape, and the ball-and-
stick model shows skeletal structure of the
intermediate. The reaction profile demonstrates the
degree of the reaction progress by the ball illustrated
in the figure. The combination CG is able to provide
information about electrostatic potential and
structure of intermediate of molecule in a certain
state simultaneously.
3.8 CG Teaching Material
The Quick Time movie file was created as teaching
material by use of 100 frames of combination CGs.
The Figure 5 shows five frames of representatives of
the combination CGs on the way from the state of
reactants to that of products via the transition state.
The teaching material demonstrates the changes of
electrostatic potential and realistic shape of the
intermediate of the reaction on the reaction profile in
all stages at the same time. The ball on the reaction
Figure 2: Iso-surface of electron density besides the ball-
and-stick model in the transition state. Net represents iso-
surface of electron density with 0.01 eÅ
-3
Figure 3: Electrostatic potential on electron density in the
transition state.
Figure 4: Combination CG of electrostatic potential map,
ball-and-stick model, and reaction profile.
CGTeachingMaterialfortheElectronicLaboratoryTextbook-EsterificationofAceticAcidandEthanol
229
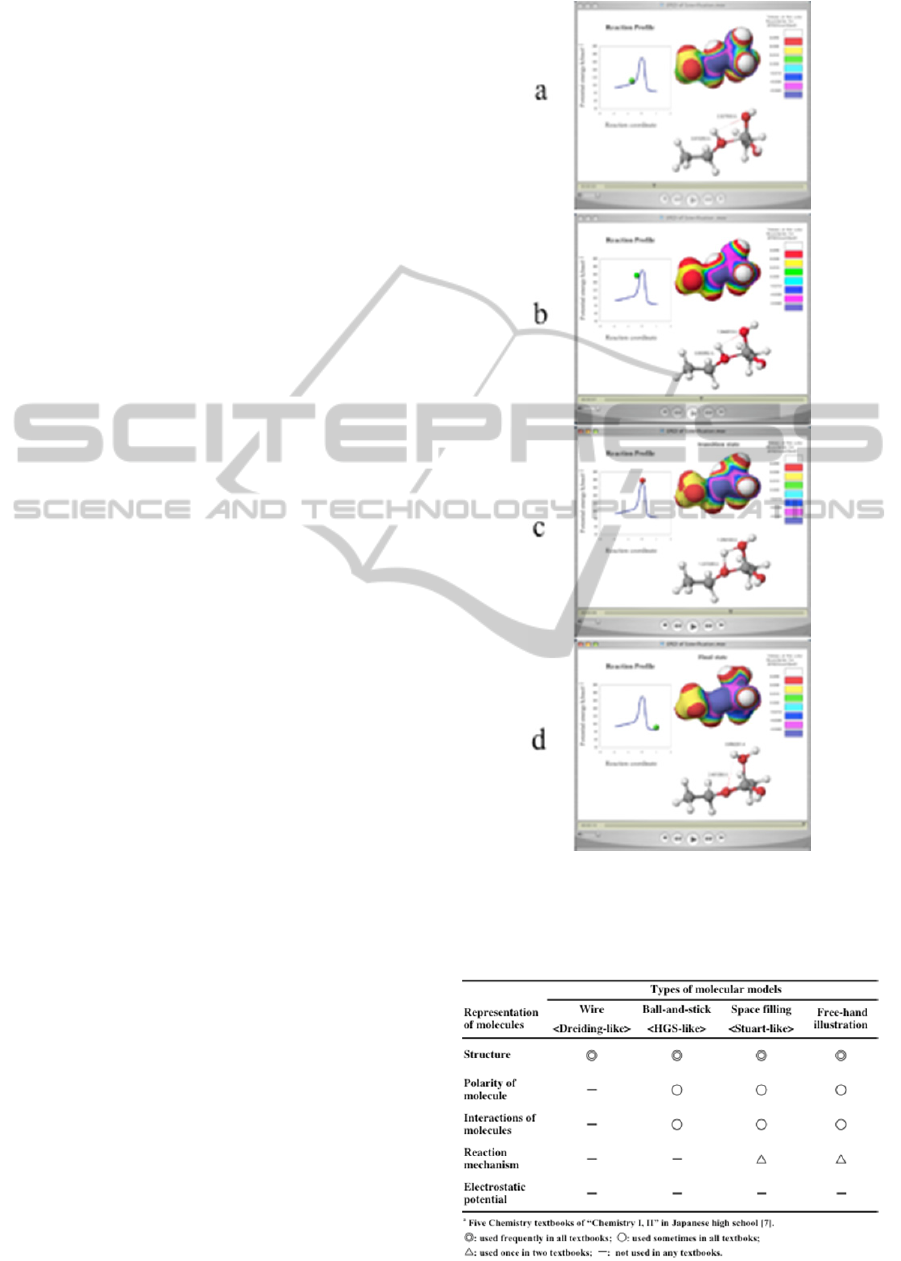
profile can move by users’ choice of the way of
automatic movement or manual movement along the
reaction coordinate, which indicates the most
probable pathway of chemical reaction according to
the IRC theory (Fukui, 1970). Other CGs such as
EPED and ball-and stick modes are synchronized
with the movement of the ball on the reaction profile
by use of the Quick Time control bar so that the
degree of the reaction progress and structural change
of the molecules of all stages could be demonstrated
simultaneously. The animation provides details of
the chemical reaction mechanism dynamically.
The
CG teaching material can be loaded with tablet PC,
and smart phone such as iPad and iPhone.
3.9 Survey of Textbooks
Since, it is usually the last chance for most of citizen
to deal with molecular models, survey of five
different textbooks each from “Chemistry I” and
“Chemistry II” used in Japanese high school
(Textbooks of “Chemistry I” and “Chemistry II” in
Japanese high school, 2003 and 2004) was
conducted to investigate how the molecular models
were used in chemistry in the actual circumstances.
Frequency of the use for representation of molecules
by general molecular models is summarized in the
Table 2.
Molecular models were illustrated by popular
molecular models such as ball-and-stick, space
filling, and free hand. A small number of molecular
models were adopted to express polarity of molecule
with a notation of δ
-
or δ
+
. Models expressing
interactions of molecules such as hydrogen bond
were found in some books. Models giving
information about pseudo-reaction mechanism were
found in two textbooks. These results reveal that
there were only a few examples illustrated by the
models with realistic shapes and characteristics of
molecules for chemical reaction mechanism.
The survey implies that the proposed CG animation
is significantly effective to realize images of the
reaction mechanism for chemical reaction, i.e. the
CG animation adopting the CG with electrostatic
potential on electron density that can represent both
of realistic shape and electrostatic potential of
molecule. The CG animation would lead student to
realize images of dynamical reaction mechanism for
the reaction.
Integration of the present CG teaching material
and laboratory textbook would serve as bridge
between the observable level experiment and the
molecular world.
Figure 5: CG Teaching Material.
Table 2: Frequency of the use for representation of
molecules by popular molecular models in high school
chemistry textbooks.
CSEDU2014-6thInternationalConferenceonComputerSupportedEducation
230

4 CONCLUSIONS
The CG animation of esterification of acetic acid
and ethyl alcohol could simultaneously display
realistic shapes and electrostatic potentials of the
intermediates on the way of the reaction profile
besides the ball-and-stick model of the
intermediates. A survey of five chemistry textbooks
used in Japanese high school revealed that molecular
models were illustrated by ball-and-stick, space
filling, and free-hand, and there were only a few
examples illustrated by the models with
characteristics of molecules for chemical reaction
mechanism. The proposed CG animation could
demonstrate these realistic shapes and characteristics
of molecules. The CG teaching material can be
loaded with tablet PC, and smart phone such as iPad
and iPhone. Now we are trying to produce an
electronic laboratory textbook of the esterification in
which the CG teaching material is combined with
chemical experiments of student’s laboratory.
ACKNOWLEDGEMENTS
This work was supported by JSPS Grant-in-Aid for
Scientific Research (C) (25350188).
REFERENCES
Fukui, K., 1970. A Formulation of the Reaction
Coordinate, J. Phys. Chem., 74, 4161-4163.
Gilbert, J. K., Treagust, D. F., 2009. in Gilbert, J. K.,
Treagust, D. (eds.), “Models and Modelling in Science
Education Vol. 4 Multiple Representations in
Chemical Education”, Springer, 333-350.
Ikuo, A., Ichikawa, T., Yoshimura, A. and Teratani, S.,
1999. Computer Microscope ? Dynamics of Chemical
Reactions, Proc. Int. Conf. on Computers in
Education, 916-917.
Ikuo, A., Ichikawa, T. and Teratani, S., 2000. Chemical
Reaction Observed with Computer Microscope, J.
Chemical software, 6, 45-54 (In Japanese).
Ikuo, A., Tamura, S., Kojima, Y., Buqueron, S. S., Rahmat
S. and Teratani, S., 2002. Interactive Animation of
Chemical Reaction Based on Quantum Chemical
Calculations - Computer Microscope 2002 -, Proc. Int.
Conf. on Computers in Education, 1453-
1452(30_73.PDF).
Ikuo, A., Ikarashi, Y., Shishido, T. and Ogawa, H., 2006.
User-friendly CG visualization with animation of
chemical reaction: esterification of acetic acid and
ethyl alcohol and survey of textbooks of high school
chemistry, Journal of Science Education in Japan, 30
(4), 210-215.
Ikuo A., Nagashima H., Yoshinaga Y., and Ogawa H.,
2009. Calculation of potential energy in the. reaction
of “I + H
2
→ HI + H”, and its visualization, The
Chemical Education Journal (CEJ), Registration #13-2.
Kahn, S. D., Pau, C. F., Overman, L. E. and Hehre, W. J.,
1986. Modeling Chemical Reactivity. 1.
Regioselectivity of Diels-Alder Cycloadditions of
Electron-Rich Dienes with Electron-Deficient
Dienophiles, J. Am. Chem. Soc., 108, 7381-7396.
Kleinman, R. W., Griffin, H. C., Kerner, N. K., 1987. J.
Chem. Edu., 64, 766-770.
Loudon, G. M., 1984. Organic Chemistry, Addison-
Wesley Publishing Co., Inc., p.1010.
Nguyen, M. T., Ha, T. K., 1984. A theoretical study of the
formation of carbonic acid from the hydration of
carbon dioxide: a case of active solvent catalysis, J.
Am. Chem. Soc., 106(3), 599-602.
Stewart, J. J. P., 1989a. Optimization of parameters for
semi empirical methods I. Method, J Comp. Chem., 10
(2), 209–220.
Tasker, R., Dalton, R., 2010. in Gilbert, J. K., Reiner, M.,
Nakhleh, M. (Eds.), “Models and Modelling in
Science Education Vol. 3 Visualization: Theory and
Practice in Science Education”, Springer, 103-131.
Textbooks of “Chemistry I” and “Chemistry II” in
Japanese high school: Daiichigakusyusya, 2003 and
2004; Jikkyosyuppan, 2003 and 2004; Keirinkan, 2002
and 2003; Sanseido, 2003 and 2004; Tokyosyoseki,
2003 and 2004. (In Japanese) Textbooks were listed in
alphabetical order.
CGTeachingMaterialfortheElectronicLaboratoryTextbook-EsterificationofAceticAcidandEthanol
231
