
Developing Open Source Dataloggers for Inquiry Learning
George Hloupis, Vassilis Bimpikas, Ilias Stavrakas, Konstantinos Moutzouris,
Charalampos Stergiopoulos and Dimos Triantis
New Technologies and Methodologies in Education Unit, Department of Electronics,
Technological Educational Institute of Athens, Agiou Spyridonos, Egaleo, Athens, Greece
Keywords: Dataloggers, Arduino, Open Source, Inquiry Learning, Project-based Learning, Hands-on Assignments.
Abstract: There exists a continuous need to promote better Science Technology Engineering and Mathematics
(STEM) education at the younger students. To satisfy this need hands-on laboratory assignments and
inquiry learning projects are widely accepted as appropriate approaches. One key issue for both approaches
is the effective and adaptive data logging. This article describes the development of educational datalogger
devices, using open source software and hardware which can be used to collect, present and save data for
both offline and online analysis. The novelty of the proposed devices lies on the fact the presented
implementations are not dedicated devices bind to specific features but they can be seen as educational
datalogger platforms which are expandable and adaptive to students’ needs in a minimum cost since they
are based in open source solutions.
1 INTRODUCTION
The systematic displeasure with science, technology,
engineering and mathematics (STEM) among young
people (McCormarck, 2010) is a challenging
problem that remains unsolved. Its solution is not
necessary only because today students are potential
tomorrow scientists but also because we demand
from them to be critical reviewers of scientific
knowledge : “improving the public’s ability to
engage with such socio-scientific issues requires,
therefore, not only a knowledge of the content of
science but also a knowledge of ‘how science
works’” (Osborne and Dillon, 2008). Recent studies
(European Commission, Science education now,
2007) present a lack of interest among young people
towards scientific topics which leads to declining
number of university graduates in STEM areas. This
is reflected as a shortage of scientists and engineers
in the job market which comes in contrast with the
prediction that there will be significant needs for
medium and high-skilled jobs as pointed out by
several studies [US Dept. of Commerce (2011)
indicates 17% grow from 2008 to 2018, compared to
9.8% growth in non-STEM fields; European Table
of Industrialists (2009) estimates 50 million new
STEM jobs by year 2020)]. It is more than obvious
that adequacy in STEM can serve as a major
keystone in developing adequate Research &
Development capacity leading in this way to
competitive innovators that will possibly lead the
technology market far more competitive than in
previous years.
A critical determinant on the above is an
education approach that will be able to enable young
people’s corresponding key abilities (e.g. the ability
to learn how to learn, developing mathematical,
scientific and technological skills, being creative and
active citizens). Students must be exposed to this
type of education very early in order to spark their
interest and ensure they received all the required
supplies leading towards to a valued university
degree in STEM areas. There is no doubt that
teachers, schools and the education system at whole
have the responsibility to cultivate a positive attitude
to science to young people (Gras-Velázquez et. al.,
2009). Their motivation is of major importance in
order to decide studies in STEM areas.
Schoolchildren’s views of science are formed
usually at primary school level and these views are
highly committed to their attitudes to science and
technology (Osborn and Dillon, 2008). As Gipps
(2002) pointed out “Scientific inquiry cannot be
made independent of the context, observer or means
of observation, and its successful prosecution will
usually require creativity and intuition, qualities that
555
Hloupis G., Bimpikas V., Stavrakas I., Moutzouris K., Stergiopoulos C. and Triantis D..
Developing Open Source Dataloggers for Inquiry Learning.
DOI: 10.5220/0004962605550562
In Proceedings of the 6th International Conference on Computer Supported Education (CSEDU-2014), pages 555-562
ISBN: 978-989-758-020-8
Copyright
c
2014 SCITEPRESS (Science and Technology Publications, Lda.)

do not appear on standard diagrams of ‘scientific
method’”. Science oriented project provides the
students the outline of the thinking and planning
skills required by professional scientists (Hodson,
1998). Under this approach students can get some
idea of the people who sometimes guess, often try
things without knowing what the exact result will be
and it is not rare that many experiments “fail”.
Shapiro (1996) asserts that the lack of investigation
results that the majority of students completed their
secondary programs having missed involvement in
developing an understanding of the very nature of
science itself.
Data logging lends itself particularly well to
scientific inquiry and may be the best educational
use that can be benefited of this technology (Gipps,
2001). Data logging methods allow pupils to assume
more responsibility and control in their science
practical investigations. The instant display of
measurements allows students to set new hypotheses
and change conditions to carry out further
experiments. Graph generation soon enough after
making a prediction greatly facilitates the
pedagogical technique of ‘Predict-Observe-Explain’
(Osborne and Hennessy, 2003) with rapid feedback
and the possibility of sorting out of the reasons for
unsuccessful predictions. Students were able to
‘feel’ for how the action and sensing reaction are
related and can therefore have a better understanding
of the meaning of the graph. Instant data logging and
analysis are strong motivating factors for students to
collect multiple data through repeated
measurements. Thus, this combined (logging and
analysis) process enables students to experience the
entire inquiry process as holistic and cyclical
(Rogers and Wild, 1994) a scenario that is rare in a
conventional science practical lessons.
The purpose of the current paper is to
demonstrate the design and implementation of three
low cost educational dataloggers based on Arduino
open source prototyping platform suitable for
carrying out the scientific inquiry learning outcomes.
The obvious purpose of our efforts is the
minimization of the cost (comparing to
corresponding solutions) along with the provided
flexibility (e.g. open source firmwares for different
measurement scenarios, unrestricted changes
through Arduino or Visual programming
environment) as well as with easiness to use (e.g
plug & play sensors, wizard type questions, touch
screen for user input, ready to run experiments).
2 DESIGN CONSIDERATIONS
FOR AN EDUCATIONAL
DATALOGGER
A modern educational datalogger must be capable of
providing some advantages over its predecessors.
Some of them can be the deconstruction of
traditional boundaries between distinct learning
environments, the strong search capabilities, the
interaction ability as well as the effective learning
and familiarization with state-of-the-art
technologies. These advantages lead to some basic
design requirements as below (Hloupis et. al, 2012):
Ease of use: Students without computer experience
must be able to use it (e.g. use of phone-like touch
screens).
Adaptability: student’s needs and skill must define
system’s boundaries (e.g. no need for excessive
training in order to use the datalogger)
Suitability: Subjects must provided with various
ways of gathering the learning outcome (e.g. a
solar energy experiment must be carried out by
means of different sensors)
Availability: operations and functions must be
available using simple procedures (e.g. adding a
new set of sensors must be a common procedure
independent from sensors’ type)
Usefulness: actions and dissemination must be in
familiar forms (e.g. data transfer by means of SD
cards of USB drives, data processing with ready-
to-run software)
Open source and low cost (e.g. users must be able
to select the desirable features and characteristics
from a range of cost effective options)
The above design requirements can be weighted
proportionally leading to implementation solutions
that will be different in their final form. In the
current study the prototypes of three representative
solutions are demonstrated where briefly described
at Table 1.
The selection of Arduino platform as the core of
the proposed educational dataloggers dictated from
two additional factors (except the fulfilment of
design requirements that stated earlier): its open
source characteristics and the huge amount of
support that can be found in Internet today. For
readers that are not familiar with Arduino platform
excellent introductory material can be found in
official site (www.arduino.cc) as well as in several
textbooks (Banzi, 2011; McRoberts, 2010; Oxer and
Blemmigs, 2009; Noble , 2012).
CSEDU2014-6thInternationalConferenceonComputerSupportedEducation
556

Table 1: Features of proposed educational dataloggers.
Short name Common
Features
Main (additional) Features Firmware / hardware
provided
Final
Cost
Medimnos
Plug & Play,
colour coded
external sensors
Real time clock
(RTC)
Data capturing
interval selected
by the user.
Data storage on
an SD card for
offline analysis.
Battery operated.
LCD character screen
Push button control
8 Analog inputs
YES (Arduino
codes & Schematics)
~20€
Kyathos
1.8" 18-bit Color TFT
Joystick control
16 Analog inputs
Data sent over the USB
for online analysis.
YES (Arduino
codes & Schematics)
~40€
Kotyli Touch screen with custom
designed interfaces
(software provided)
Predefined experiment
templates
16 Analog inputs
Data sent over the USB
for online analysis.
YES (Arduino
codes, Interface
Graphics &
Schematics)
<100€
3 EDUCATIONAL DATALOGGER
PROTOTYPES
3.1 Common Features
Since the prototype dataloggers share some common
features, these will be explained in detail initially.
Plug & Play external sensors. Ease of use can be
highly benefited if we release users from
obligatory sensor selection. Keeping in mind that
the proposed dataloggers can be used even in
primary schools curricula we propose a colour
code scheme for sensor signalling. Under this
approach the students only have to match the
colour of sensor outlet to corresponding coloured
input of the datalogger. A quick visual check by
the teacher can ensure the validity of the
connection increasing at the same time students’
confidence.
Analog inputs. The low cost Arduino versions that
based on AVR MEGA 328 microcontroller can
provide 6 (Uno, Leonardo, Diecimilla, Pro,
Lillypad) or 8 (ProMini, Nano, Fio) analog inputs.
From them only 4 remain free for user input. To
overcome this limitation we use only one analog
input coupled with an 8x1 or 16x1 multiplexer and
leave the remaining three reserved for future
purposes.
Real time clock. All measurements are time tagged
by means of onboard RTC in YYYY/MM/DD
HH:MM:SS format. The RTC is connected to its
own battery so that the date and time information
are not lost when main power is removed from the
datalogger. Time data appended to analog inputs
values providing a unique text string for each
measurement
Data capturing interval selected by the user. It is
not expected that the students (especially the
younger ones) will be familiar with terms like
“refresh rate”, “frequency”, “period”, “time
interval” e.t.c. To overcome this shortage before
every new measurement cycle we prompt a
message to the user asking “how many times per
hour” and waiting for the user input (using
Up/Down keys). Under this approach teachers can
easily explain more practically how the
measurement sequence evolves (i.e. the number 6
means that the datalogger is going to measure
every 10min). The hour basis was selected as a
compromise between rapid measurements (e.g.
sound, luminosity) and slower ones (e.g.
temperature, humidity). Since the system is open
source, in the provided software code, the teacher
can easily change the capturing interval (i.e. by
setting it in a per minute basis) as well as the
prompt message.
Data storage. The use of SD card except its
obvious function of saving data offers two
alternative impacts on hands-on approach: On one
hand it provides an excellent springboard to the
teacher in order to demonstrate (i.e. through
educational gaming: “Spies and Secret Agents”
where the precious SD cards hold the important
DevelopingOpenSourceDataloggersforInquiryLearning
557
data) to students the difference between the
instrument (e.g. the “system that measures”) and
the results (e.g. the “data”). On the other hand the
datalogger is capable for field measurement
installations where the students can exchange the
SD cards in predefined times (e.g. Weekly outdoor
temperature measurements with SD card switching
every morning in order to examine previous day’s
measurements).
Battery operated. The datalogger is powered from
a 9V rechargeable battery. This is not mandatory
since the datalogger designed in such a way that
can accept power with minimum at 7V and
maximum at 15V in any kind of popular formats
(NiCd, NiMH e.t.c). There is also provision for the
use of photovoltaic cells as power module
providing in this way easy, long term, installations
for field measurements.
3.2 Medimnos Prototype
This is the prototype that implemented using cost
minimization as major design consideration .The
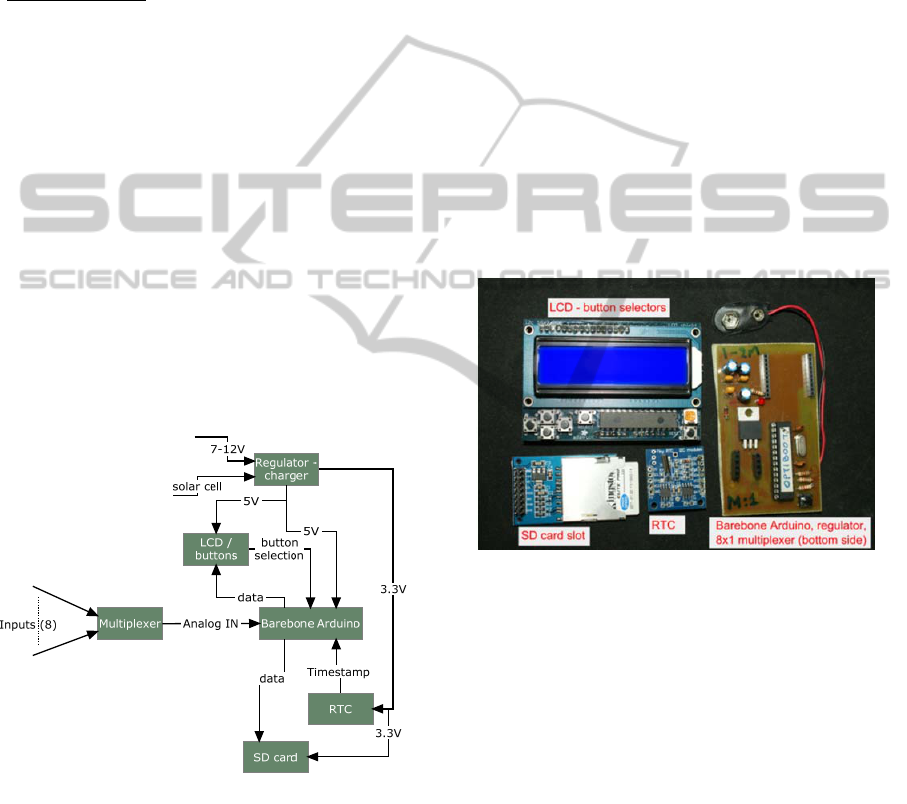
modular view of this datalogger is shown on Fig.1.
The main components of this prototype is a
“barebone” Arduino board, a SD Card module, a
RTC module, a voltage regulator, a 8X1 input
multiplexer and monochrome LCD screen (Fig.2)
Figure 1: Modular view of Medimnos datalogger.
The sequence of actions for the student is
straightforward (italics in parentheses are
explanations of user actions) as below:
i) Startup (Toggle On/Off switch – Welcome
message appears)
ii) Measurement quantity selection (using
Up/Down buttons).
iii) Define measurement repetition (response to
question “how many times per hour” by means
using Up/Down buttons)
iv) Selection of concurrent measurement (response
to question “Add measurement ?” by means using
Up/Down buttons). “Yes” means return to Step ii)
while “No” means go to next Step
v) Start Measurement (user prompted with a
message “Ready? Press Start” in order to start
measurement sequence)
Termination of measurements is achieved by
pressing “Stop” button.
Data recorded in SD card as text files. Their
names are in format
dataYYYYMMDDHHMMSS.txt, where the
values derived from the timestamp of 1
st
measurement. Every new measurement creates a
new file. Inside the text file data are appended in
tabular format with one header row, as below:
Date Time Temp Humidity Sound
2013/12/14 18:39:45 23.5 45 40
2013/12/14 18:41:45 23.4 45 52
2013/12/14 18:43:45 23.4 46 61
Figure 2: The main components of Medimnos prototype.
The tabulated format allows rapid import to all post-
processing software (e.g. MS-Excel, OpenOffice
e.t.c).
As long as the datalogger measures, the values of
all the measuring quantities (i.e per analog input)
displayed on LCD screen. The refresh rate of display
is the same with measurement’s rate if this is not
smaller than 30secs. If this is not happens (i.e. in
frequent measurements) then the displayed value is
the average value for the last 30secs of the
measurement. This is done fully automatically and
after the 30secs interval the current (or the averaged)
value of the next measurement quantity is displayed.
Under this approach every value is displayed for
30secs and if all the 16 analog inputs will be used
8mins required. Anytime the user can push the
Left/Right buttons in order to see the value of
Previous/Next measuring quantity without waiting
CSEDU2014-6thInternationalConferenceonComputerSupportedEducation
558
30secs for automatic switching.
3.3 Kyathos Prototype
This prototype uses an Arduino UNO board, a SD
Card module, a RTC module, a voltage regulator, a
16X1 input multiplexer and a 1.8” color TFT screen
with resolution 160x120 pixels with joystick
selector. The Kyathos prototype can provide the
values of all the measuring channels at the same
time in TFT screen and these values can be colour
marked (i.e. if a specific threshold is exceeded the
presented value can be presented with red color) as
presented in Fig.3.
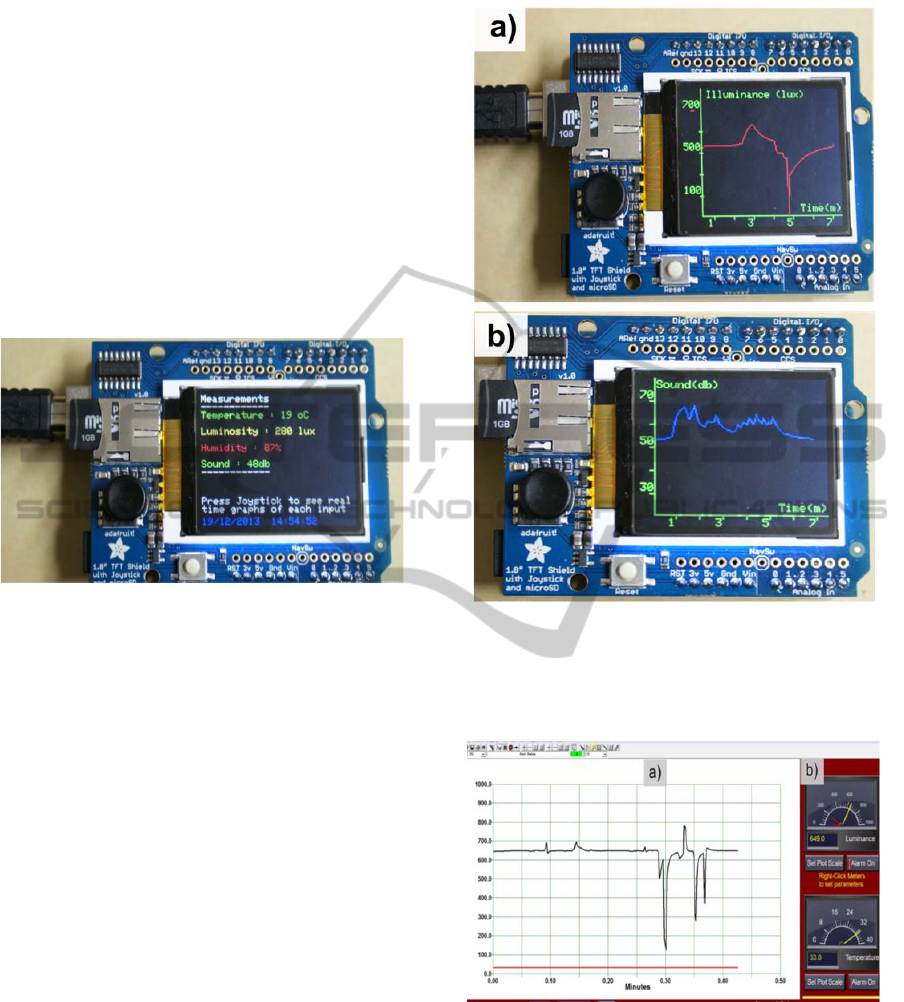
Figure 3: Acquired values’ textual presentation screen for
Kyathos prototype. Values are color coded (Red: over
upper limit; Yellow: below lower limit; Green: beyond
limits) and time stamped (blue message at bottom).
In addition, student is able to see additional screen
plots with real time graph (Fig.4) of each the
measurement quantity gathering in this way a
preliminary but rapid view of quantity’s behaviour.
Effective visualization therefore reveals the meaning
of data at several levels of detail, initially from a
broad overview to the fine structure after data
processing. This approach was selected since
psychologists and education researchers very early
proved the vital role of visual imagery in the
processing of information (Bishop, 1989; Del
Grande, 1990; Dreyfus, 1991; Presmeg, 1986; 1992)
while problem-solving models (Goldin, 1987;
Lowrie and Hill, 1996; Pirie and Kieren, 1991;
1992) have emphasized the role that imagery plays
in the processing of information.
Simultaneously with screen presentation data
sent to USB port providing in this way a route to real
time data visualization in PC. At this point the
students were able to see real time display of their
measurements.
A free for educational use software packages like
Stampplot (www.stampplot.com) can recognize the
data stream from USB port and present it in familiar
Figure 4: Real time graphs of measuring quantities from
Kyathos prototype. Each graph hosts the values from one
input (the measuring quantity signed on top left) while the
student can subsequently transferred between graphs using
joystick’s left/right selections.
Figure 5: Real time presentation of acquired values that
sent over USB in real time using Stampplot software: a)
Data from channel 1 and b) data from channel 1 (top
gauge) and channel 2 (bottom gauge).
ways to the students (i.e. like gauges or indicators)
as presented in Fig.5.
Obviously the teachers are free to select any
other alternative freeware solution (i.e LiveGraph,
qSerialTerm, JGraph, Kst) since the data stream that
is sent over USB is fully configurable in the
DevelopingOpenSourceDataloggersforInquiryLearning
559
provided Arduino codes. The remaining
characteristics (SD card storage, sequence of
measurement actions) remain the same as Medimnos
except the use of joystick as selector instead of push
buttons.
3.4 Kotyli Prototype
Mobile, handheld technology has become the
leading trend of daily routine and the integration of
touchscreen technology into mobile handheld
devices is quickly becoming equally common. Based
on this fact it is not unlikely to consider that students
has become more familiar with touch screens rather
than develop corresponding computer skills (i.e.
keyboard input, mouse handling e.t.c.) for data
input. Increasing usability and easiness led to the
current prototype solution that is based on
Medimnos prototype except that color TFT screen
replaced with a 3.2” resistive touch screen. Resistive
touch screens are pressure sensitive, so they can be
operated with any input device, including a gloved
hand or stylus. A solution like the above provide the
flexibility to design custom graphics and user input
interfaces thus increasing the adaptability of the
datalogger to various hands-on projects (e.g. results
of temperature measurements can be presented in a
thermometer gauge). All the graphics can be
designed in accompanying comprehensive software
IDE for Microsoft Windows that provides an
integrated software development platform for all.
Buttons, labels, dials, gauges, input and backgrounds
can be easily created using drag-n-drop actions
Upon completion the user uploads the graphics and
the relevant Arduino code is generated
automatically.
An additional feature that added to Kotyli
prototype is the use of predefined experiment
templates. A set of common experiments (i.e.
temperature measuring with one or two sensors, pH
measurements, voltage measurements of common
type batteries, solar activity during one day e.t.c.).
To enhance the use of this feature a visual open
source language for programming, Minibloq
(http://blog.minibloq.org/) was selected in order to
release teachers from configuring the Arduino using
textual programming. Once installed, the program
uses the usual drag-and-drop blocks editor style of
working. The novel features are that there is
simulation of the hardware and the code
corresponding to the visual program can be seen in
another window. Creation of new blocks is possible
and this is the feature that used for uploading
predefined experiments. Minibloq can be used also
for any other procedure (i.e. uploading new
datalogger firmware or design new experiment) as
described in Medimnos and Kyathos prototypes. A
representative screenshot form is presented in Fig.6.
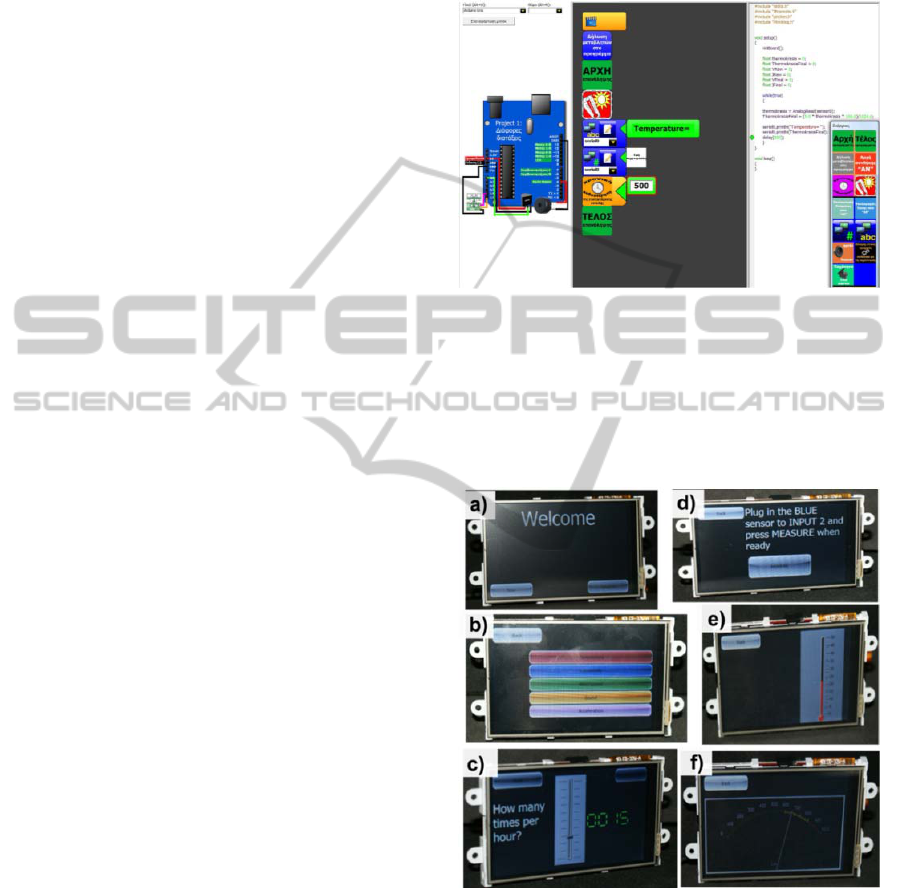
Figure 6: Definition of new experiments using Minibloq
visual programming language. The teacher selects
predefined experiment blocks (from toolbar at bottom
right) and drags them to the central panel. Possible
configurations can be made by clicking graphical objects.
Concurrently the corresponding Arduino code is presented
at right panel while at the left panel a hardware view of
Arduino connections is depicted.
Figure 7: Sequence of basic actions for Kotyli datalogger
as presented in resistive touch screen: a) Selection of new
or existing template for measurements, b) Selection list of
available channels (in case of “New” measurement), c)
Definition of measurement repetition (slider control), d)
Prompting for sensor attachment and start measurement, e)
Results in form of indicator f) Results in form of dial
gauge.
The measurement sequence is slightly altered in
relation with previous two dataloggers. Initially the
CSEDU2014-6thInternationalConferenceonComputerSupportedEducation
560

Table 2: Examples of inquiry based activities by means of proposed dataloggers.
Activities’ aspect Level Used sensors
Sound proofing, Sound sources
Primary
Microphone
Light passing, reflection materials Photoresistor
Sun as a source of heat & light Photoresistor, Temperature
Insulation , Heat Energy In / Out Temperature
Distance & Proximity measures Sonar
Motion classification Accelerometer
Energy Harvesting
Secondary
Voltage/current
Water quality pH
Endothermic reactions Temperature
Testing Sunglasses UV photodetector
Crushing & Centripetal force, Tensile strength Force
Environment & pollution Gases - Dust
Weather prediction Barometric – anemometer - humidity
Renewable resources (sun, water , wind) Flow - Voltage - Solar - anemometer
student is asked if he wants a new or a predefined
experiment. In case of predefined experiment button
is pressed a list is loaded and the student just selects
one from the list. In case of new experiment
selection, a new screen asks the student to select the
desired measuring quantity. The student selects by
pressing the corresponding button and the next
screen used for the definition of measurement
repetition (question “how many times per hour”).
After this, a message “Add measurement?” is
appeared, providing the student the opportunity to
append another quantity in measurement sequence.
Next a screen appeared with a prompt message (in
which port the sensor must be inserted) and a
“Measure” button. Finally the results of the
measurements presented as dials or gauges in real
time. The whole sequence in screenshots is
presented in Fig.7.
4 DIDACTIC UNIT EXAMPLES
The proposed experimental prototypes can be easily
imported to STEM oriented class courses. Following
an inquiry based approach students can experiment
using their educational dataloggers as proposed in
Table 2.
5 CONCLUSIONS
The design of an Arduino based portable datalogger
devices has been described. The choice of Arduino
as the core platform dictated from its suitability for
starter projects, its cost and durability, a thriving
community offering support and ideas and a
maturity that is rare in open source solutions. Along
with the programming easiness it seems that
Arduino platform will prevail very shortly as the low
cost solution even for educational projects. The
three presented prototypes share some common
features (Plug & Play colour coded external sensors
Real time clock, Data capturing interval selected by
the use, Data storage on an SD card for offline
analysis, Battery operated) but each one has its own
additional and unique features: Medimnos prototype
implemented as low cost solution, Kyathos focus on
real time presentations of results by sending data
over USB and presented them at the same time in a
color TFT screen (as independent values or as real
time graphs) while Kotyli designed using the
increasing usability and easiness as major
determinants (using resistive touch screen and
animated graphics for data presentation). Regarding
Kotyli, the obvious comparison with Smartphones or
Tablets, highlights its two main advantages against
them: the fully configurable user interface (through
open source solutions) and the sensors’ plug-n-play
capability (without using the USB port).
The intention of the authors is that the proposed
implementations will act as starting points for
adaptive designs to several curricula since the open
source character of the designs ensures that this is an
ongoing research. Along with the availability of
Arduino codes it not overweening to claim that this
open source platform will be accompanying the
educational system for the next years.
REFERENCES
Banzi, M., 2011. Getting Started with Arduino, OReily -
Maker Media, Inc; Second Edition.
DevelopingOpenSourceDataloggersforInquiryLearning
561

Bishop, A.J., 1989. Review of research on visualization in
mathematics education, Focus on Learning Problems
in Mathematics, 11 (1), 7-11.
Del Grande, J., 1990. Spatial sense. Arithmetic Teacher,
37 (6), 14-20.
Dreyfus, T., 1991. On the status of visual reasoning in
mathematics and mathematics education, 15th
Psychology of Mathematics Education Conference.
Assisi, Italy.
European Commission, 2007, Science Education Now, A
Renewed Pedagogy for the Future of Europe.
Available at: http://ec.europa.eu/research/science-
society/document_library/pdf_06/report-rocard-
onscience-education_en.pdf (last accessed January
2014)
Gras-Velαzquez, J., Joyce, A. and Debry, M., 2009. White
paper: Women and ICT – Why are girls still not
attracted to ICT studies and careers?, Available at:
http://blog.eun.org/insightblog/upload/Women_and_I
CT_FINAL.pdf, [last accessed January 2014]
European Table of Industrialists, 2009. The Mathematics,
Science and Technology Education report, the case for
a European Coordination Body. Available at:
http://www.ert.be/DOC/09113.pdf (last accessed
January 2014)
Goldin, G. A., 1987, (a) Levels of language in
mathematical problem solving; (b) Cognitive
representational systems for mathematical problem
solving, In C. Janvier (Ed.), Problems of
representation in the teaching and learning of
mathematics (pp. 59-65 & 125-145). Hillsdale, NJ:
Lawrence Erlbaum Associates.
Gipps, J., 2001. Data Logging and Inquiry Learning in
Science, Australian Computer Society, 7
th
World
Conference on Computers in Education, Copenhagen,
July 29-August 3.
Hloupis, G., Stavrakas, I., Moutzouris, K., Alexandridis,
A.; Triantis, D., 2012. WSN Open Source
Development Platform: Application to Green
Learning, Procedia Engineering 25, pp. 1049-1052.
Hodson, D., 1998. Teaching and Learning Science:
Towards a personalized approach, Buckingham Open
University Press.
Lowrie, T., & Hill, D., 1996. The development of a
dynamic problem-solving model, Journal of Science
and Mathematics Education in Southeast Asia, XIX
(1), 1-11.
McCormarck, A., 2010. The e-Skills Manifesto, A call to
arms. Available at: http://files.eun.org/eskillsweek/
manifesto/e-skills_manifesto.pdf (last accessed
January 2014)
McRoberts, M., 2010. Beginning Arduino, Technology in
Action series, Apress.
Noble, J., 2012. Programming Interactivity, O'Reilly
Media; Second Edition.
Osborne, J. and Dillon, J., 2008. Science education in
Europe: critical reflections. Available at: http://
www.pollen-europa.net/pollen_dev/Images_ Editor/
Nuffield%20report.pdf (last accessed January 2014)
Osborne, J., & Hennessy, S., 2003. Literature Review in
Science Education and the Role of ICT: Promise,
Problems and Future Directions, NESTA FutureLab
series, (Report 6), 1-41.
Oxer, J. and Blemmigs, H., 2009. Practical Arduino,
Technology in Action series, Apress.
Pirie, S., & Kieren, T., 1991. Folding back: Dynamics in
the growth of mathematical understanding. In F.
Fulvinghetti (Ed.), Proceedings of the 15th PME
Conference (Vol. 3, pp. 169-176). Italy: Program
Committee for the International Group for the
Psychology of Mathematics Education.
Pirie, S., & Kieren, T., 1992. Watching Sandy’s
understanding grow, Journal of Mathematical
Behaviour, 11, 243-257.
Presmeg, N. C., 1986. Visualization in high school
mathematics, Learning of Mathematics, 6 (3), 42-46.
Presmeg, N., 1992. Prototypes, metaphors, metonymies
and imaginative rationality in high school
mathematics, Educational Studies in Mathematics, 23
(6), 595-610.
Rogers, L., & Wild, P., 1994. The use of IT in practical
science - a practical study in three schools, School
Science Review, 75(273), 21-28.
US Department of Commerce, Economics & Statistics
Administration, 2011. STEM: Good Jobs Now and for
the Future.
CSEDU2014-6thInternationalConferenceonComputerSupportedEducation
562
