
Battery Charge and Discharge Optimization for Vehicle-to-Grid
Regulation Service
Wook Won Kim, Hong Yeul Shin, Je Seok Shin and Jin O. Kim
Department of Electrical Engineering, Hanyang University, Seoul, Korea
Keywords: Regulation, Plug-in Electric Vehicles, Battery.
Abstract: Electric vehicles should be connected to power system for charge and discharge of battery. Besides vehicle's
battery is charged for a power source, it is also reversibly possible to provide power source from battery to
power system. Researches on battery usage for regulation resources have been progressed and could cause
cost increase excessively because they distribute regulation capacity equally without considering the battery
wear cost of SOC, temperature, voltage and so on. This causes increase of grid maintenance cost and
aggravate economic efficiency. In this paper it is studied that the cost could be minimized according to the
battery condition and characteristic. The equation is developed in this paper to calculate the possible number
of charge and discharge cycle, according to SOC level and weighting factors representing the relation
between battery life and temperature as well as voltage. Thereafter, the correlation is inferred between the
battery condition and wear cost reflecting the battery price, and the expense of compensation is decided
according to the condition on battery wear-out of vehicle.
___________________________
*
Corresponding Author
1 INTRODUCTION
Interest in energy conservation and the environment
increases, the technology (Electric Vehicle, EV) of
electric vehicles has been developed rapidly, attempt
of practical use have been carried out consistently.
Cooperation of the power grid connection for
charging the battery as a power source in the
practical use of electric vehicles is essential.
Therefore, vehicle to grid has been studied about the
characteristics of the battery of an electric vehicle
and utilization of charging and discharging.
Especially, it is possible to improve the quality of
power by using battery for ancillary service. For
ancillary services such as regulation is required fast
response time. And it provides the actual power is as
small as about 10% compared to contract capacity
ratio. Therefore, EV battery is suitable for providing
the regulation service. Thus, when it comes to
providing regulation service using the battery of an
electric vehicle, additional charging and discharging
are needed without charging and discharging for
running EV. Additional charging and discharging of
battery is responsible for the reduction of battery life
time. Cost for the decrease in battery life due to
additional operation is compensated in the form of
incentives for vehicle system operator is
participating in V2G services. Providing regulation
service using EV leads to a reduction in revenue by
increasing the operating costs. Therefore, in this
paper, life time cost is estimated by using the
relationship between battery life according to
voltage, temperature and cycling characteristics of
the DOD(Depth of Discharge) of the lithium-ion
battery. And regulation service scheme that
minimizes life time cost is proposed.
2 MODELING OF EV
2.1 Battery of Electric Vehicle
In this paper, the characteristics of lithium-ion
batteries which are used the most widely in EV are
considered for simulation. Capacity of lithium-ion
battery has 10-20kWh generally. This capacity
makes it possible to drive about 150km. The
charging time of battery takes 6-7 hours from 20%
to 100% of SOC. The number of cycle is evaluated
about 1000. And price of battery is $800 per kWh.
113
Kim W., Yeul Shin H., Shin J. and O. Kim J..
Battery Charge and Discharge Optimization for Vehicle-to-Grid Regulation Service.
DOI: 10.5220/0004963101130117
In Proceedings of the 3rd International Conference on Smart Grids and Green IT Systems (SMARTGREENS-2014), pages 113-117
ISBN: 978-989-758-025-3
Copyright
c
2014 SCITEPRESS (Science and Technology Publications, Lda.)

2.2 Cycle Characteristics
of Lithium-Ion Battery
The main factors that affect the lifetime of the
lithium-ion battery are a level of SOC charge and
discharge, temperature, voltage, and time. In this
section, equation is shown in the cycle of the battery
considering four factors described above.
The possible number of times of charge and
discharge of an electric vehicle battery is dependent
on the SOC. And it is shown as in (1).
0.795
694(1 )LSOC
(1)
Battery cycle is assumed 1 cycle when battery is
repeated charge or discharge as 20% of SOC. It is
possible to calculate the number of cycles when the
SOC is increasing or decreasing linearly by using
(1).
The equation of battery cycle can be changed by
the form of equation about the number of cycle
using (1) and assumption. And it is shown in (2).
0.795
,
0.795 0.795
11
0.5 (0.8)
1( ()) 1( ( 1))
it
ii
n
SOCt SOCt
(2)
Life factors are associated with the temperature of
the battery, voltage and time to use that is
represented by (3), (4) and (5).
0
0
()
1
VV
TT
V
T
aV T
init
Ct
cc c t
C
(3)
35
23
( ) 1.031 3.685 0.2156
0.1178 0.3201
SOC
VSOC e SOC
SOC SOC
(4)
(,) exp( )
2
cos( 0.77 )
2
av am
Txt T T x
a
txC
a
(5)
It is possible to obtain the integrated expression of
the cycle of the battery (6) in consideration of the
temperature, voltage and time at which the SOC is
changed.
0
0
()
(,)
,,
VSOC V
Txt T
V
T
VT
it it
Nnc c t
(6)
2.3 Lifetime Cost of Battery
Lifetime cost of battery is calculated by (7).
,
20%
Tn
it bat
total
ti
NP
C
L
(7)
P
bat
is the mean cost of EV battery. And L
20%
means the total possible number of battery cycle.
The minimum SOC is required because of the
unexpected use of EV and decreasing the battery life
time from full discharge. Therefore, the constraint of
SOC is show in (8)
min,
arg
()
0.8
1
toff
ch e
SOC t T
T
(8)
3 REGULATION SERVICE BY EV
3.1 Estimation of Regulation
In order to keep the balance at all times, power
generation is controlled automatically to compensate
supply and demand for the difference between the
predicted demand and the actual demand. In this
paper, the calculation of regulation demand is
estimated by the actual loads and 5-minute schedule
model to compensate difference.
Figure 1: The Concept of Regulation.
3.2 Algorithm for Regulation Service
Figure 2 shows flow chart about charging process of
the battery management and the provided regulation
power. As shown in the flow chart, each plug-in EV
has the order of priority to supply regulation service
according to voltage, temperature and SOC when a
regulation signal is provided every minute. Then,
regulation power is provided differentially according
to the order of priority if SOC is satisfied SOC
min,t
.
At the end, it starts operation again without the
vehicle removing the plug-out the system. If
vehicles are newly connected, the process is
repeated. In the proposed process, there is a
difference to distribute the amount of regulation
service to each vehicle to compare with the
SMARTGREENS2014-3rdInternationalConferenceonSmartGridsandGreenITSystems
114
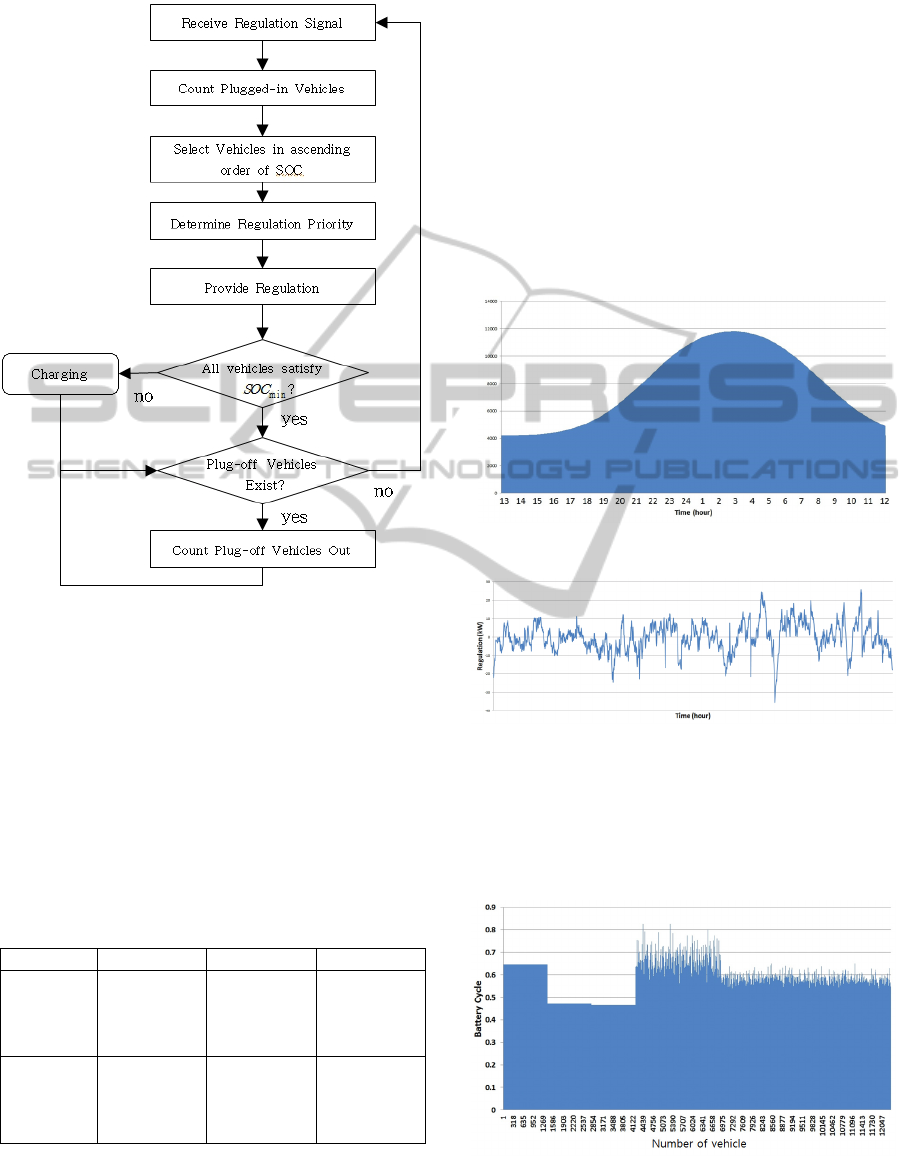
conventional method.
Figure 2: The Proposed Flow Chart of Regulation.
4 CASE STUDY
4.1 Background of Case Study
In the case study, it was applied to a vehicle of
12,329 units that provides battery power regulation
of the electric vehicle for simulating the operational
scheme. There are three scenarios in the case study
that is shown in table2.
Table 1: Characteristics of EV.
Scenario A B C
Time to
start
regulation
service
As soon as
(connected
to grid)
According
to SOC
According
to SOC and
condition of
battery
Amount
of
regulation
to EV
equally
differentiall
y
differentiall
y
To simulate by applying the operational scheme that
was presented in this paper, consider the operation
situation that target the users of the EV. The total
number of vehicles is 12,329 units. 58% are used for
commuting, 30% are used for leisure, remainder are
used for business. Assuming the vehicle is used for
commuting to be interconnection to the grid from
attendance to closing hour during the week and is
not connected during the weekend. The vehicle used
for leisure is always connected except weekend. It
was assumed that commercial vehicle, did not
participate in the regulation service because works
always use the car. Thus, considering time to
connected, estimated number of grid-connected EV
is shown in figure 3 using normal distribution. And
regulation demand is also shown in figure 4.
Figure 3: The number of grid-connected EV.
Figure 4: Regulation Demand.
4.2 Results of Scenarios
Figure 5-10 show that change of SOC and cycle of
battery by each scenario
.
Figure 5: Battery Cycle(Scenario A).
BatteryChargeandDischargeOptimizationforVehicle-to-GridRegulationService
115
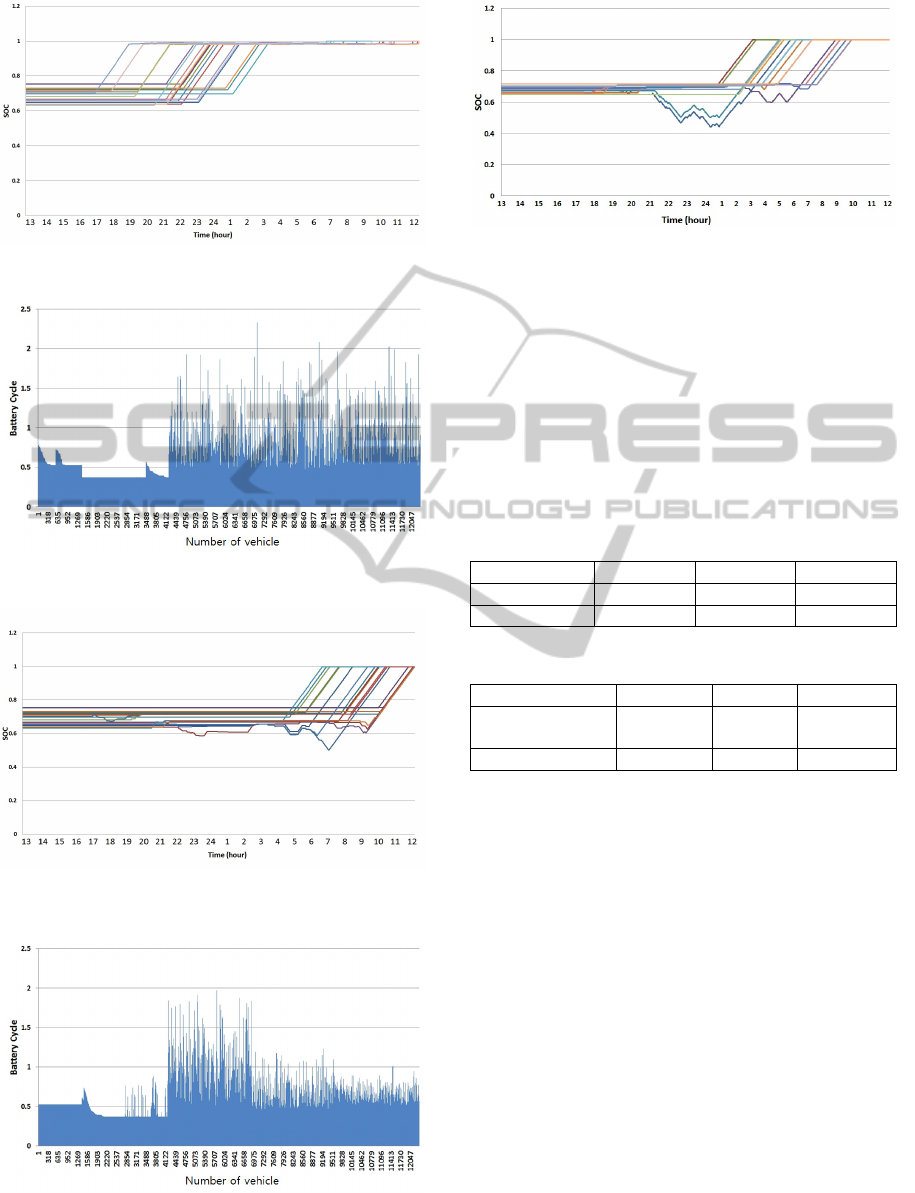
Figure 6: Change of SOC (Scenario A).
Figure 7: Battery Cycle(Scenario B).
Figure 8: Change of SOC (Scenario B).
Figure 9: Battery Cycle (Scenario C).
Figure 10: Change of SOC (Scenario C).
Figure 5-10 show that charge and discharge schedule
is changed in various ways depending on each
scenario. According to previous studies, the
repetition of charge and discharge in high level of
SOC adversely affects to the battery life. However,
the proposed method brings a reduction life cost
because it provides the regulation service while the
level of SOC is low. The overall results are
represented by the tables 2 and table3.
Table 2: Lifetime Cost.
Scenario A B C
Battery cycle 6,497.7 6,073.8 5,987.8
Cost($) 97,465 91,108 89,817
Table 3: Benefit between Each Scenario.
Scenario A/B B/C A/C
Deference of
Benefit($)
6,357 1,291 7,648
Improvement(%) 6.52 1.42 7.85
It was confirmed that the differentially division of
regulation service corresponding to the SOC has a
major impact on reducing life time costs through the
improvement ratio between each scenario. And
additional reduction of cost occurs according to
consider voltage and temperature.
5 CONCLUSIONS
In this paper, life time cost is estimated by using the
relationship between battery life according to
voltage, temperature and cycling characteristics of
the DOD(Depth of Discharge) of the lithium-ion
battery. And management scheme for regulation
service to minimize the cost of battery life time is
proposed. The proposed method decreases total cost
without additional investment of infrastructures.
Also, it can be applied to batteries of other types
according to its characteristics. In addition to
SMARTGREENS2014-3rdInternationalConferenceonSmartGridsandGreenITSystems
116

regulation service, it can be extended to another
ancillary service, load levelling and cost
optimization.
ACKNOWLEDGEMENTS
This work was supported by the National Research
Foundation of Korea(NRF) grant funded by the
Korea government(MEST) (No. 2011-0017064).
REFERENCES
Jasna Tomic, Willett Kempton, "Using fleets of Electric-
drive vehicles for grid support", Journal of Power
Source 168, 2007.
Chengke Zhou, Kejun Qian, Malcolm Allan, Wenjun
Zhou, "Modeling of the Cost of EV Battery Wear Due
to V2G Application in Power Systems", IEEE Trans.
on energy conversion, Vol.26, No.4, 2011.
Madeleine Ecker, Jochen B. Gerschler, Jan Vogel, Stefan
Käbitz, Friedrich Hust, Philipp Dechent, Dirk Uwe
Sauer “Development of a lifetime prediction model for
lithium-ion batteries based on extended accelerated
aging test data” Journal of Power Source 215 (2012)
248-257.
Min Chen, Gabriel A. Rinc´on-Mora, “Accurate Electrical
Battery Model Capable of Predicting Runtime and I–V
Performance” Ieee Transactions on Energy Conversion,
vol. 21, No. 2, June 2006.
"Integration of Renewable Resources: Technical
Appendices for California ISO Renewable Integration
Studies" October 11, 2010.
CAISO, Grid data (Online). Available:
http://www.caiso.com/2b3e/2b3ed83725ee0.csv 2010.
BatteryChargeandDischargeOptimizationforVehicle-to-GridRegulationService
117
