
Cooperation Strategies for Multi-user Transmission in Manhattan
Environment
∗
Jaewon Chang and Wonjin Sung
Department of Electronic Engineering, Sogang University, 1 Sinsu-dong, Mapo-gu, 121-742 Seoul, Korea
Keywords:
Cooperative Transmission, MU-MIMO, CoMP, Manhattan Environment.
Abstract:
One of the major drawbacks for wirelesscommunication systems in Manhattan environment with tall buildings
lining both sides of the streets is the performance degradation caused by the penetration loss and the effects of
inter-sector interference. To overcome such a degradation, cooperation among the sectors is under an active
investigation as an efficient means to provide an enhanced coverage as well as increased spectral efficiency. In
this paper, we describe various type of cooperation sector location for cooperative multi-user transmission, and
determine cooperation strategies for the cooperative operation among sectors by evaluating and comparing the
types of microcell in Manhattan environment. The results shows that the more suitable number of cooperation
sectors is determined by signal-to-interference plus noise ratio (SINR), outage probability, and throughput
comparison. Performance variations based on different numbers of sector density under cooperation are also
presented to suggest an efficient inter-sector cooperative transmission strategy in Manhattan environment.
1 INTRODUCTION
In wireless communication systems, mobile user’s
demands are rapidly increasing for high data rate
and quality network services in urban areas. Ur-
ban micro-cellular system in Manhattan-like environ-
ment have difference features, compared with macro-
cellular systems. The micro-cellular network requires
higher system capacity for the dense traffic channel,
where a significant amount of access users to wireless
link occurs. The micro-cellular system is developed
in the metropolitan area, where tall buildings are ag-
gregated and lined both sides of the streets. Thus, the
propagation models of line-of-sight (LOS) and non
line-of-sight (NLOS) wireless channel between base-
stations (BSs) and mobile-stations (MSs) are adopted
for practical performance investigations.
The performance evaluation of micro-cellular net-
works in Manhattan-like environment and related
works have been widely studied. Standardization
groups of IEEE802.16m and 3GPP-LTE advanced
are also developing the next generation cellular sys-
tems considering Manhattan environment. Capacity
and interference statistics of street cross-shaped mi-
cro cells is analyzed in (Ahmed, 2003), and spatial
∗
This work wassupported by the grant from the National
Research Foundation of Korea (NRF) funded by the Korean
government (MEST) (no. 2011-0016146).
multiple-input multiple-output (MIMO) channel ca-
pacity statistics in Manhattan environment are repre-
sented (Chizhik, 2003). The efficient resource con-
trol and channel allocation method are also proposed.
Considering user mobility characteristics, the perfor-
mance focused on average number of handoffs has
been analyzed by (Cho, 2000). The propagation
model and deployment strategies of transmitters was
suggested in (Chiu, 2009), and multi-hop relay net-
works in Manhattan-like environment is investigated
in (Fu, 2007). However, these studies are based on the
non-cooperative operation among BSs without con-
sidering the cooperativetransmission and interference
mitigation.
In this paper, we present the efficient coopera-
tion strategy in Manhattan environment from the per-
formance investigation of the cooperative multi-user
transmission. First, the various cooperation strategies
are presented as increasing the number of coopera-
tion sector antennas, where the uniformly distributed
MSs are located along the cross shape street consider-
ing the urban micro-cellular model of IEEE802.16m
system. For the different BS density in this environ-
ment, cooperation scenarios according to the cooper-
ation sector antenna variation are also described. Sec-
ond, the presented cooperation strategies are applied
to cooperative multi-user transmission using zero-
forcing beamforming and their performance in terms
415
Chang J. and Sung W..
Cooperation Strategies for Multi-user Transmission in Manhattan Environment.
DOI: 10.5220/0004970304150419
In Proceedings of the 16th International Conference on Enterprise Information Systems (ICEIS-2014), pages 415-419
ISBN: 978-989-758-028-4
Copyright
c
2014 SCITEPRESS (Science and Technology Publications, Lda.)
of signal-to-interference plus noise ratio (SINR), out-
age probability, and throughput is compared, with an
aim of determining a feasible cooperation strategy in
Manhattan environment. Third, the performance vari-
ations based on different numbers of BS density and
the cooperative multi-user transmission scheme are
evaluated, to confirm the performance manner in dif-
ferent operational settings.
The organization of the paper is as follows. Sec-
tion II gives the system model for the cooperative
multi-user transmission and the propagation model in
Manhattan environment. In Section III, cooperation
scenarios are explained as the variation based on the
number of cooperation sector antennas and BS den-
sity. The performanceresults are compared and inves-
tigated in Section IV. Concluding remarks are given in
Section V.
2 SYSTEM MODEL
2.1 Channel Propagation Model
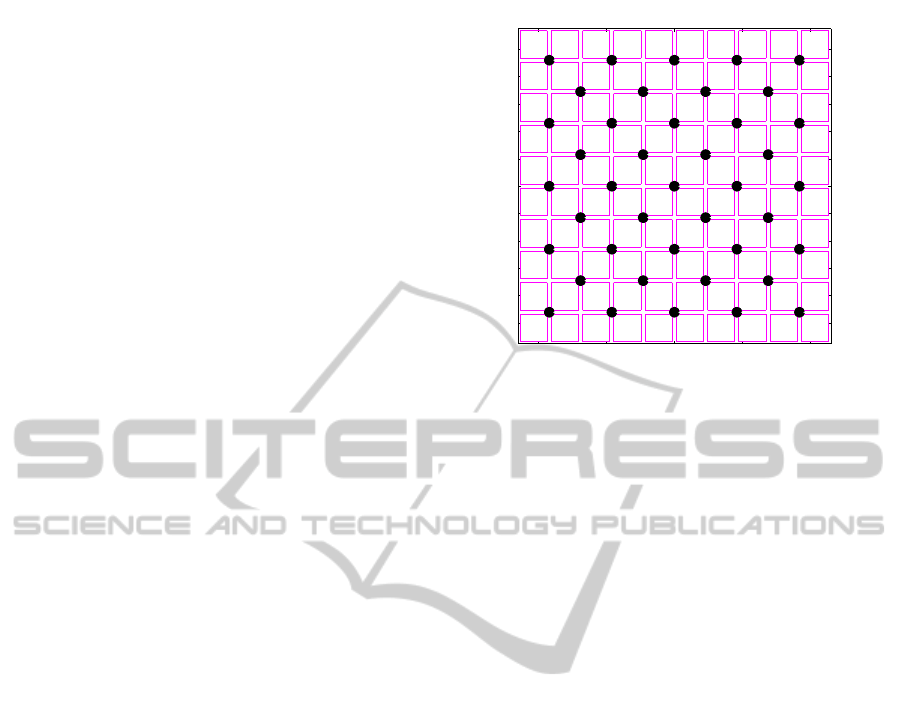
Manhattan network consists of 100 buildings and 41
BSs with 4-sector antennas, as shown in Fig. 1. The
building block size is 200m × 200m and the street
width are set to be 30m. BSs are located at the main
street-crossing, which are positioned at every two in-
tersection (BS density η = 1/2). A BS with 4-sector
antennas covers 4 building blocks including a cross-
shaped area and a cell coverage is about 430 × 430
square meters. All cooperative BS sets are assumed
to use the same multi-user transmission scheme. MSs
located uniformly distributed along streets and never
enter the buildings considering outdoor environment
only.
2.2 Signal Model
We consider downlink transmission from sector BSs
with single transmit antennas to target MSs equipped
with single receive antennas in Manhattan environ-
ment. For the cooperative multi-user transmission us-
ing N
S
sector BSs, the i-th sector antenna of the l-th
cooperation set is denoted by BS
(l)
i
, and MS
(l)
k
de-
notes the k-th MS among N
M
MSs communicating
with a given l-th group of cooperating sector BSs.
In general, the signal model for a cooperative
multi-user transmission with N
S
single antenna sec-
tors and N
M
single antenna MSs is given by
r = H
(c)
W
(c)
s
(c)
+
∑
l6=c
H
(l)
W
(l)
s
(l)
+ n (1)
−1 −0.5 0 0.5 1
−1
−0.8
−0.6
−0.4
−0.2
0
0.2
0.4
0.6
0.8
1
Distance [km]
Distance [km]
Figure 1: Manhattan deployment scenario.
where l denotes the index of the cooperation set, and
H
(l)
, W
(l)
, and s
(l)
are the N
M
× N
S
channel matrix,
corresponding N
S
× N
S
precoding matrix for the co-
operative multi-user transmission, and N
S
× 1 trans-
mit signal vector from the cooperative BSs of the l-th
cooperation set, respectively. n denotes an additive
white Gaussian noise (AWGN) vector and c is the in-
dex of the desired cooperation set.
2.3 MIMO Transmission
Cooperative ZF. In this paper, we consider the co-
operative multi-user transmission using zero-forcing
beamforming. By utilizing the pseudo-inverse ma-
trix W = H
H
(HH
H
)
−1
for the channel matrix, zero-
forcing beamforming efficiently nulls transmission.
Cooperative zero-forcing beamforming is the
practical multi-user MIMO scheme for enhancing the
bandwidth efficiency with multiple data transmission
and mitigation of the multi-user interference, simul-
taneously. However, cooperative zero-forcing beam-
forming is not able to use full power transmission at
each sector which is subject to per antenna power con-
straints. It is shown that one of the sector antenna
among cooperativesectors always use full power. The
probability of signal power for the other sector an-
tenna is distributed at the transmit power range below
the normalized maximum power value ‘1’, and the
probability of the low power transmission increases
as the number of cooperation sectors. Thus, the
transmit signal from the other sectors, where a trans-
mit antenna utilizes lower transmit power than the
maximum value ‘1’, impairs the cooperative channel
gain and SINR performance of the cooperative zero-
forcing beamforming.
ICEIS2014-16thInternationalConferenceonEnterpriseInformationSystems
416
Cooperative ZF-DPC. Cooperative zero-forcing
dirty paper coding is a non-linear scheme for the
multi-user MIMO transmission, which can utilize the
full power transmission. For cooperative zero-forcing
dirty paper coding from N
S
sectors to N
M
multiple
MSs, the LQ decomposition of the channel matrix H
can be utilized to transmit the multiple data for mul-
tiple MSs, and dirty paper coded transmit signal nulls
out the inter-user interference signal. Using LQ de-
composition, can be decomposed as H = LQ, L is
N
M
×N
S
lower triangular matrix and triangular matrix
and Q is N
S
×N
S
unitary matrix. For cooperativezero-
forcing dirty paper coding, the diagonal elements of
the lower triangular matrix L are beamforming gain
and the unitary matrix Q can be used for W = Q
H
.
3 COOPERATION STRATEGIES
In Manhattan street environment, we consider the BS
collaboration which contains sector antennas to trans-
mit signal for MSs located at the outdoor street. At
the center of the intersection, 4-sector antennas of a
BS transmit signal to target MSs, and a target MS
can receive the desired sinal from a serving sector an-
tenna, when a MS is selected by scheduling among
uniformly distributed MSs in the coverage area of
each sector antenna. Thus, the number of coopera-
tive serving sectors is same as the number of target
MSs (N
S
= N
M
), and it is to be determined how many
sector antenna can be utilized for the efficient cooper-
ation strategy.
To determine the efficient cooperation strategy,
the SINR distributions are evaluated and compared
using the 2, 4, 8, and 16-sector cooperation models
using full frequency reuse. The signal is transmit-
ted from each sector with 40 dBm power over the
flat Rayleigh fading channel. The thermal noise of
−104 dBm power is added at the receiver, which
corresponds to 10 MHz transmission bandwidth of
2 GHz center frequency. We assume the MSs of in-
terest is located along the street of the coverage area
for a center cooperation group in Manhattan grid net-
work, and both the transmitter and receiver have the
perfect knowledge of the channel. Employing the co-
operative zero-forcing transmission, each cooperation
sector is subject to per antenna power constraints.
The topology of cooperative sector antennas and
collaboration strategies can be presented by various
scenarios according to the BS density (η) variation.
As the variation of the BS density, these topologies
of sector BSs for the cooperative transmission, which
is adopted for the regular pattern of the cooperation
group in entire Manhattan grid network, are chosen
−0.2 −0.1 0 0.1 0.2
−0.1
0
0.1
0.2
0.3
0.4
(a)
−0.2 −0.1 0 0.1 0.2
−0.2
−0.1
0
0.1
0.2
0.3
(b)
−0.2 −0.1 0 0.1 0.2
−0.2
−0.1
0
0.1
0.2
0.3
(c)
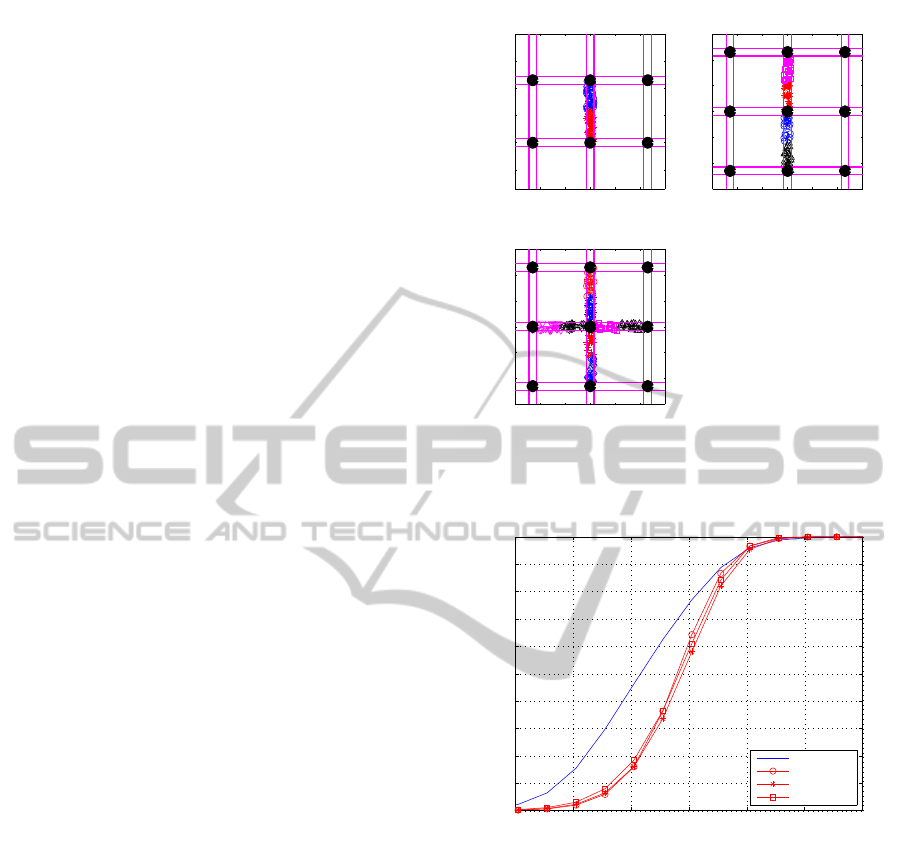
Figure 2: Cooperation scenarios for the BS density η = 1:
(a) 2-sector cooperation, (b) 4-sector cooperation, (c) 8-
sector cooperation.
−10 0 10 20 30 40 50
0
0.1
0.2
0.3
0.4
0.5
0.6
0.7
0.8
0.9
1
SINR [dB]
Cumulative Distribution Function
NCT
CT: 2−Sector
CT: 4−Sector
CT: 8−Sector
Figure 3: SINR performance for the cooperative zero-
forcing transmission (η = 1).
for the performance comparison.
Case I (η = 1). Considering the maximum BS den-
sity, Each BS is located at every intersection, where
the distance between the nearest two BSs is 230m. In
this case, a sector coverage is about 230× 100 square
meters including 100 × 30 street area. The topology
of 3 cooperation scenarios; (a) 2-sector collaboration
facing each other at edge points of the straight line
street, (b) 4-sector collaboration of 3 BSs located at
a center point and 2 edge points of the straight line
street, and (c) 8-sector collaboration of 5 BSs located
at a center point and 4 edge points of the cross-shaped
street area can be presented.
The cumulative distribution functions (CDFs) of
the SINR for cooperative zero-forcing beamforming
CooperationStrategiesforMulti-userTransmissioninManhattanEnvironment
417
−0.2 −0.1 0 0.1 0.2
0
0.1
0.2
0.3
0.4
0.5
(a)
−0.2 −0.1 0 0.1 0.2
0
0.1
0.2
0.3
0.4
0.5
(b)
−0.4 −0.2 0 0.2
−0.2
0
0.2
0.4
(c)
−0.5 0 0.5
−0.5
0
0.5
(d)
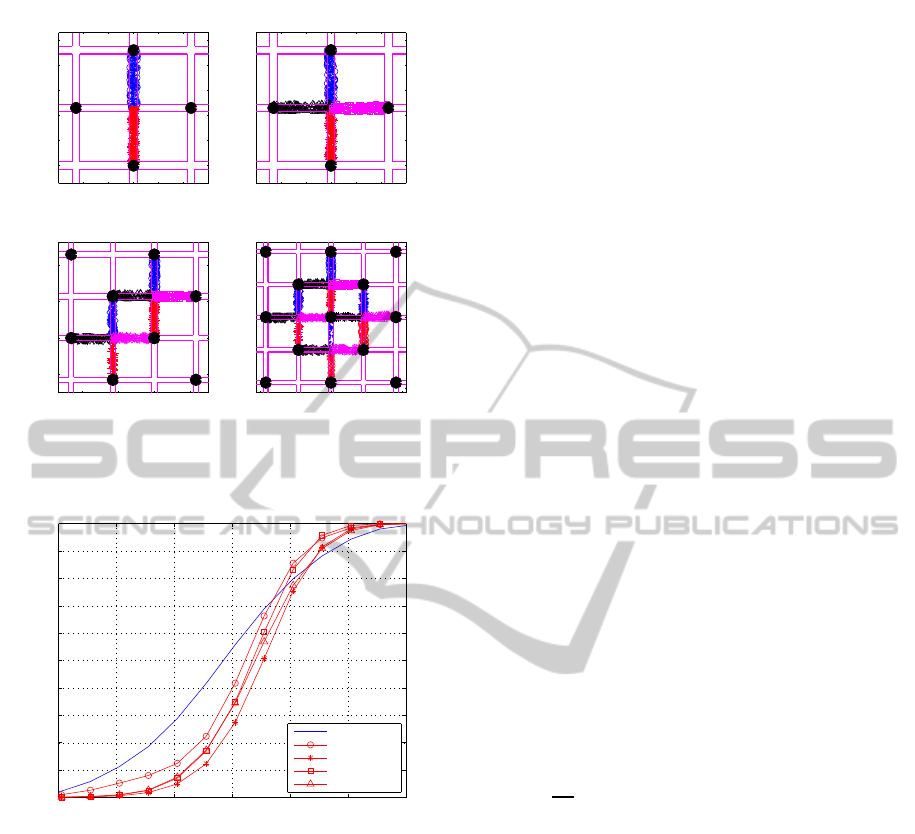
Figure 4: Cooperation scenarios for the BS density η = 1/2:
(a) 2-sector cooperation, (b) 4-sector cooperation, (c) 8-
sector cooperation, (d) 16-sector cooperation.
−10 0 10 20 30 40 50
0
0.1
0.2
0.3
0.4
0.5
0.6
0.7
0.8
0.9
1
SINR [dB]
Cumulative Distribution Function
NCT
CT: 2−Sector
CT: 4−Sector
CT: 8−Sector
CT: 16−Sector
Figure 5: SINR performance for the cooperative zero-
forcing transmission (η = 1/2).
using different the number of cooperation sectors are
plotted in Fig. 3. The SINR performance gain of co-
operative transmission using 4-sector antennas over
the non-cooperative transmission amounts to 7 dB
at the median value of 0.5, demonstrating the inter-
and intra-cooperation sector interference signal re-
duction performing cooperative multi-user transmis-
sion. However, it is observed that no noticeable gain
is obtained by performing 2-sector and 8-sector coop-
eration over 4-sector cooperation, since the interfer-
ence impact cannot be significantly reduced under the
maximum BS density condition.
Case II (η = 1/2). The Manhattan deployment sce-
nario in Fig. 1 and 4 employ the BSs location at every
two intersection (η = 1/2), where the horizontal or
vertical distance along the street between two BSs is
460m. A sector antenna covers 2 building blocks in-
cluding 200 × 30 street area and a sector coverage is
about 430× 200 square meters. The topology of 4 co-
operation scenarios; (a) 2-sector collaboration facing
each other at edge points of the straight line street,
(b) 4-sector collaboration of 4 BSs located at 4 edge
points of the cross-shaped street area, (c) 8-sector col-
laboration of 6 BSs located at connected cross-shaped
streets of a parallelogram area, and (d) 16-sector col-
laboration of 9 BSs located at a diamond shape area
can be presented.
In Fig. 5, it can be observed that 4-sector coop-
eration outperforms 2, 8, 16-sector cooperation. It
is also shown in the figure that SINR of cooperative
transmission is substantially higher than that of the
non-cooperativetransmission. At the median value of
0.5, the amount of SINR gain for 4-sector cooperation
exceeds 7.4 dB when compared to non-cooperative
transmission.
4 PERFORMANCE
COMPARISON
In this section, the per-user throughput, total through-
put, and outage probability are evaluated and com-
pared with 4 and 8-sector cooperation models using
full frequency reuse.
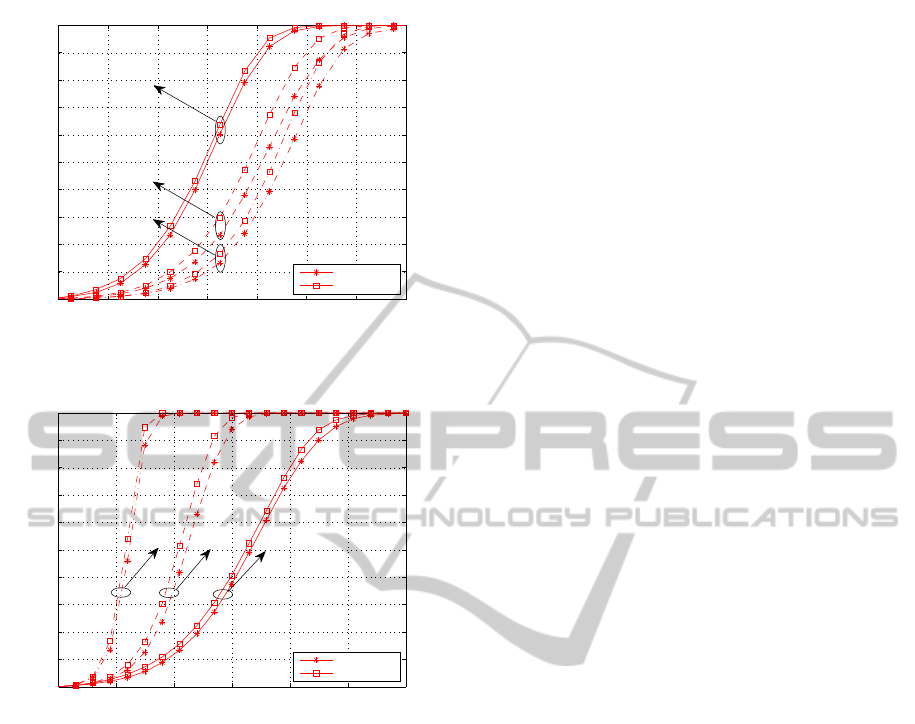
Figure 6 shows the CDFs of the per-user through-
put for different BS density of 4-sector and 8-sector
cooperation. The per-user throughput can be ob-
tained by
1
N
M
∑
N
M
k=1
log
2
(1+ γ
k
), where γ
k
is the SINR
value of MS
(c)
k
. It is confirmed that 4-sector coopera-
tion exhibits the maximum per-user throughput for all
cases of the BS density. The per-user throughput per-
formance is enhanced as decreading the BS density,
since the signal power from the interfering coopera-
tion sector is reduced by the sparse number of BS. In
particular, the performance gap between 4-sector and
8-sector cooperation increases at the large BS den-
sisty.
The distributions for the total throughput consid-
ering the BS density variation are plotted in Fig. 7.
The total throughput can be quantified by the sum of
throughput for every MS in about 2.6 × 2.6 square
kilometers area. Increasing the BS density, the target
MSs received the desired signal are densily located
in the considering area. At the cooperation cover-
age area of eta = 1/4 case for 4 MSs, 16 MSs can
be located to receive the desired signal considering
eta = 1/2 case. Thus, it is observed that the total
throughput is improved by the large BS density con-
ICEIS2014-16thInternationalConferenceonEnterpriseInformationSystems
418
0 2 4 6 8 10 12 14
0
0.1
0.2
0.3
0.4
0.5
0.6
0.7
0.8
0.9
1
η = 1
η = 1/2
η = 1/4
Per−User Throughput [bps/Hz]
Cumulative Distribution Function
CT: 4−Sector
CT: 8−Sector
Figure 6: Per-user throughput for the cooperative zero-
forcing transmission.
0 0.5 1 1.5 2 2.5 3
0
0.1
0.2
0.3
0.4
0.5
0.6
0.7
0.8
0.9
1
η = 1/4 η = 1/2 η = 1
Total Throughput [Mbps/Hz]
Cumulative Distribution Function
CT: 4−Sector
CT: 8−Sector
Figure 7: Total throughput for the cooperative zero-forcing
transmission.
dition due to the high link-access capability of MSs.
The performance of the outage probability is eval-
uated and compared condiering the BS density varia-
tion. At the entire range of outage threshold γ
th
, BS
density eta = 1/4 using 4-sector cooperation exhibits
the minimum outage probability, where the amount of
the strong interference signal is reduced by the sparse-
ness of BSs. At the 0.1% outage probability, the SINR
gain for the 4-sector cooperation of eta = 1/4 case ex-
ceeds 6 dB when compared to eta = 1 case.
Employing the cooperative zero-forcing dirty pa-
per coding, the performanceof the effective SINR and
the outage probability are evaluated using the 2, 4, 8,
16-sector cooperation models for BS density η = 1/2,
when all of the cooperation sectors use full power
transmission.
5 CONCLUSION
In Manhattan environment, we describe the various
kinds of cooperation strategy as increasing the num-
ber of cooperation sectors and transmission node den-
sity of the network. Considering both the practical
linear scheme using cooperative zero-forcing beam-
forming and non-linear scheme using zero-forcing
dirty paper coding, it is determinedthat 4-sector coop-
eration can be feasible strategy for cooperative multi-
user transmission in Manhattan network.
REFERENCES
Ahmed, B. T. et al. (2003). On the capacity and interference
statistics of street W-CDMA cross-shaped micro cells
in Manhattan environment (uplink analysis). In Proc.
IEEE Vehicular Technology Conf.
Chizhik, D. et al (2003). Multiple-input-multiple-output
measurements and modeling in Manhattan. IEEE J.
Select Areas Commun., vol. 21, pp. 321–331.
Cho, H.-S. et al. (2000) Performance analysis of cross- and
cigar-shaped urban microcells considering user mobil-
ity characteristics. IEEE Trans. Veh. Technol., vol. 49,
no. 1, pp. 105–116.
Chiu, W.-Y. and Chen, B.-S. Mobile positioning problem in
Manhattan-like urban areas: uniqueness of solution,
optimal deployment of BSs, and fuzzy implementa-
tion. IEEE Trans. Signal Process., vol. 57, no. 12, pp.
4918–4929.
Fu, I.-K. et al. Deployment and radio resource reuse in
IEEE 802.16j multi-hop relay network in Manhattan-
like environment. In Proc. IEEE ICICS, 2007, pp. 1–5.
CooperationStrategiesforMulti-userTransmissioninManhattanEnvironment
419
