
The Big Data Analysis for Measuring Popularity in the
Mobile Cloud
Victor Chang
School of Computing, Creative Technologies and Engineering, Leeds Metropolitan University,
Headinley, Leeds LS6 3QR, U.K.
Abstract. This paper presents the Big Data analysis for measuring popularity in
the Mobile Cloud, which is an emerging area in the Cloud and Big Data Compu-
ting. Organizational Sustainability Modeling (OSM) is the proposed method
used in this research. The twelve-month of German consumer data is used for
the analysis to investigate the return and risk status associated with the populari-
ty in the Mobile Cloud services. Results show that there is a decline in the usage
due to the economic downturn and competitions in the market. Key outputs have
been explained and they confirm that all analysis and interpretations fulfil the
criteria for OSM. The use of statistical and visualization method proposed by
OSM can expose unexploited data and allows the stakeholders to understand the
status of return and risk of their Cloud strategies easier than the use of other data
analysis.
1 Introduction
Cloud Computing provides added value for organizations; saving costs in operations,
resources and staff as well as new business opportunities for service-oriented mod-
els [3, 10, 13]. There are applications and services in emerging areas which have in-
creased demands and are worthwhile exploring. One such area is Mobile Cloud. Cur-
rent literature has emphasized in the system design, development and deployment
examples [6, 8]. There is little literature about the surveys focusing on the customers
and their rating of satisfaction towards using Mobile Cloud services. It is important
and useful to understand consumer behaviors and preferences for mobile products and
services to stay competitive in the market [6, 7, 12]. In order to define what to meas-
ure, propose how to measure and analyze data, a systematic method is required. A
proposed method can systematically compute all these data and explain the interpreta-
tions of these data, in the form of statistical modeling or visualization. Reporting the
status of risk and return of such Cloud adoption is important, since it can provide
stakeholders an overview about their service rating, risk monitoring and analysis about
whether their strategies of offering Cloud services have met their expected targets. In
this way, the businesses can be more adaptable to the fast-paced requirement changes
for Cloud Computing, particularly Mobile Cloud, which is a fast-growing area.
To address the requirements and challenges described in the last paragraph, Organ-
izational Sustainability Modeling (OSM) is designed to measure and calculate risk and
Chang V..
The Big Data Analysis for Measuring Popularity in the Mobile Cloud.
DOI: 10.5220/0004979100210029
In Proceedings of the International Workshop on Emerging Software as a Service and Analytics (ESaaSA-2014), pages 21-29
ISBN: 978-989-758-026-0
Copyright
c
2014 SCITEPRESS (Science and Technology Publications, Lda.)

return status for adopting Cloud Computing. This is designed to process and analyze
Big Data and complete computation of results within seconds. It can provide explana-
tions of the key statistics and interpret them in a way that makes the stakeholders to
understand the status of their risk and return of Cloud adoption at regular periods. In
summary, two advantages are available for using OSM: (i) it computes the status of
risk and return of Cloud adoption; (ii) the use of visualization technique can simplify
about the understanding of complex datasets and (ii) results provide empirical evi-
dences to critically evaluate about the Cloud strategy and recommendations towards
their return and risk status. The structure of this paper is as follows. Section 2 intro-
duces OSM and explains how it can be used. Section 3 describes the data analysis
process and presents the results and their interpretations. Section 4 sums up conclusion
for this paper.
2 Organizational Sustainability Modeling (OSM)
Organizational Sustainability Modeling (OSM) is improved version based on the
CAPM which is the analysis of return and risks for organisations or projects. Chang et
al. [1, 2] demonstrate how OSM can be used to measure risk and return status for
SAP, Vodafone/Apple and two projects in National Health Services, UK. The pro-
posed approach is to divide return and risk in three areas: Technical, Costs (Financial)
and Users (or clients) before and after deploying cloud solutions or products/services.
In some context, it can be defined as expected return and actual return. The data to be
collected are dependent on organizational focus. In this paper, the focus is on investi-
gating the popularity in using iPhone 4S and their services for a twelve-month period
of 2012 to compare the data collected in 2011. This keeps stakeholders informed of
the consumers and market requirements, which can be fast-paced and competitive in
the Mobile Cloud industry. In Chang et al [2, 3] statistical and visualization analysis,
Apple iPhone and iPad have offered Vodafone between 22% and 26% of extra profits
between 2009 and 2010. This means Vodafone has adopted the right strategies of
using iPhone and iPad to increase their profits and market dominance.
The use of OSM has a strong record of analyzing risk and return status for Cloud
adoption, which include detailed analysis for profitability and risks for Vodafone with
iPhone and iPad strategies [2, 3]. This includes advanced statistical computing and the
innovative approach of presentation of complex data analysis in 3D Visualization,
which offers two benefits:
It exposes any hidden or unexploited data for analysis. There is no need to
statistically analyze data several times.
Anyone without prior backgrounds can find the analysis easier to understand due
to the interpretation of statistical results and presentation of results in the form of
visualization.
2.1 Organizational Sustainability Modeling
OSM is the improved model based on Capital Asset Pricing Model (CAPM) [1, 2, 4],
22

which has three major limitations. First, it does not support large data processing since
it was originally designed in 1960s and large data processing is a requirement for Big
Science. Second, it is a generic model for risk and return analysis and additional work
is required to make it suitable for system adoption. Third, the risk-free rate does not
exist in reality most of the times. Additional work is required to define how to control
risk and monitor the changes in the risk-control rate. Based on these requirements, the
OSM formula is presented as
)r(r
cc
ae
(1)
where a is the actual return (or performance) of a large computing systems project or
investment.
r
c
is the risk control rate. It can be interpreted as the rate that is free of risk, or the
rate that risk can be managed. This is the rate for manageable risk.
e is the expected return (or performance) of a large computing systems project or
investment, and β is the beta value to represent risk measure or uncontrolled risk.
These are unpredictable events which cannot be managed and have a direct impact on
the adoption of the system
The uncontrolled risk, beta, can be calculated once when the expected value, the
actual value and risk-control rate in each dataset are available. A good approach is to
calculate all beta values and average them out. Another approach for calculating beta
is to perform linear regression, where the gradient of the slope is the value for beta [4,
11]. So the formula becomes
c
c
r -a
r - e
(2)
The steps above require the following input:
Actual return values (a): the actual values obtained from the measurement.
Expected return values (e): using the previous data (or previous measurement) as
the benchmark, or using computation technique to model the expected values.
Risk-control rate (r
c
): the percentage that does not affect risk if targets are not met.
It is often managed and controlled under 5% [4].
After collecting at least several hundred of metrics, these data can use OSM to calcu-
late beta, and compute the overall risk and return values to present to stakeholders.
2.2 Motivation for iPhone 4S, a Representation of Mobile Cloud
Chang et al., [2] presented their Vodafone/Apple case study on Mobile Cloud and it
had an overall coverage of iPhone and iPad models. The generalization provides use-
ful recommendation for potential and current investors [3]. Based on our knowledge
from investors’ requirements, they feel analysis will be more useful if it can be fo-
cused on each specific model. This may include iPhone 4S model alone and its com-
putational analysis about its business performance. We assert that the integrated ap-
proach has the following advantages:
23

It is cost-effective and can provide data and results in the minimum amount of
spending.
The quality of analysis is at a high level of standard, since it goes through a series
of quality assurance (QA) process.
The OSM approach can ensure a high quality of analysis and a low cost spending can
be achieved. This can ensure a higher return status for investors. OSM reads each
value in the dataset, sums up and averages key values. This means if there are 100
rows in the datasets, OSM can sum them up into 10 rows within one to two seconds,
and then process datasets for the analysis. Eventually all computations can be com-
pleted in seconds. OSM also aims for 99.99% accuracy for all the analysis. Addition-
ally, market contests between smart phones, mobile clouds, service providers and
mobile applications for Clouds have become more competitive than before. It is useful
to keep track of market demands and consumer requirements so that our Cloud strate-
gies and recommendation can be kept up-to-date.
3 Data Analysis: The Rationale and the Process Involved
This section describes the computational analysis of the collected datasets and ex-
plains the interpretations of the data. The source of data is from Kantar Worldpanel
ComTech [7], a market research company, as well as Anastaya, a consulting firm
specializing in data analysis. The author worked in Anastaya for a period of time as a
part-time consultant. A thorough data analysis approach has been adopted to ensure
data analysis can be unbiased and reflect the actual risk and the return status of the
mobile cloud adoption. The objective of this research is to analyze the rate of satisfac-
tion and the rate of adoption in the EU zone such as Germany.
Although Kantar Worldpanel ComTech has published a report on the iPhone 4S
performance in EU, it does not provide detailed statistical and computational analysis.
It only offers an estimated percentage of performance downgrade and does not pro-
vide any detailed analysis. Therefore, we aim to provide a more comprehensive analy-
sis with the following objectives:
Compute the exact extent of performance downgrade (or improvement) in EU
countries. In this paper, we focus on the German data because Germany is a
country behind Euro backing and is a good reflection on how top-tier EU country
performed in the economic crisis.
To provide a rationale and analysis about their performance (downgrade) based on
our results.
3.1 Data Processing Overview for the Mobile Cloud
Datasets follow the requirements of the OSM formula (2). Each row of data contains
the numerical values for the actual value, expected value and risk-control rate of the
German Mobile customer usage. The expected values included the 2010 to 2011 data
taken a year before the study began. The actual values included the 2011 data, to in-
24

vestigate the usage of mobile cloud adoption in 2012. The risk data between 2011 and
2012 was collected by Kantar Worldpanel ComTech. Each row of datasets contains
the actual and expected values of measurement, and risk-control rate associated with
each pair of actual and expected values. The data processing takes each row of da-
tasets – reading all data values; putting data values into the formulas; and then perform
statistical regression while using OSM. Another code algorithm is required for statisti-
cal analysis after the data processing from first round of OSM analysis. Statistical
programs have two steps.
The first step is to calculate the generic statistics including mean, standard devia-
tion, p-value, t-value and R-squared value.
The second step is to compute advanced features such as Durbin-Watson test, Sum
of Squares Error (SSE), Degree of Freedom Error (DFE) and Mean Square Error
(MSE).
The statistical program is written in SAS, a statistical software and language for analy-
sis. Ordinary Least Square (OLS) is useful to compute regression modelling for linear
model such as OSM, and is used for statistical program for data analysis. All numeri-
cal data for actual and expected values and risk-free rate can be computed based on
the code algorithm [4]. The dataset has 1,000 rows of data. With the use of OSM, it
sums up into 100 rows and computation can be completed within seconds.
3.2 OSM Data Analysis
This section presents results of the German data analysis and explains the interpreta-
tions of all these key statistical values. All the data is based on between January 2011
till December 2011, which provides twelve months of period of popularity measure-
ment for iPhone 4S. OSM can be modelled by statistical languages, in which SAS is
more suitable than other languages since it can compute more in-depth analysis [1, 2].
The data is carefully calculated, examined and randomized. Twelve months of data for
this case study is sufficient to analyze its business performance, since this is a model
specific approach and often Apple product performance can be determined within the
first few months in the market release [7]. SAS program for OSM is coded for compu-
tation and Table 3 is the summary of key statistics.
Computational modeling of OSM will use a, e, r
c
as the input to compute risk. The
output should contain the following:
1. Beta (β) is a value to determine the risk measure (or the extent of the volatility),
which is the uncontrolled risk that may affect the Mobile Cloud popularity.
2. Standard Error (SE) of the mean is the range of the mean that the experimental
results fall into for OSM. The smaller the standard error, the smaller the difference
between expected and actual return values [9].
3. Durbin-Watson (DW) is a test used to detect the presence of autocorrelation (a
relationship between values separated from each other by a given time lag) in the
residuals (prediction errors) from a regression analysis. The result of Durbin-
Watson (DW) should be above 1 [9]. Durbin-Watson is used to test regression
computed by OSM and accuracy of the output, and also the statistical behaviours.
25

The value for Pr > DW corresponds to the negative autocorrelation test (residuals
eventually wither off) and is a preferred method in the OSM approach, and the
value of Pr > DW should ideally get as close as to 1 to reflect the accuracy of the
OSM regression. The p-value used by most of statistics is the positive autocorrela-
tion value and can be worked out by subtracting the value of Pr > DW by 1. See
Table 1 for results.
4. Mean Square Error (MSE) is an estimator to quantify the difference between esti-
mated and actual values. A low MSE value means there is a high correlation be-
tween actual and expected return values.
5. R-squared value is used to determine how the regression fits in a line. Both 95 and
99.99 Confidence intervals (CI) are computed. In this context, it is referred as “R-
squared value for firm”, a term that is commonly used in econometrics to describe
the percentage of risks in proportion to the external or internal organizations or
factors [9]. If an organization has an R-squared value (99.99 C.I) of 0.3, this means
30% of risks are from external bodies or the market and 70% of risks come from
the organization such as poor adoption decision, overspending, poor selection of
equipment (resulting in accidents).
The results for OSM regression is as follows.
Table 1. OSM key statistics for German data in Mobile Cloud analysis.
Beta
54.56% of risks: external
and 45.44% of risks:
internal
0.5345
Durbin-Watson
Pr>DW (negative autocorrelation:
maximum of 1)
Positive autocorrelation (p-value)
1.7068
0.9130
0.0870
Standard Error
0.1447 Regress R-Square (99.99 C.I) 0.7107
Mean Square Error (MSE) 0.15369 Regress R-Square (95 C.I) 0.5456
Further explanations are presented as follows.
Beta is equal to 0.5345. The medium-low value suggests the project risk is main-
tained at a good control rate.
Standard error is 0.1447. The low value suggests most metrics are close to each
other and the data has fewer extremes. There is a high consistency between all
metrics.
The first order Durbin-Watson: Pr > DW is the p-value for testing negative auto-
correlation which favors OSM. Results show that there is a high negative auto-
correlation (0.9130), which is close to 1 in favor of OSM and also has an accepta-
ble quality of data and standard errors. The p-value is the positive autocorrelation
and is equal to 0.0870.
The low Mean Square Error (MSE) value suggests a good consistency between
actual and expected return values.
Main regression R-square is 0.5456. It means 54.56% of the risks are from the
externals such as funders’ cost-saving plans and 45.44% of the risks are from the
internals, which include the following reasons as confirmed by German user feed-
back analyzed by Anataya.
26
3.3 iPhone 4S in Germany: Actual and Expected Values in 3D
The next stage is to convert all datasets into 3D visualization. The rationale is that
results in visualization can expose unexploited areas. Often data analysis needs to be
read by the stakeholders and key-decision makers, who may not have the background
to understand. The use of visualization can simplify the complexity of understanding
these analysis. Chang et al. [1, 2, 5] demonstrate 3D Visualization is a simplified anal-
ysis for stakeholders and then to make the appropriate actions based on analysis.
Mathematica allows data conversion and presents it in a visual format. Data is then
computed in Mathematica and the 3D visualization models are presented in Figure 1.
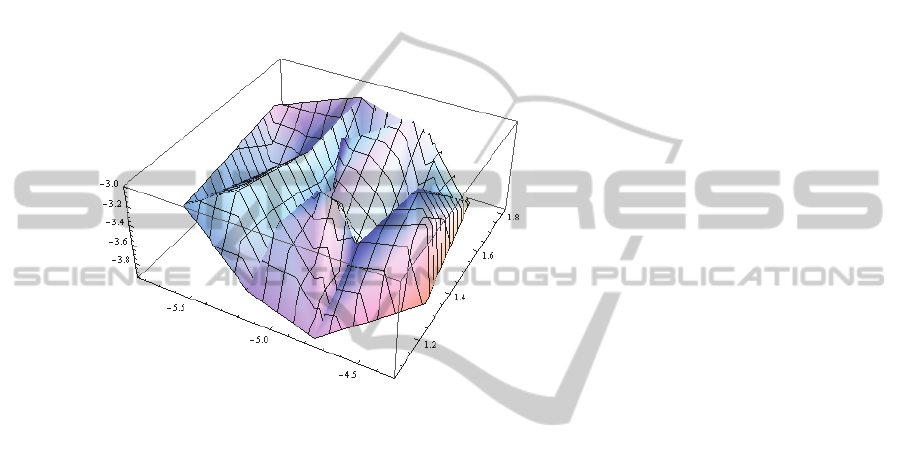
Fig. 1. iPhone 4S popularity in Germany comparing 2011 and 2012.
Figure 1 is the 3D Visualization for iPhone 4S popularity in Germany. The x-axis
shows actual iPhone usage is between -4.3 to -5.8%, and the y-axis shows expected
iPhone usage is between -3.0 to -4.0% and z-axis presents risk-control rate in the mar-
ket is between 1.0 and 1.8%. The EU market has an economic downturn, which is
expected to impact sales and popularity, but the actual performance is lower than the
expected performance. This may mean iPhone 4S has tough competitions from other
models with Android systems. These models tend to offer lower prices than iPhone
models and have become more competitive in a downturn [12].
3.4 Discussions
This section describes discussions related to the use of OSM. First, it is about compar-
ison between OSM and other methods such as Capital Asset Pricing Model (CAPM).
Although CAPM can be used as a generic solution for analyzing return and risk for
businesses, it cannot deal with big data. The assumption of risk-free rate is not true.
CAPM is not designed for emerging technologies involved with Cloud Computing [4].
OSM is a more structured method that can handle Big Data processing, can explain
how to manage risk-control rate and can be used for emerging technologies. Hence,
OSM is a better model than CAPM. Second, the discussion about inclusion of data
x-axis: Actual iPhone usage
decline (-4.3 to -5.8%)
y-axis presents expected
iPhone usage decline (-3.0
to -4.0%)
z-axis presents risk-free rate
in market (1.0-1.8%)
27

with at least one more European country. The French data will also be jointly analyzed
with the German data in the forthcoming research work, so that our work can have a
better representation of European countries.
4 Conclusion
We present the use of OSM to analyze the popularity in the Mobile Cloud. We use the
German data between 2011 and 2012 as the example and compare the actual values,
expected values and risk-control rates in all the datasets. We explain the use of OSM
to process datasets and the key statistics involved and their interpretations. We explain
all the key results and show that there is a decline in the popularity due to the econom-
ic downturn and also competitions from other mobile systems.
Key results include the beta, standard error, Durbin-Watson, p-values, mean square
errors and R-squared values. We confirm that all these key figures fulfil the criteria for
the OSM analysis. The use of 3D Visualization can expose unexploited data analysis
and also ensure the stakeholders can interpret analysis easily. OSM is an innovative
approach which can be adapted in other research projects, in different disciplines and
in other case studies. We will demonstrate how OSM can be used in other disciplines
and also other European countries to study the popularity in the use of Mobile Cloud.
References
1. Chang, V., De Roure, D., Wills, G, Walters, R. and Barry, T.: Organisational Sustainability
Modelling for Return on Investment: Case Studies presented by a National Health Service
(NHS) Trust UK. Journal of Computing and Information Technology, 19 (2), (2011 a).
2. Chang, V., De Roure, D., Wills, G., & Walters, R. J.: Case studies and organisational sus-
tainability modelling presented by Cloud Computing Business Framework. International
Journal of Web Services Research (IJWSR), 8(3), 26-53, (2011 b).
3. Chang, V., Walters, R. J., & Wills, G.: The development that leads to the Cloud Computing
Business Framework, International Journal of Information Management, 33(3), (2013).
4. Chang, V.: A proposed model to analyse risk and return for a large computer system adop-
tion, PhD thesis, University of Southampton, (2013).
5. Chang, V., Business Intelligence as a Service in the Cloud, Future Generation Computer
Systems, (2014).
6. Ganti, R. K., Ye, F., & Lei, H.: Mobile crowdsensing: Current state and future challenges.
Communications Magazine, IEEE, 49(11), 32-39, (2011).
7. Kantar Worldpanel ComTech: Kantar Worldpanel ComTech Global Consumer, White paper
and VIP report, December, (2011).
8. Rimal, B. P., Jukan, A., Katsaros, D., & Goeleven, Y.: Architectural requirements for cloud
computing systems: an enterprise cloud approach. Journal of Grid Computing, 9(1), 3-26,
(2011).
9. Lee, C.F., Lee, A.C. and Lee, J. (Ed.), Handbook of Quantitative Finance and Risk Man-
agement, 1, Springer publisher, ISBN 978-0-387-77116-8, (2010).
10. Schubert, L., Jeffery, K. and Neidecker-Lutz, B.: The Future for Cloud Computing: Oppor-
tunities for European Cloud Computing Beyond 2010, Expert Group report, public version
28

1.0, January, (2010).
11. Sharpe, W. F., Capital Asset Prices with and without Negative Holdings, Nobel-Prize Eco-
nomics Lecture, pp 312-332, Dec 7, (1990).
12. USwitch survey, USwitch’s Guide to Mobile Phones, September 2011.
13. Vouk, M. A.: Cloud Computing – Issues, Research and Implementations, Journal of Compu-
ting and Information Technology - CIT 16, page 235–246, Volume 4, (2008).
29
