
Introduction to the Risk Visualization as a Service
Victor Chang
School of Computing, Creative Technologies and Engineering, Leeds Metropolitan University,
Headinley, Leeds LS6 3QR, U.K.
Abstract. This paper introduces the Risk Visualization as a Service (RVaaS)
and presents the motivation, rationale, methodology, Cloud APIs used, opera-
tions and examples of using RVaaS. Risks can be calculated within seconds and
presented in the form of Visualization to ensure that unexploited areas are ex-
posed. RVaaS operates in two phases. The first phase includes the risk model-
ing in Black Scholes Model (BSM), creating 3D Visualization and Analysis.
The second phase consists of calculating key derivatives such as Delta and The-
ta for financial modeling. Risk presented in visualization allow the potential in-
vestors and stakeholders to keep track of the status of risk with regard to time,
prices and volatility. Results in experiments show that RVaaS can perform up
to 500,000 simulations and complete all simulations within 22 seconds. RVaaS
provides a structured way to deploy low cost, high quality risk assessment and
support real-time calculations.
1 Introduction
Risk analysis is useful to help organizations to understand the extent of business and
operational risks, which can vary from time to time. According to Lord Turner, Chair
of the Financial Service Authority (FSA) UK, the problem was that the banks' math-
ematical models assumed a ‘normal’ or ‘Gaussian’ distribution of events. Although
this reduces computational effort, it can seriously underestimate the real risk [4, 7].
More recently, debt problems in the US and Euro Zone have triggered a further
downturn. A study by Hamnett [5] concluded that unsustainable mortgage lending
leading to a housing bubble and subsequent collapse was the cause of the Global
economic downturn; certainly the collapse of Lehman Brothers [3] which triggered
the global financial crisis was the result of irresponsible mortgage lending. We pre-
sent a case of Risk Visualization as a Service (RVaaS), which uses Cloud Computing
to analyze risk and make risk visible. RVaaS is a Cloud based Software as a Service
(SaaS) based on Mathematica and MATLAB designed to improve the accuracy and
quality of both pricing and risk analysis in financial markets, compared with tradi-
tional desktop technologies. This allows investors to identify the status of risks in
associations of changes in prices,market confidence and implied volatility. RVaaS has
a two stage service in which the stages address the following challenges:
1. Performing a sufficiently high number of simulations in an acceptable time.
2. Quantifying risks and assisting with analysis by providing clear presentations of
Chang V..
Introduction to the Risk Visualization as a Service.
DOI: 10.5220/0004979200300037
In Proceedings of the International Workshop on Emerging Software as a Service and Analytics (ESaaSA-2014), pages 30-37
ISBN: 978-989-758-026-0
Copyright
c
2014 SCITEPRESS (Science and Technology Publications, Lda.)
results.
The structure of this paper is as follows. Section 2 introduces RVaaS, which includes
Black Scholes, Delta and ta, the commonly used derivatives in financial computa-
tions. Section 3 describes a full use case scenario to explain how the command-line-
like APIs, Black Scholes, Delta and Theta, can be used. Section 4 presents experi-
ments of running RVaaS services. Section 5 presents discussions and Section 6 sums
up Conclusion.
2 Risk Visualization as a Service
Better ways to identify risks, rectify errors and perform accurate and fast simulations
are highly desirable. Requirements for the RVaaS include the followings:
1. Based on the reputable models – Our RVaaS adopts reputable models including
Black-Scholes-Merton (known as Black Scholes Model, BSM) to run exhaustive
cases and compute the best pricing and risks for different scenarios.
2. Identification and visualization of risks –BSM is used to identify risks and can
make risks to be in visualized formats to expose risks and understand its extent of
impacts of implied volatility.
3. High-performance simulations – Our RVaaS should not allow simplicity as the
expense of the accuracy due to the use of Gaussian Copula on desktop (Chang,
2014). Our RVaaS should complete all simulations and derivative calculations
with a quick time.
2.1 Black Scholes in Theory and Practice
The BSM is commonly used in financial markets and derivative calculations. It is also
an extension from Brownian motion. The BSM formula calculates call and put prices
of European options (a financial model) [6]. The value of a call option for the BSM is
(1)
where
and
The price for the put option is
(2)
For both formulas [6],
N(•) is the cumulative distribution function of the standard normal distribution
T - t is the time to maturity
S is the spot price of the underlying asset
K is the strike price
r is the risk free rate
σ is the volatility in the log-returns of the underlying asset.
31

BSM is used as a command-line API. It means users can type in the key figures in the
command which compute the numerical values for prices and risk. Mathematica is
used to support calculations of derivatives in the Cloud. Both BSM and auxiliary
functions (delta and theta compute derivatives) take the same five variables as fol-
lows.
p = current price of the stock.
k = exercise price of the option.
sd = volatility of the stock (standard deviation of annual rate of return)
r = continuously compounded risk-free rate of return, e.g., the return on U.S.
Treasury bills with very short maturities.
t = time (in years) until the expiration date
The contribution from RVaaS is to develop BSM as an easy-to-use command-line
API, which allow users to type in key values to get the final answer. The command is
BlackScholes [p_,k_,sd_,r_,t_]
2.2 Delta, Theta and Other Requirements
To facilitate the use of BSM command, additional command-line APIs are required.
Two of them are known as Delta and Theta, which are part of financial derivatives of
calculating advanced pricing ad risk [1, 8]. Delta can indicate how much the price of
an option will respond to a change of price of the stock. Delta is useful in risk man-
agement where a portfolio contains more than one option on the stock. The derivative
function, D, is built in Mathematica, which explains why Mathematica is used. This
much simplifies coding for Delta, which can be presented as
Delta[p_,k_,sd_,r_,t_] = D[BlackScholes[p,k,sd,r,t],t]
Theta[p_,k_,sd_,r_,t_] = -D[BlackScholes[p,k,sd,r,t],t]
To get an inverted Delta, a new function, Theta, is introduced. The operations of
RVaaS include:
1. Risk calculation and analysis: This includes calculations of derivatives such as
delta and theta which can calculate the accurate approximation for volatility, and
the right prices and risk associated with it.
2. A visualization service using BSM: This translates all different types of risk into
3D Visualization so that there is no hidden or missing area of risk.
The benefits of using command-line APIs, BlackScholes, Delta and Theta, allow fast
computation of results presented in Section 3.
3 Scenarios of Running 3D Risk
This section describes how RVaaS is used to calculate risk and pricing based on the
market value. With regard to BSM, key values such as p, k, sd, r and t need to be
known before the calculation. The value p, k and t are known because these values
32
represent the starting values and the target values. The value of sd can be obtained
from Volatility S&P 500 (VIX) Chicago options [2], which releases the daily values
of sd. The value of r can be obtained from the government body such as the US
Treasury. There are two scenarios given in this case.
The first scenario involves profits/loss in relation to put price. The call price (buy-
ing price) for a particular investment is 60 per stock. The put price (selling price) to
get zero profit/loss is also 60. The risk-free rate, the guarantee rate that will not incur
loss, is between 0 and 1.5%. However, the profit/loss varies because of the impact of
volatility in the market. In turn, this means selling prices between 50 and 60 will lead
to different extents of loss due to the rapid fluctuations in the market. Similarly, sell-
ing prices between 60 and 70 will result in differing levels of profit. The intent is to
find out the percentage of profit and loss for a massive sale and the risk associated
with it. Using Black Scholes function (BlackScholes [p_,k_,sd_,r_,t_]) where
p = current price of the stock, set between 40 and 60.
k = exercise price of the option, 50 is the default.
sd = volatility of the stock (standard deviation of annual rate of return), 0.45.
r = continuously compounded risk-free rate of return, e.g., the return on Europe
U.S. Treasury bills, 0.04.
t = time (in years) until the expiration date, between 1 month and four years later.
Two types of results are presented. The first type can model all computed analysis
into 3D visualization. This is beneficial to the analysts and stakeholders since they
can understand the percentage of profits and loss associated with changes in put price,
time and volatility. The second type is to calculate the numerical values of percentage
of profits or loss by providing key inputs to the Black Scholes.
The First Type of Result for Black Scholes: The result can be computed in 3D swift-
ly by simply typing in:
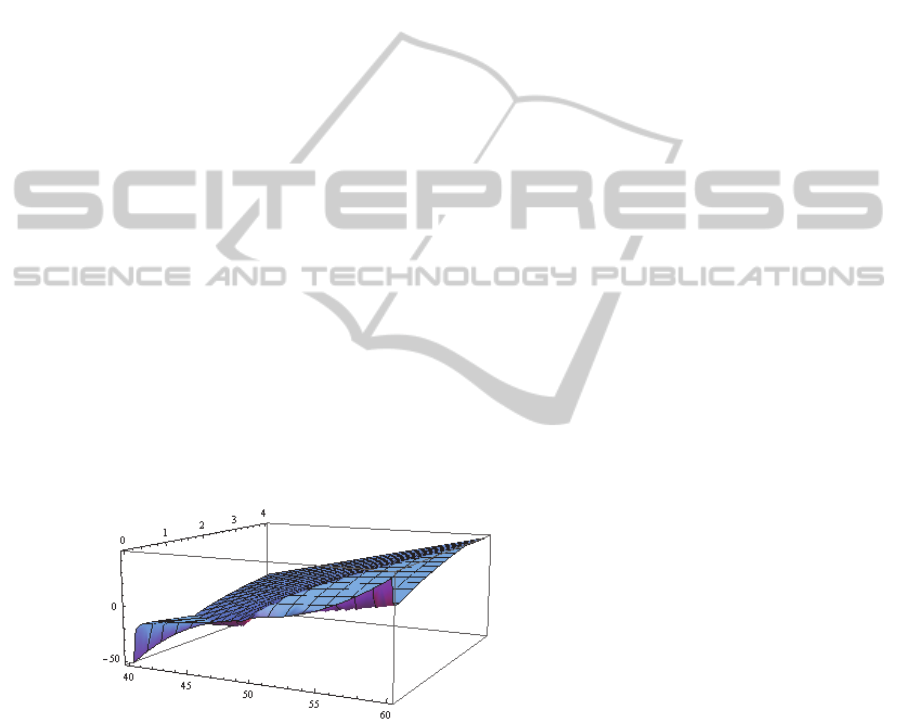
BlackScholes [p ,50, 0.45, 0.05 ,t], {p, 40, 60}, {t, 0.01, 4}
Fig. 1. The 3D risk analysis to investigate volatile percentage of profits and loss.
Fig. 1 presents results of risk modeling on the Cloud which transforms output into
3D. Fig.
1 confirms that the price of 50 is indeed a ‘turning point’, and profits will be
made at the right time. If the selling period is getting caught with the fluctuations in
the market, the loss will be made. Computation enabled by Cloud makes the modeling
and analysis very easy. Risks associated with time, volatility and rapid change in the
x-axis: The best put price (40-60)
y-axis: the percentage of profits
and loss for massive sale (-50% to
+50%)
z-axis: period of time (1 month - 4
years later)
33
market can be monitored, which can provide the investors and traders some insights
for investment.
The Second Type of Result or Black Scholes: Inputs are the same as before, except
the investor has a call price of 48.5 for a planned put price of 50. After 2 years, he/she
wishes to know the percentage of profits. We can simply type in the Black Scholes
command as:
BlackScholes[48.5, 50, 0.45, 0.04, 2]
and the output is equal to 8.11448 which corresponds to the value in the y-axis.
Computations and Visualization for Delta: Within Delta function, t is entered as 4,
which means around 4 years will be lapsed since the crisis has started. Results will be
different if it is typed in as 0, which means from now on. Again, auxiliary and Black
Scholes functions are used to compute 3D Visualization swiftly. The command is
Delta[p_,k_,sd_,r_,t_] where all variables are the same as in Black Scholes. In order
to get Delta RVaaS results by typing
Delta[p, 50, 0.45 0.04, t], {p, 40, 60}, {t, 0.01, 4}
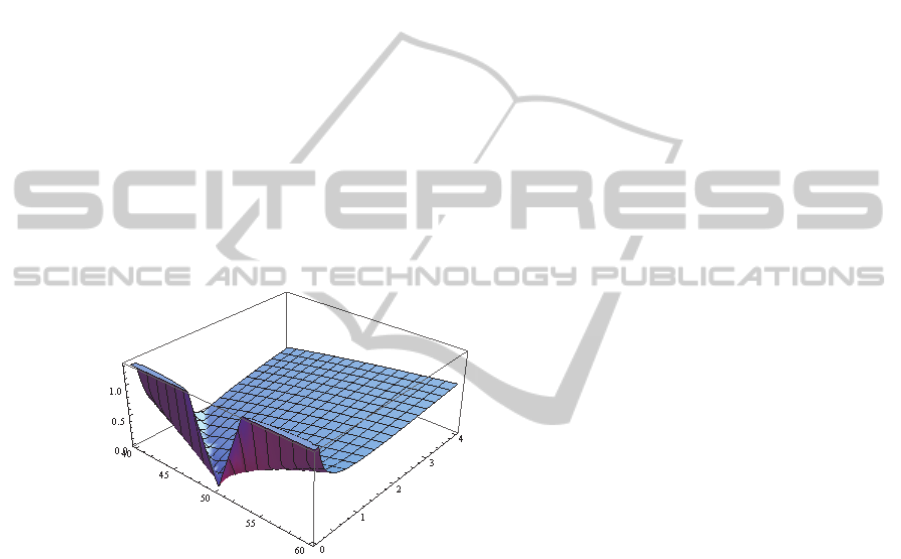
The output is presented in Fig. 2. Similar to BSM command, we can also type in
Delta[48.5,50.,0.45,0.04,0.3] to get the output and the result is 0.0483448.
Fig. 2. The 3D risk analysis to investigate the best put price in relations to fluctuating volatili-
ty.
Computations and Visualization for Theta: Thelta is another derivative calculated by
financial modeling. The use of Cloud enable Thelta calculations to be possible. Theta
can be used to study the negative impact due to the economic crisis. The command is
Theta[p_,k_,sd_,r_,t_] . In order to get Thelta RVaaS result, typing in
Theta[p, 50, 0.45 0.04, t], {p, 40, 60}, {t, 0.01, 4}
The output is presented in Fig. 2. Similar to BSM command, we can also type in
Theta[48.5,50.,0.45,0.04,0.3] to get the output and the result is -8.33054.
x-axis: The implied volatility (20– 100)
y-axis: The percentage of profitability (0
- 3.8%)
z-axis: period of time (1 month now – 4
years later)
34
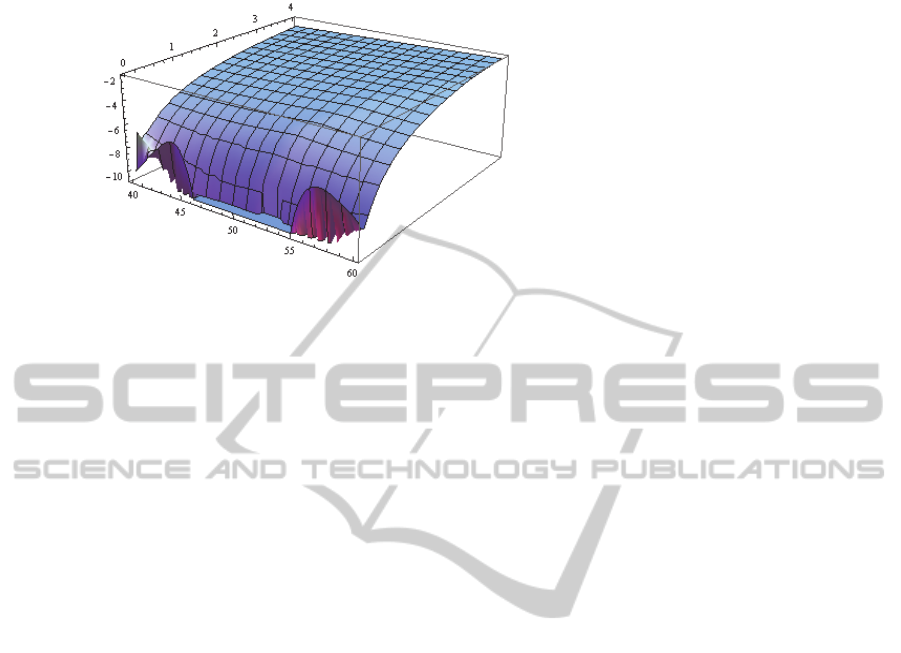
Fig. 2. The 3D risk analysis to explore the percentage of loss and the put price.
4 Experiments
This section describes the hardware set up and the results of experiments. Various
simulations and experiments for RVaaS have been performed using a high specifica-
tion desktop environment, private and public clouds. The desktop machine has 2.67
GHz Intel Xeon Quad Core and 4 GB of memory (800 MHz). The private cloud is
used and it involves four sites in total; two in London and two in Southampton. The
University of Southampton resources are used for all 3D Visualization, and are also
used to connect the lead author’s home cluster, Greenwich and London Data Centre.
There are reliable computational connections between internal networks. The public
cloud includes Amazon EC2 services which uses a large instance of Ubuntu 8.4 and 8
GB RAM.
The London Data Centre has advanced Cloud and parallel computing infrastruc-
ture and network attached storage (NAS) service. In total it has CPUs totaling 30
GHz, 60 GB of RAM and 12 TB of disk space in place. Experiments performed in
this environment get the best benefit of advanced optical fiber networking. There are
two servers at London Greenwich, with a total of 9 GHz CPU and 20 GB RAM. The
two servers at University of Southampton both have 6.0 GHz and 16 GB RAM. For
the home cluster, the total hardware capability is 24.2 GHz CPU and 32 GB RAM.
Simulations and experiments on a desktop and two private clouds (one in Southamp-
ton and one in London) get the same results, and thus execution time to complete all
simulation is the benchmark to differentiate their performance on different platforms.
Code written for BSM has been used for experimenting and benchmarking with
some experimental Modelling of Assets (MoA) code. For example, our previous work
[1] describes and explains code written for BSM which has been used for experiment-
ing and benchmarking in the Clouds. Based on the core code algorithm, the objective
is to calculate the best prices and risks, in regard to the use of American and Europe-
an options. Execution time (based on the average of five results) is used as the per-
formance benchmark. All results suggest standard deviations are kept within 0.1% to
ensure a high level of accuracy. Five different sets of experiments were designed, and
each set of experiments records, execution time from 50,000 to 500,000 simulations.
x-axis: The best put price (40 – 60)
y-axis: The percentage of loss (-2
and -11%)
z-axis: the period of time (1 week –
4 years later)
35
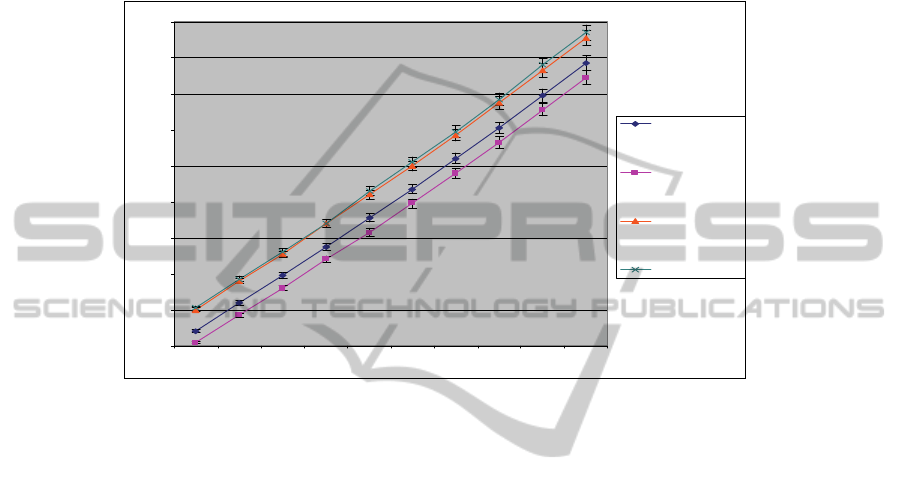
Using MATLAB the code can achieve up to 500,000 simulations in one go. Results
for each set of experiments are recorded and shown in Fig.
3, which shows that
500,000 simulations can be completed within 22 seconds on all different platforms.
BSM can achieve good execution time while maintaining a high level of accuracy.
Results in RVaaS show that 500,000 simulations of undertaking BSM functions can
be completed within 22 seconds.
Experimental results for combining RAaaS steps
4
6
8
10
12
14
16
18
20
22
12345678910
No of simulations (1 unit = 50,000 simulations)
Average execution time (sec
)
Private cloud
(Southampton
clusters)
Private cloud
(Southampton
and London
clusters)
Public cloud
(Ubuntu
8.0.4)
Desktop
Fig. 3. Experiments of large-scale simulations (1 unit = 50,000 simulations).
5 Discussion
This section presents topics of discussions. First, the comparison with another similar
Cloud such nas Python cloud. The combined Mathematica and MATLAB cloud has
the advantage of using Python cloud, since 500,000 simulations of calculating risks
and prices can be completed within 22 seconds. Additionally, RVaaS can present
instant changes with regard to changes in the market. This allows investors to monitor
changes. Second, computational results can compute risks. The contributions from
RVaaS are to present numerical results in a form that allows investors (without com-
putational background) to understand the analysis easily, so that they can make deci-
sions quicker and better. Visualization can present a computational analysis that is
appealing to investors. This area of the new study is related to Business Intelligence
as a service in the Cloud (BIaaS) to simulate risk and prices in real-time and report to
the investors the respective values in risks and prices of every instance in the market
[2]. RVaaS offers a platform for scientists to simulate their risk, experiment with their
proof-of-concepts and make it a more transparent platform than the current practice in
the finance industry (which is reluctant to share about their practices).
36

6 Conclusion
In reply to the problems caused by the financial crisis, we propose Risk Visualization
Service (RVaaS). The lack of visualization to track down the risks associated with the
best put price, implied volatility, percentage of profits/loss and movement in the mar-
ket mean their model is not real-time and ignoring some assumptions which are criti-
cal to reliable analysis. Using RVaaS in the Cloud permits organizations to break the
constraints of the Gaussian copula and use the power of Cloud Computing to adopt
more complex models and improve accuracy in risk analysis and prediction.
RVS operates in two phases:
Calculating key derivatives such as Delta and Theta for financial modeling.
Risk modeling in BSM, creating 3D Visualization and Analysis.
We use one real-case scenario to demonstrate our RVaaS. Results show that numeri-
cal results can be computed by typing the key variables obtained from different public
sources and the targets set by the stakeholders. Risk presented in visualization form
allow the potential investors and stakeholders to keep track of the status of risk with
regard to time, prices and volatility. Results in experiments show that RVaaS can
perform up to 500,000 simulations and complete all simulations within 22 seconds.
RVaaS provides a structured way to deploy low cost, high quality risk assessment
which avoids generating the unduly optimistic results which can arise from an implic-
it assumption in other techniques that favorable trading conditions will continue.
References
1. Chang, V., Li, C.S, De Roure, D., Wills, G., Walters, R.J., Chee, C.: The Financial Clouds
Review, International Journal of Cloud Applications and Computing, 1 (2), (2011) 46-63.
2. Chang, V., Business Intelligence as a Service, Future Generation Computer Systems, DOI:
http://www.sciencedirect.com/science/article/pii/S0167739X13002926, (2014).
3. Financial Times: Lehman Brothers files for bankruptcy, (2008).
4. Financial Times: Interview with Lord Turner, Chair of Financial Services Authority, in:
Financial Times, London, (2009).
5. Hamnett, C.: The Madness of Mortgage Lenders: Housing finance and the financial crisis,
in, King’s College, London, London, UK, (2009).
6. Hull, J.C., Options, Futures, and Other Derivatives, Seventh Edition., Pearson, Prentice
Hall, (2009).
7. Hutchinson, M.: A Finer Formula for Assessing Risk, in: New York Times, New York,
(2010).
8. Miller, R. M.: Option Valuation, Miller Risk Advisors, Technical paper, (2010).
37
