
A Model Towards Using Evidence from Security Events
for Network Attack Analysis
Changwei Liu
1
, Anoop Singhal
2
and Duminda Wijesekera
1
1
Department of Computer Science, George Mason University, Fairfax VA 22030, U.S.A.
2
National Institute of Standards and Technology, 100 Bureau Drive,
Gaithersburg MD 20899 U.S.A.
Abstract. Constructing an efficient and accurate model from security events
to determine an attack scenario for an enterprise network is challenging. In this
paper, we discuss how to use evidence obtained from security events to
construct an attack scenario and build an evidence graph. To achieve the
accuracy and completeness of the evidence graph, we use Prolog inductive and
abductive reasoning to correlate evidence by reasoning the causality, and use an
anti-forensics database and a corresponding attack graph to find the missing
evidence. In addition, because the constructed scenario and supplied evidence
might need to stand up in the court of law, the federal rules of evidence are also
taken into account to predetermine the admissibility of the evidence.
Keywords. Network Forensics, Anti-forensics, Evidence Graph, Attack
Graph, Inductive Reasoning, Abductive Reasoning, Admissibility.
1 Introduction
Investigators of digital crime look for evidence so that they can construct potential
attack scenarios with the hope that they can be more convincing than the ones
presented by the defense. However, attackers who launch attacks against enterprise
networks tend to use sophisticated techniques such as multi-host, multi-step attacks
and anti-forensics, which makes finding incriminatory evidence difficult. Besides, the
defense may question the legal admissibility of presented evidence, rebut the
arguments presented by the prosecution or present an alternative scenario that fits the
evidence presented by the prosecution that would absolve the accused of wrongdoing.
Consequently, using available but tainted or incomplete evidence to find more
evidence and re-construct the attack scenario that can withstand a rebuttal is
challenging.
Enterprise systems generate events to show their state changes that are
categorized by criticality and recorded in event logs. Although the topic of using IDS
logs as forensic evidence has been controversial, they provide the first level of
information for forensics analyst [4]. Many researchers have proposed to aggregate
redundant alerts and correlate them to determine multi-step attacks [1, 9]. However,
most reported work used non-automated ad-hoc methods. In order to partially
automate forensic analysis, Wang et al. proposed a hierarchical reasoning framework
Liu C., Singhal A. and Wijesekera D..
A Model Towards Using Evidence from Security Events for Network Attack Analysis.
DOI: 10.5220/0004980300830095
In Proceedings of the 11th International Workshop on Security in Information Systems (WOSIS-2014), pages 83-95
ISBN: 978-989-758-031-4
Copyright
c
2014 SCITEPRESS (Science and Technology Publications, Lda.)

to correlate alerts using so-called local rules and group them using so-called global
rules [7]. The end result of this hierarchical reasoning system forms an evidence
graph that visualizes multi-host, multi-step attacks in an enterprise network.
Although there is extensive work regarding using evidential reasoning in
formulating hypothesis and collecting evidence in criminal investigations [2], to the
best of our knowledge, [7] is one of the few that proposed to use reasoning to
correlate attack scenarios represented by security event alerts. However, this work did
not implement an end-to-end system to fully automate the forensics analysis process.
Besides, this work left two problems un-resolved: (1) Variable alternative hypotheses
could explain the same attack scenario under the situation where the evidence has
been destroyed, but only one of them is correct; (2) The evidence that can provide
security advice to network administrator might not be admissible in the court of law.
As the contribution, in this paper, we propose to implement a Prolog reasoning based
model to automate multi-host, multi-stage vulnerability analysis on an attacked
enterprise network. Because Prolog can easily query information from SQL database
table and is well known to be most suitable tool for implementing programs with
explicit domain knowledge representation, our model is more powerful than [7] that
used rule based fuzzy cognitive map reasoning in the way that it easily handles
massive information from forensics expert knowledge database. Also, we proposed to
use an anti-forensics database and a corresponding logical attack graph to help resolve
the two problems mentioned above. We implement our model by extending an end-to-
end framework and reasoning system MulVAL [13, 15].
The rest of the paper is organized as follows. Section 2 describes background.
Section 3 is related work. Section 4 describes the experimental network, and Section 5
introduces attack graphs and the tool used in the paper. Section 6 is our main
contribution, which describes our model of building evidence graphs for network
attack analysis under the situation where anti-forensics is used. We conclude this
paper in Section 7.
2 Background
2.1 Digital Forensics and Anti-forensics
Digital forensics uses scientifically validated methods to collect, validate and preserve
digital evidence derived from digital sources [20]. Digital forensics investigators
analyze data from enterprise systems and use imaging and analysis tools to extract
data from physical or storage media memory to do content analysis [23]. While live
analysis risks getting changing data from a computer, dead analysis, although better,
requires terminating all system processes [23].
Analyzing network data presumes that some monitoring tools have saved network
traffic or event logs [24, 25]. Network IDS alerts provide first clues about potential
attacks. However, the large quantities and false positives of the IDS alerts make the
analysis difficult. As a solution, [5] uses a fault graph based on safety properties and
security policies to impose a structure on log data so that the IDS can decide what
data is necessary to log for forensic analysis in a way that facilitates determining the
attack scenario and its effect.
84

Attackers use anti-forensics tools as attempts that negatively affect the existence,
amount, and/or quality of evidence from a crime scene, or make the examination of
evidence difficult or impossible to conduct [21]. Current anti-forensic techniques
include (1) attacking data and (2) attacking tools [21]. Techniques used to attack data
include overwriting stored (meta) data, deleting files or media, hiding information
using obfuscation, steganography, encryption or unallocated (slack) spaces, etc. [21].
Techniques used to attack forensics tools interfere with or mislead forensic analysis
by crafting images or data that is unusable by tools [14].
2.2 Legal Admissibility in Digital Forensics
During trials, judges are often asked to rule on the admissibility of digital evidence.
According to federal stature [8], the following rules apply to e-evidence: (1)
Authenticity (Rules 901 and 902); (2) Hearsay or not (Rule 801-807); (3) Relevance
(Rule 401); (4) Prejudice (Rule 403); (5) Original writing Rule (Rule 1001-1008), in
which relevance plays a key role. Consequently, accuracy and validity matter when
using digital evidence for legal admissibility [22]. Here, accuracy provides juries an
understanding of the likelihood of the validity of evidence. Federal rule 104(e)
addresses this credibility/weight issue, which does not limit the right of a party to
introduce before the jury evidence that is relevant to weight or credibility.
2.3 Evidence Graph
Evidence Graph is a graphical model that presents intrusion evidence and their
dependency, which can be used to ascertain multi-stage, multi-step attacks in
enterprise networks [7]. We modify the formal definition from [11] as follows.
Definition 1(Evidence Graph): An evidence graph is a sextuple G=(N
h
,N
e
,E, L, N
h
-
Attr, N
e
-Attr
,
), where N
h
and N
e
are two set of disjoint nodes representing host
computers involved in the attack and its related evidence; E ⊆(N
h
×N
e
) ∪(N
e
×N
h
); L
is mapping from a node to its label; N
h
-Attr and N
e
-Attr are attributes to host and
evidence nodes respectively.
Attributes for Host Nodes
a. Host ID: Identify of a host node.
b. States: Host node category consisting of one or many of the “source”,
“target”, “stepping-stone” and “affiliated”. Affiliated hosts have suspicious
interactions with an attacker, one of victims or stepping-stone.
c. Time Stamps: Time stamps that record the attack states of a machine.
Attributes for Evidence Nodes
a. General Attributes: Includes event initiator, event target, event description
and event time stamp(s).
b. Relevancy: Measurement of impact on attack success, which includes the
irrelevant true positive=0, Unable to verify=0.5 and Relevant true positive =1.
2.4 MulVAL, Prolog and Datalog
In this paper, we use and extend MulVAL, a Datalog based attack graph generation
system, to reason the correlation between evidence collected allegedly after a multi-
85

stage, multi-step attack. We also use XSB [17], a Prolog based in-memory deductive
database engine as a rule engine [3].
3 Related Work
Reasoning has been used to link evidence and claims about attacks by using expert
knowledge. In this area, [2] uses inductive and abductive reasoning to model potential
crime scenarios and correlate evidence, and [6] uses a Bayesian inference to evaluate
how well a given criminal evidence can choose one scenario over possible
alternatives. However, both works are based on traditional criminal forensics. For
network forensics, [7] uses a global and local reasoning system that is based on expert
knowledge to correlate evidence and intuitively visualize attack scenarios by creating
an evidence graph. In this work, rule based fuzzy cognitive map is used to model
expert knowledge in order to reason the evidence correlation. Neither work [2, 6] nor
[7] uses Prolog programming language to formalize expert knowledge, evidence, and
access control policy to automate network attack analysis, which is our contribution in
this paper. Besides, [7] did not consider how to handle the situations where anti-
forensics techniques have been used and there might be variable alternative
hypotheses about the missing evidence, which instead will be discussed in this paper.
4 Experimental Network
Fig. 1. Experimental Attacked Network.
Figure 1 is the topology of an experimental network we use in this paper. Table 1 has
the IP addresses of computers and their vulnerability information. In Figure 1, the
external Firewall 1 controls network access from the Internet to the enterprise
network, where a webserver hosts two web services—Apache HTTP Server at Port 80
and Apache Tomcat Server at Port 8080. The internal Firewall 2 controls the access to
a SQL database server, which can be accessed by the webserver and employees’
workstations in the network. The administrator has administration privilege on the
webservers. SNORT is used as an IDS and firewall in this network. We also
configured both web servers and the database server to log all access and queries.
86
Sample of the SNORT alerts, web server access records and Database query log is
displayed in Appendix 1.
Table 1. Machine IP address and Vulnerability.
Machine IP Address/Port Vulnerability
Attacker 129.174.124.122
Workstations 129.174.124.184/185/186
HTML Objects Memory
Corruption Vulnerability
(CVE-2009-1918)
Webserver1--Product Web
Service
129.174.124.53:8080 SQL Injection (CWE89)
Webserver2--Portal Web
Service
129.174.124.53:80 SQL Injection (CWE89)
Administrator 129.174.124.137 Cross Site Scripting Flaw (XSS)
Database server 129.174.124.35
5 Attack Graphs and Tools
Attack graphs can serve as a basis for network attack detection, defense and forensics
analysis [10]. Given a set of vulnerabilities in a system, an attack graph analysis
provides investigators with potential attack steps that the attacker can take to reach the
attack goals. In this paper, we use an attack graph as an assistance tool to find missing
evidence. We redefined Ou et al.’s logical attack graph model [15] as follows [11].
Definition 2(Logical Attack Graph): A = (N
r
, N
p
, N
d
, E, L, G) is an attack graph,
where N
r
, N
p
, N
d
are called derivation nodes, primitive and derived fact nodes
respectively; E ⊆ ((N
p
∪N
d
)×N
r
)∪(N
r
×N
d
); L is a mapping from a node to its label; G
⊆ N
d
is an attacker’s final goals.
This model uses logical statements in the form of primitive facts to represent
network configurations and vulnerabilities. A derived node consists of facts derived
by applying an interaction rule to other primitive facts and prior derived facts. A
successful interaction is called a derivation node, which is represented by an ellipse.
A diamond and a box represent a derived node and a primary fact node respectively.
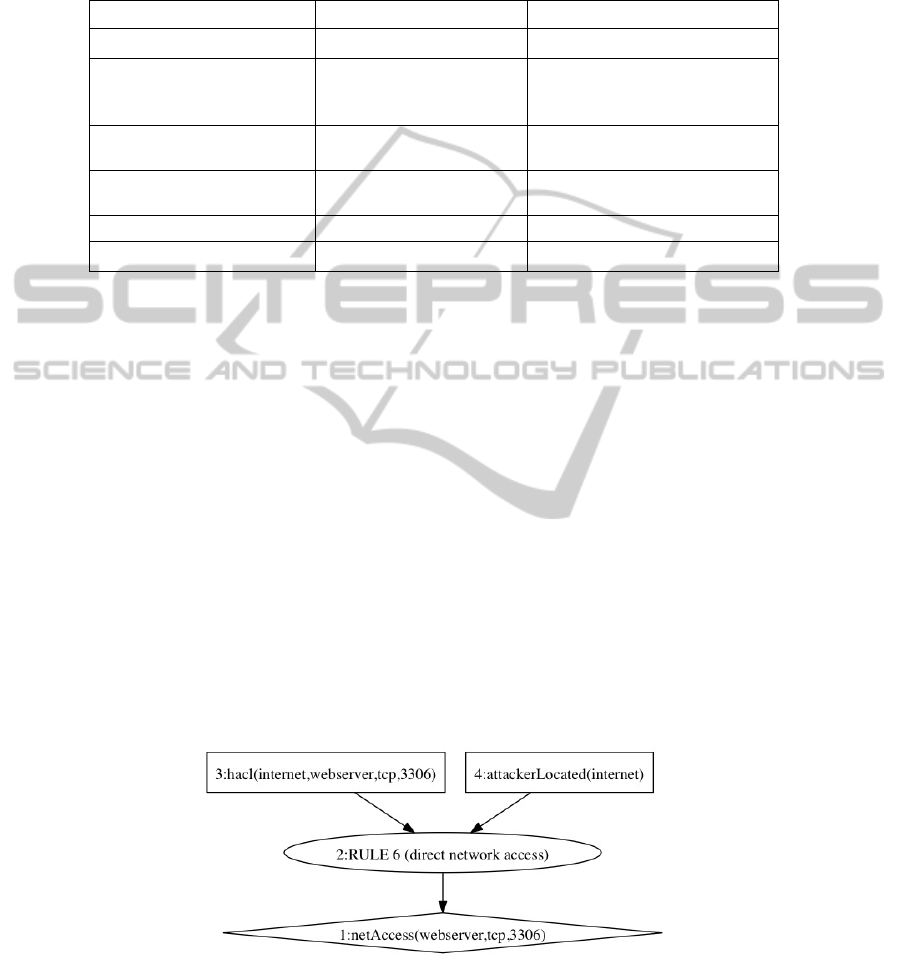
An example logical attack graph is displayed in Figure 2.
Fig. 2. A Sample Logical Attack Graph.
87

Many tools generate attack graphs and security analysts use them to secure
systems and networks. The tool that generates a logical attack graph as Figure 2 is
called MulVAL [13], which uses XSB [17], a Prolog system, to evaluate the Datalog
interaction rules on input facts. Datalog is a syntactic subset of Prolog. MulVAL uses
Datalog literals (such as L(args)) to model network/computer configuration and
vulnerability as input facts, and uses Datalog interaction rules to track simulation
trace by modeling all attack techniques and security semantics. The interactive rules
have the form: L(args):- L
1
(args
1
),…..L
n
(args
n
). MulVal is arranged so that an
execution trace for a query/queries produces an attack graph.
For example, in Table 2, we have two sample general rules. Rule 1 means that
the “competent” “Victim” who operates host computer “H” could access the
malicious input “Software” if (1) “MaliciousMachine” can visit “H” by
“httpProtocol” and “httpPort”, and (2) the attacker is located in the
“MaliciousMachine”. Rule 2 means the attacker gets the permission “Perm” on the
host computer “H”, if (1) vulnerability exists in the “Software” on host computer “H”
that can be reached by “remote Client” with privilege escalation- “privEscalation”; (2)
the “Victim” has the permission “Perm” on the host computer “H”; and (3) the
competent “Victim” who operates host computer “H” accesses the malicious input-
“Software”.
In the interactive rules, the capital identifier in every literal is a variable that will
be instantiated by concrete terms during Prolog run time. MulVAL uses an input file
to hold all the concrete terms (facts). For example, Table 3 holds the facts that
correspond to two rules in Table 2. If a query is made to Rule 2 in Table 2, Prolog
interpreter will instantiate all variables by concrete terms in Table 3 to decide if
corresponding literals in Table 2 are true, and if the evaluation on the rules succeeds.
If it succeeds, this rule records the successful derivation into a trace file, which forms
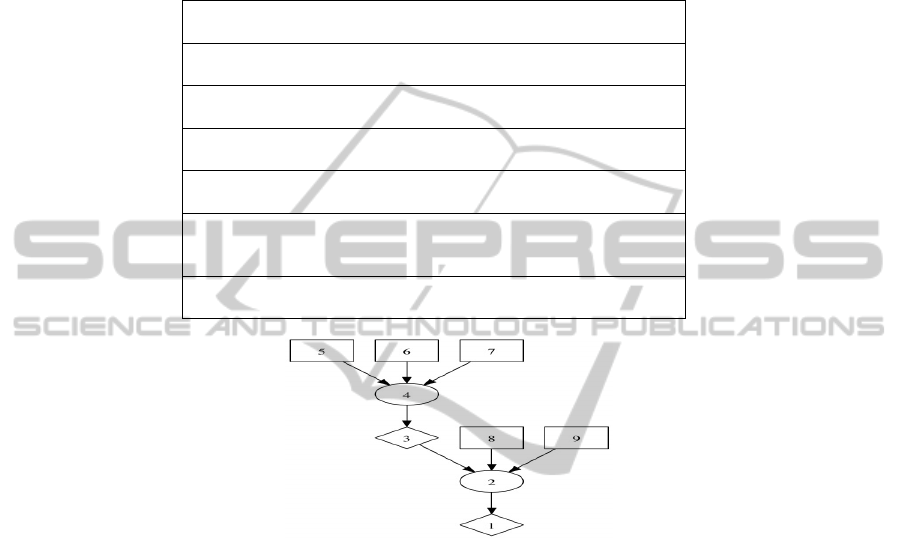
the attack path. The trace steps of querying Rule 2 form an attack graph in Figure 3.
Table 2. MulVAL Reasoning Rules.
Rule1
interaction_rule(
(accessMaliciousInput(H, Victim, Software) :-
competent(Victim),
hacl(H, MaliciousMachine, httpProtocol, httpPort),
attackerLocated(MaliciousMachine)),
rule_desc(‘Browsing a malicious website’)).
Rule2
interaction_rule((execCode(H, Perm) :-
vulExists(H, _, Software, remoteClient, privEscalation),
hasAccount(Victim, H, Perm),
accessMaliciousInput(H, Victim, Software)),
rule_desc(‘remote exploit for a client program’)).
The logical statement and reasoning in MulVAL greatly reduces the size complexity
of an attack graph. However, even with this model, a logical attack graph is still too
large even for a small network, since this reasoning engine traverses all possible
derivation paths. Forensics analysts need visualization tools to look at such an attack
graph. Besides, because such a logical attack graph is constructed by using
vulnerability information, some attack path(s) might be missing or incorrect if the
corresponding exploit/vulnerability information is not complete or correct [16].
88
These drawbacks are hindrance for us to use an attack graph to do forensics analysis,
which is the reason why we use evidence to construct attack scenarios for forensics
analysis. In this paper, we propose to use and extend MulVAL reasoning rules to
achieve this.
Table 3. Machine/Network Configuration Facts.
attackerLocated(internet).
//The attacker is from Internet
competent(employee).
//The user of the workstation is a competent employee
hacl(workStation,internet,httpProtocol,httpPort).
//Workstation can be accessed from Internet
hasAccount(employee,workStation,root).
//The employee has root privilege on the workStation
isClient(MaliciousSite).
//The employee accessed a malicious link
eviExists(workStation,’CVE-2009-1918’,MalicousSite).
//The workstation has CVE-2009-1918 vulnerability, which can
be triggered by accessing a malicious link
vulProperty(‘CVE-2009-1918’,remoteClient,privEscalation).
//This vulnerability allows the attacker comprise the machine
1. execCode(workStation,root)
2. Rule 3(remote exploit for a client program)
3. accessMaliciousInput(workStation,employee,_)
4. Rule 23(Browsing a malicious website)
5. attackerLocated(internet)
6. hacl(workStation,internet,httpProtocol,httpPort)
7. competent(employee)
8. has Account(employee,workStation,root)
9. vulExists(workStation,’CVE-2009-1918’,_,
remoteClient,privEscalation)
Fig. 3. An Attack Graph Generated by Using Rules in Table 2 against Facts in Table 3.
6 Our Reasoning Based Model
This section explains our model that uses and extends MulVAL to correlate event
related evidence including alerts and log to create an evidence graph. The sample
model is shown in Figure 4 (different shapes represent different processing stages). In
this model, we first preprocess evidence that is related to corresponding security
89
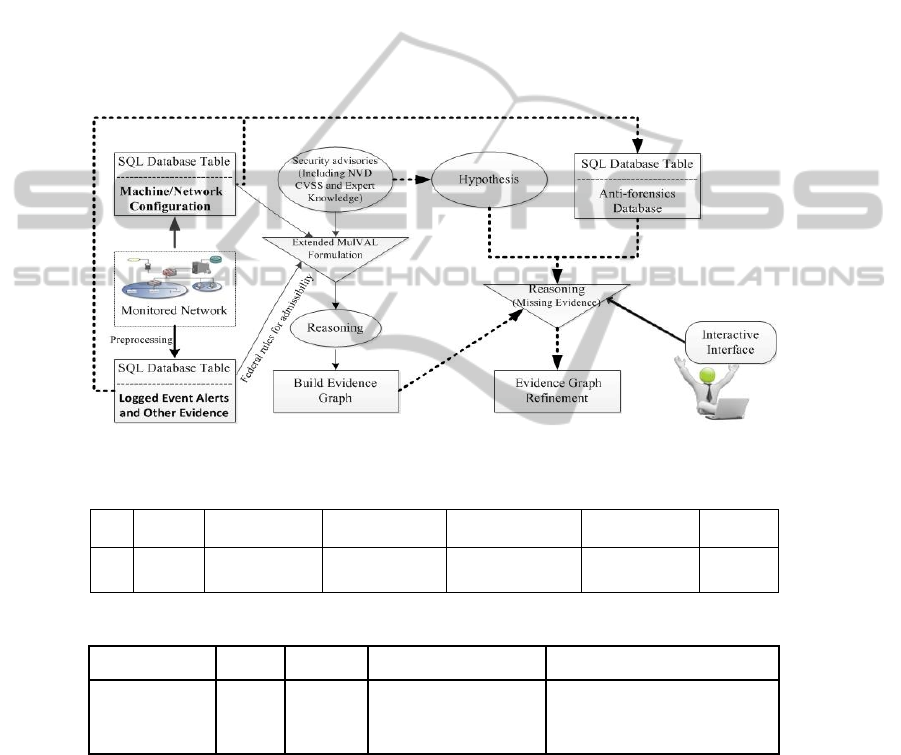
events, and then use a three-stage process to construct the attack scenario in the form
of a graph.
6.1 Pre-processing Evidence
As mentioned in 2.1, in order to reduce the large quantities and false positives of
alerts, we adopted the method in [5] for the logging. At this stage, we pre-process IDS
alerts and log information to serve the next three-stage evidence correlation process.
First, we remove all alerts and log information whose IP addresses are not related to
the attacked network. Afterwards, we categorize the alerts or log information as
primary evidence and secondary evidence. While primary evidence is explicit and
direct about the attack, the secondary evidence is implicit or
Fig. 4. The System Model for Constructing Attack Scenario.
Table 4. Formalized Alert/Log Example.
ID
Time
Stamp
Source IP Destination IP Content Vulnerability Validation
SA1
8/13/13
12:10
129.174.124.122 129.174.124.184
SHELLCODE x86
inc ebx NOOP
CVE-2009-1918 True
Table 5. Vulnerability Database.
Vulnerability OS Software Version Attack Action
CVE-2009-1918 Windows IE
IE 5.01 SP4; IE 6 SP1;IE
6 Win XP SP2 …
Allows remote attackers to execute
arbitrary code via a crafted HTML
document
circumstantial. Because some malicious activities might look benign, we categorize
related normal network traffic log to the secondary evidence. We mainly use primary
evidence to reconstruct the attack scenarios. Only when the primary evidence is not
available, we use corresponding secondary evidence.
In our experiment, we have following alerts as primary evidence: (A)
“SHELLCODE x86 inc ebx NOOP” alerts that are from the attacker to workstations;
90

(2) “SQL Injection Attempt --1=1” alerts from the attacker to “Portal” Web Service;
(3) “WEB-MISC cross site scripting attempt” alerts from the attacker to the
administrator. Our second evidence includes other log information recorded by
webservers and the database server, which includes all clients’ web access and
database query history.
Because XSB-ODBC interface allows XSB users to query databases through
ODBC connections, we formalize evidence to SQL records by using the following
attributes: ID, Timestamp, Source IP, Destination IP, Content, Vulnerability and
Validation (See Table 4 as example). Here, “vulnerability” holds its NVD item that
corresponds to the evidence [19]. The “validation” is used for admissibility reference,
because an alert could be false alert or the attack might not succeed. To validate an
attack, we use investigation tools to investigate the attacked host computers,
confirming that the attack has been successfully launched. Because there are multiple
same alerts or log items on the same attack action, in order to save storage and
improve the efficiency, we only save one instance of the repeated alerts. Besides, we
formalize the vulnerability information from NVD to a database table as Table 5,
using it to pre-evaluate the admissibility of corresponding evidence by querying the
vulnerability characteristics. For example, according to Table 5, “CVE-2009-1918”
only works in IE, so the admissibility of the alert towards a Linux machine should be
zero. The admissibility is up to the judge, but our evaluation could provide important
reference to the court.
6.2 Correlation Stage 1: Inductive Reasoning
In order to correlate alerts and other evidence, we take the timestamp of preprocessed
evidence as the order to reason if there is any causality between the attack states
represented by the corresponding evidence. Because MulVAL reasoning rules use
vulnerability information as Datalog literals, we use the corresponding
“Vulnerability” to represent a piece of evidence. In this case, we can take the
“Vulnerability” and its corresponding network/machine configurations as facts
against the
MulVAL interaction reasoning rules to see if we can get any derived result,
and check if there is any matching evidence. Correspondingly, we make the
correlation between the two pieces of evidence that represent the pre and post condi-
tions of the attack. If there is no any matching evidence, further investigation should
Table 6. The Anti-Forensic Technique/Tool Vulnerabilities Database.
ID Category Tool Technique Windows Linux Priviledge Access Vulneraibility Effect
A1
Attack
tool
Obfuscate
signature
All All User Internet SNORT Rule
Bypass
being
detected by
rules
D1
Destroy
data
BCWipe
Delete file
content
98 Above All User Computer
Delete data
permanently
D2
Destroy
data
Remove
log file
All All User Internet
MySql 5.0
above set log
off command
Set general
log off
.. …
91
be performed to see if there is any other supporting evidence. If the derived result is
failure, there will be no correlation here. Following the time-stamp order, we move on
to the next piece of evidence and repeat the above process.
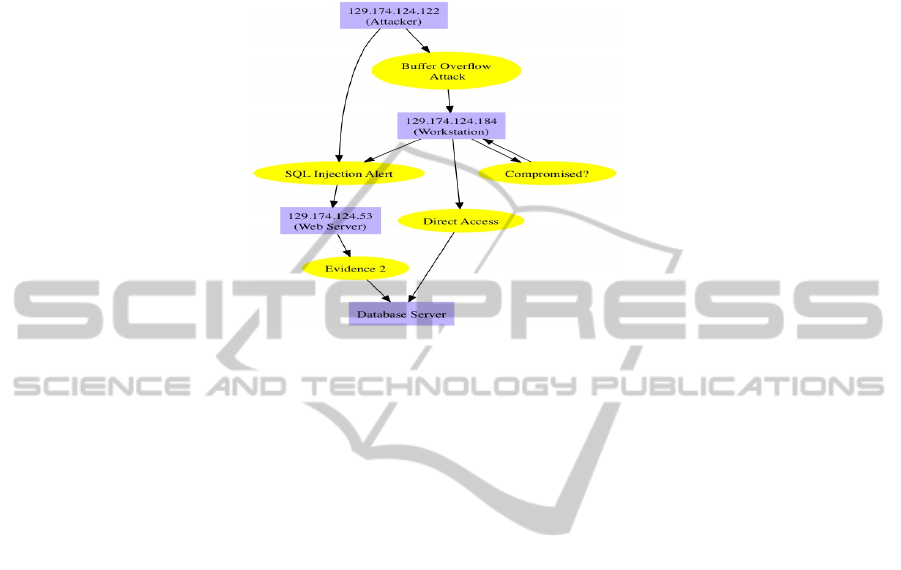
Fig. 5. Match Evidence for Derived Result from Reasoning.
For example, in Figure 5, by querying the reasoning rules in Table 2 on the alert in
Table 4( “SHELLCODE x86 inc ebx NOOP—Buffer Overflow Attack”), we got the
derived result that the workstation should be compromised. Because there is no
available evidence in evidence SQL database showing that the workstation has been
compromised, we used forensics tools to investigate the workstation and were able to
find the evidence proving workstation has been compromised. Correspondingly, we
correlated the attacker to the “compromised” workstation via the “buffer overflow
attack” evidence.
The above correlation is a forward traversing process, which uses rules to find the
consequence (post-condition) of an attack indicated by the corresponding evidence.
We call it inductive reasoning.
In the case where no any evidence can be found to validate the derived attack
consequence, we use an anti-forensics database (Table 6) and the corresponding
technique described in [12] to reconstruct the attack scenario. Our paper [12]
discusses this method in details.
6.3 Correlation Stage 2: Abductive Reasoning
If inductive reasoning cannot correlate evidence in the Alert/Log evidence table to
form an attack step, we use abductive reasoning to find the cause of a given piece of
alert/log evidence. It is possible that the combinations of possible events and states
that can possibly produce a given piece of available alert or log information. That is,
if an event’s scenario fragment whose attack consequence (post-conditions) matches
the given piece of alert/log evidence, we consider the event one of the causes that
produce the given piece of evidence, which should be correlated to the given alert/log
evidence. This process is backward traversing correlation.
Hypothesis is needed for abductive reasoning. Specifically, by analyzing the given
92

evidence (validated alert or log information), forensics experts could use their
empirical expert knowledge or NVD advisory database to speculate what attack
would cause the attack consequence represented by the given evidence. By using this
hypothesis as the attack cause, we do inductive reasoning as mentioned in 6.2, seeing
if we can get the expected derived result matching the given evidence. If such a match
or several matches exist, it proves that the hypothesis could be the right attack cause
of the attack consequence represented by the given evidence. Therefore, investigators
can investigate further to find supporting evidence in order to substantiate and
validate the hypothesis. As mentioned in 6.2, in the case where there is no supporting
evidence, the anti-forensics database and technique described in [12] should be used,
because the attacker might have used anti-forensics techniques to destroy any evidence.
Different forensics experts might have different opinions, and it is possible that
the defense rebuts the arguments presented by the prosecution or present an alter-
native scenario that fits the evidence presented by the prosecution. As such, we apply
the same reasoning rules to all possible hypotheses on the attack cause of the given
evidence, comparing the derived results to see if any of them is more reasonable and
convincing than alternatives. In order to easily compare different hypotheses, we
implemented a GUI interface to display different hypotheses and their corresponding
derived results from the reasoning.
6.4 Stage 3: Global Reasoning
At this stage, we do a final examination on the evidence graphs generated from stage
1 and stage 2, which might have incomplete attack path(s), since only the consecutive
attack steps are correlated. To do so, we map the constructed evidence graphs to the
corresponding logical attack, examining if there is any unsupported attack path [11].
If such an unsupported attack path exists, with the information provided by the logical
attack graph, we do abductive reasoning from stage 2, seeing if the unsupported attack
path could be completed. Our paper [11] has a detailed discussion about the mapping
algorithm, which is used here. In order to reduce the attack graph size, we only use
the related vulnerability and network/computer configuration to get a sub-attack graph
[18].
7 Conclusions
We have proposed a network forensics model, which extends a Prolog logic based
system, MulVAL, to automate the causality correlation between evidence collected
from security events in an enterprise network. In this model, we use different
methods, including inductive reasoning, abductive reasoning and mapping the
evidence to a logical attack graph to construct an evidence graph for network
forensics analysis. In order to resolve the problem of missing evidence, an anti-
forensics database and different hypotheses from different experts are used to seek the
most reasonable explanation on how the attack has been launched and why the
evidence was missing. Our case study showed that such a reasoning system could
automate the network forensics analysis, even under the situations where the attacker
has destroyed the evidence.
93

Disclaimer
This paper is not subject to copyright in the United States. Commercial products are
identified in order to adequately specify certain procedures. In no case does such
identification imply recommendation or endorsement by the National Institute of
Standards and Technology, nor does it imply that the identified products are
necessarily the best available for the purpose
.
References
1. H. Debar ,A. Wespi, “Aggregation and correlation of intrusion-detection alerts”, In Recent
Advances in Intrusion Detection, LNCS 2212, pages 85 – 103, 2001.
2. Keppens, J. and Zeleznikow, J. (2003). “A Model based Reasoning approach for generating
plausible crime scenarios from evidence”, Proceedings of the 9
th
International Conference
of Artificial Intelligence and Law, 51–59. ACM Press, New York.
3. K. F Sagonas, T. Swift, D.S. Warren, “XSB as an Efficient Deductive Database Engine”, In
Proc. of the 1994 ACM SIGMOD International Conference on Management of Data, ACM
Press, 1994, pp. 442–453.
4. P. Sommer, “Intrusion Detection Systems as Evidence”, Recent Advances in Intrusion
Detection 1998, RAID98, Electronic version retrieved 17
th
December 2003
5. S. P. Peisert, “A Model of Forensic Analysis Using Goal-Oriented Logging”, PhD thesis,
Department of Computer Science and Engineering, University of California, San Diego,
March 2007.
6. J. Keppens, Q. Shen, and B. Schafer, “Probabilistic abductive computation of evidence
collection strategies in crime investigation”, In PTroceedings of the 10
th
International
Conference on Artificial Intelligence and Law, 2005.
7. W.Wang, T.E.Daniels, “A graph based approach toward network forensics analysis”, ACM
Transactions on Information and Systems Security 12 (1) (2008).
8. Federal Rules of Evidence, Dec 1, 2010.
9. O. Dain,R. Cunningham, “Building scenarios from a heterogeneous alert stream”, In
Proceedings of the 2001 IEEE Workshop on Information Assurance and Security, pages
231–235, June 2001.
10. S. Jha, O. Sheyner, and J. Wing. “Two formal analyses of attack graphs”, In Proceedings of
the 2002 Computer Security Foundations Workshop, pages 45–59, Nova Scotia, June 2002.
11. C. Liu, A. Singhal, D. Wijesekera, “Mapping Evidence Graphs to Attack Graphs”, IEEE
International Workshop on Information Forensics and Security, December, 2012.
12. C. Liu, A. Singhal, D. Wijesekera. “Using Attack Graphs in Forensic Examinations”,
ARES, page 596-603. IEEE Computer Society, (2012).
13. MulVALV1.1, Jan30, 2012. http://people.cis.ksu.edu/xou/mulval/.
14. M. Whitteker, “Anti-forensics: Breaking the forensic process”, Information Systems
Security Association Journal, pp. 10-16, November 2008.
15. Ou, X., Boyer, W.F., McQueen, M.A., “A scalable approach to attack graph generation”, In
13
th
ACM Conference on Computer and Communications Security (CCS), pp.336345 (2006).
16. A. Singhal, X. Ou, “Security risk analysis of enterprise networks using probabilistic attack
graphs”, Technical Report NISTIR 7788, National Institute of Standards and Technology,
September 2011.
17. David S. Warren et al, “The XSB system version 3.1 volume 1: Programmer’s manual”,
Technical Report Version released on August, 30, Stony Brook University, USA, 2007.
18. C. Liu, A. Singhal, D. Wijesekera, “Merging Evidence Sub Graphs to Create an Integrated
Evidence Graph for Network Forensics Analysis”, Ninth Annual IFIP WG 11.9
94

International Conference on Digital Forensics, January, 2013
19. National Vulnerability Database, http://nvd.nist.gov.
20. A. Jaquith, “Security Metrics: Replacing Fear, Uncertainty, and Doubt”, Addison Wesley,
Mar 26, 2007.
21. Rogers, M. (2006, March 22), Panel session at CERIAS 2006 Information Security
Symposium, retrieved September 11, 2007, from http://www.cerias.purdue.edu/symposium/
2006/materials/pdfs/antiforensics.pdf
22. Erbacher, R. F., “Validation for Digital Forensics”, In: 2010 Seventh International
Conference on Information Technology: New Generations, ITNG (2010).
23. S. Garfinkel, “Network forensics: tapping the Internet,” http://www.oreillynet.com/pub
/a/network/2002/04/26/nettap.html.
24. Kent, K., Chevalier, S., Grance, T., & Dang, H. (2006), “Guide to Integrating Forensics
Techniques into Incident Response”, National Institute of Standards and Technology
(NIST) Special Publication (SP) 800-86, NIST, Computer Security Division, Information
Technology Laboratory, Gaithersburg, MD. http://csrc.nist.gov/publications/nistpubs/800-
86/SP800-86.pdf, December 4, 2006.
25. S. Chen, K. Zeng, and P. Mohapatra, “Efficient data capturing for network forensics in
cognitive radio networks,” in19
th
IEEE International Conf. on Network Protocols, 2011.
Appendix
1: Sample Alert and Log
Alert :
[**] [1:1390:8] SHELLCODE x86 inc ebx NOOP [**]
[Classification: Executable Code was Detected] [Priority: 1]
08/13-12:26:10.399734 129.174.124.122:4444 -> 129.174.124.184:3044
TCP TTL:128 TOS:0x0 ID:32723 IpLen:20 DgmLen:1500 DF
***A**** Seq: 0x7776AFF3 Ack: 0x9B7896FF Win: 0xFFFF TcpLen: 20
[**] [1:1390:8] SHELLCODE x86 inc ebx NOOP [**]
[Classification: Executable Code was Detected] [Priority: 1]
08/13-12:26:19.399734 129.174.124.122:4444 -> 129.174.124.185:3044
TCP TTL:128 TOS:0x0 ID:32723 IpLen:20 DgmLen:1500 DF
***A**** Seq: 0x7776AFF3 Ack: 0x9B7896FF Win: 0xFFFF TcpLen: 20
Apache Tomcat Webserver Log:
…
AT_log 1: 129.174.124.122 - - [13/Aug/2013:14:35:34 -0400] “GET /lab/Test HTTP/1.1” 200 368
MySQL General Query Log:
Gen_log 1:
130813 14:37:29 40 Connect root@localhost on lab
…
40 Query SET GLOBAL general_log = ‘ON’
40 Query select * from profiles where name=’Alice’ AND password=’alice’ or ‘1’=’1’
Gen_log 2:
130813 14:39:56 41 Connect root@localhost on lab
…
41 Query SET GLOBAL general_log = ‘ON’
41 Query select * from profiles where name=’Bob’ AND password=’bob123’
... …
95
