
Towards Real-time Static and Dynamic Profiling of Organisational
Complexity
Kon Shing Kenneth Chung
Complex Systems Research Group, Project Management Program, The University of Sydney, NSW 2006, Sydney, Australia
Keywords: Social Network Analysis, Complexity, Organisational Performance, Operational Performance.
Abstract: In this position paper, I argue that although the definition and quantifiable metric for organisational
complexity may still be controversial, it is possible to capture structural aspects of complexity in both static
and dynamic forms. Based on Kannampallil’s theoretical framework for computing complexity, it is
proposed here that complexity, in an aggregate sense, can be evaluated in terms of (i) the number of
components (NoC) there are within a socio-technical organisation and (ii) the degree of interrelatedness
(DoI) between these components. Given these variables, it is then possible to characterise complexity in
terms of simple, complicated, relatively complex and complex profiles. These profiles serve as useful
toolkits for indicating the complexity level a team, a department or the entire organisation is at for useful
interventions or insights to be made. Adapting the ideas of Pentland, I also argue that with technological
advances in Information Systems, organisations are now able to capture relational or social network data
with relative ease, to construct useful network and complexity maps of individuals, teams and organisations
in real time.
1 INTRODUCTION
Wherever coordination of tasks and resources are
involved, there almost always exists an element of
complexity. The degree to which this complexity
varies depends on a number of factors, e.g. the
intellectual cognitive load required to complete the
task, the experience of the person doing it, the
number of entities (e.g. machines, people) required
to coordinate them, etc. In organisations,
decomposition of structure, tasks and responsibility
is usually required to ensure efficient and effective
completion of tasks to achieve organisational goals.
In projects, meticulous coordination is required for
tasks, resources, scheduled and cost so that the
project can be completed within quality, time and
budget. Although the colloquial meaning of
complexity is often accepted as being “not simple”
or “more than complicated”, complexity is
understood in different ways, not only in different
fields, but has also different connotations within the
same field (Mitchell, 2009).
According to Manson (2001), research in the
science of complexity may be categorised broadly as
either of the three: (i) “Algorithmic complexity” –
which deals with deriving complexity of a system by
appraising the difficulty ascribed to describing
system characteristics by using mathematical
complexity theory and information theory; (ii)
“Deterministic complexity” – which stipulates, using
chaos theory and catastrophe theory, that the entire
system may become de-stabilised or inactive due to
the interaction of certain few key variables; and (iii)
“Aggregate complexity” – which posits that
complexity can be understood by observing how
individual agents interact and work in concert with
each other in the system to create complex
behaviour. In this paper, I focus on aggregate
complexity because I consider the organisation as a
larger system that comprise smaller sub-systems
such as social, technological and group-level. I
contend that the former two streams of complexity
study do not adequately suit organisational systems.
For instance, interactions between knowledge
workers and organisational entities (e.g. computer
systems) are diverse, rich and experiential.
Therefore, information theoretic measures, which
generally identify complexity as the simplest
computational algorithm that can reproduce system
behaviour (e.g. Shannon’s entropy measure
(Shannon, 1948)), are over simplified. Deterministic
complexity is also marred by several limitations,
466
Chung K..
Towards Real-time Static and Dynamic Profiling of Organisational Complexity.
DOI: 10.5220/0004984404660471
In Proceedings of the 16th International Conference on Enterprise Information Systems (ICEIS-2014), pages 466-471
ISBN: 978-989-758-028-4
Copyright
c
2014 SCITEPRESS (Science and Technology Publications, Lda.)

particularly in its applicability to social phenomena
(Mitchell, 2009).
In the following sections, I discuss the definition
of complexity used in this paper, a proposed
framework for computing aggregate complexity and
how it is possible for organistions to capture and
profile it in real-time.
2 EXAMINING AGGREGATE
COMPLEXITY
For the purpose of this study, I define complexity in
terms of one of the most salient concepts postulated
by aggregate complexity – the interrelatedness of
components of a system (Kannampallil et al., 2011).
According to Kannampallil et al. (2011), complexity
of a system is relative in the sense that complexity is
a function of the number of components (NoC) and
the degree of interrelatedness (DoI) within the
system. This definition is in congruence with others
in the field (Manson, 2001; Bar-Yam, 2006;
Johnson, 2007; Mitchell, 2009). In other words, as
both variables increase, so does complexity of the
system. It is also important to note that while
increasing the number of components may make the
system “complicated”, it is the degree of
interrelatedness, or in other words the unique
relationships (both manifest and latent) that makes
the system “complex”. As a consequence, the
interrelatedness of system components results in
properties that characterise complex systems (Bar-
Yam, 2006), these properties being non-
decomposability (that systems cannot be understood
by focusing on components in isolation), emergence
(where unexpected behaviour arises as a result of
component interactions), nonlinear behaviour
(characterised as non-predictability and non-
proportionality of behaviour) and self-organisation
(where individual actors take on different structural
positions so the system can be maintained).
Accordingly, by combining ranges of extremes for
both variables, there can be four conditions
(although not postulated in a prescriptive or
exhaustive manner) to characterise the range of
complexity as in shown in Figure 1.
Firstly, there are simple systems with few
components and low interrelatedness (1), whereby
the system along with its behaviour is easily
predictable, understood, managed and described. For
instance, an individual accountant who runs his own
practice by himself may only have few components,
such as patients, notes and computer, and relations
Figure 1: Range of Complexity (Kannampallil et al.,
2011).
(interaction with computer, customer and
stationery). The accountant is considered to be in a
very simple system. Secondly, systems with many
components and low interrelatedness (2) are also in
many cases, quite predictable to a certain extent
because of the low interrelatedness. For instance, a
receptionist in a firm who handles many phone
requests and relies only on the computer booking
system. Thirdly, relatively complex systems have
few components but a high degree of
interrelatedness (3). Such systems can be studied as
a “whole” because of its few components but high
level of interrelatedness – e.g. section of an
emergency hospital department where members are
few but the interactions are quite diverse. Finally,
complex systems are systems exhibiting high degree
of interrelatedness and many components (4), e.g.
multiple employees from varying organisational
units attending to multiple victims in a disaster-
struck area.
In light of the framework proposed, one cannot
deny the importance of context. According to
Herbert Simon (1996), “one cannot study the
complexity of a system without specifying the
content of complexity”. Therefore, while context is
important, Simon also argues that a complex system
may be decomposed wherever possible, into smaller
functional components, characterized by the
interrelatedness between them. Thus, while the
number of components is easily computable, the
question remains as to what constitutes
“interrelatedness” precisely.
Drawing on closing remarks from Kannampallil
et al. (2011), “…complex systems can typically be
considered in terms of functionally smaller
components and the relations between them, based
on theoretical, rational, and practical
considerations….There often is a structure in the
relationships that exist between care providers,
Degree of
Low
High
Few Many
Number of Components
1
Simple
2
Complicated
3
Relatively
Complex
4
Complex
TowardsReal-timeStaticandDynamicProfilingofOrganisationalComplexity
467

artifacts, and patients….As such, it is possible to
characterize it as a network of actors, where (at a
high level of decomposition) the nodes are actors (or
artifacts) and the edges are their relationships.”
Although no single operational definition of the
construct, interrelatedness, is offered, I argue that
there are two salient measures in network science, in
social networks analysis particularly, that might help
develop an operational definition of the construct.
Firstly, interrelatedness connotes a meaning of
cohesiveness and integration. That is, given a system
which can be represented in the form of a network,
what is the current number of connections, as
opposed to the maximum possible. In social network
parlance, this is specifically referred to as the density
of a given network (i.e. ratio of existing ties to the
theoretical maximum) (Wasserman et al., 1994). The
second important measure that taps into aspects of
interrelatedness is inclusiveness, which refers to the
number connected actors within the network. In
other words, it is the total number of entities or
actors or nodes minus the number of isolated ones
(Scott, 2000). So if we consider a social network of
10 actors, with 5 isolated actors, inclusiveness would
be 5. However, in order to allow for standardization
and comparison across several networks (similar to
the density measure), it is useful to express
inclusiveness as a proportion of the total number of
actors within the network. Therefore, using the
example above, inclusiveness expressed as a
proportion of the entire network would be 0.5, with
the range being 0 to 1. Therefore, while
inclusiveness represents the connectedness of
individual actors within a network, density captures
the extent to which the connections are current as
compared to the latent. So while inclusiveness is a
measure based at the actor level, density is about the
extent to which the actors are connected and is
situated at the tie level. The notion of inclusiveness
is a useful indicator of social network membership
as well group dynamics (Mitchell et al., 1980; Pfeil
et al., 2009) and can thus be used in conjunction
with the density measure as a proxy for
interrelatedness. The following section describes
how complexity profiles can be constructed by using
these measures.
3 COMPLEXITY PROFILES – SO
WHAT?
Consider a knowledge-intensive organisation such as
a hospital emergency department. It comprises
doctors, specialists, nurses, managers, and other
hospital staff members. In effect, this can be
considered as a social system. The hospital also
cannot function without its technology such as
computers, specialist equipment, beds and so on. We
term these artefacts as being part of the the
technological system. Therefore, this healthcare
socio-technical system (which can be represented as
a‘network’), the doctors, patients, specialists and
nurses are treated as ‘components’ of the network.
Artifacts, such as beds, healthcare technologies, used
by the patient or by the medical professionals within
the patient’s network, are also deemed as
components of the network.
If we use the mean value of the ‘number of
components’ and the mean value of the ‘degree of
interrelatedness’ as points of segregation on the x
and y axis of the framework respectively, the range
of complexity can thus be categorized into ‘simple’,
‘complicated’, ‘relatively complex’ or ‘complex’
clusters or profiles. These profiles can then be
associated with a myriad of dependent constructs or
variables such as the coordination of care of the
hospital, patient waiting times, length of patient
queues, which are in a sense aspects of operational
performance and indirectly, organizational
performance. When sufficient historical data is then
collected, one may use the data to fit to whatever
model one is interested in observing or testing.
With the notion of this conceptual modelling
crystallised, applying the same type of modelling to
other domains and disciplines become only a matter
of what phenomena one is interested in studying. For
instance, one may be interested to understand the
aggregate complexity level one’s project team is at.
In the context of Information Technology (IT)
development projects, although there are a myriad of
well-structured project management processes and
frameworks such as Extreme Programming,
PRINCE II methodologies and so on, complexity at
an aggregate level is hardly captured or examined.
At the minuscule level, task complexity may be
measurable; for instance, COCOMO II and Lines of
Code techniques allow for one to establish just how
complex a software program is. Another example
would be the number of dependencies a task has to
and from other tasks within a project plan. In
Critical Chain Project Management, resource
dependencies are also accounted for along with the
normal constraints of quality, time and cost. While
current tools and methodologies are fairly efficient
in capturing such complexity, it does not account for
it holistically. Therefore, a model that accounts for
human-level, organisational-level, group-level and
ICEIS2014-16thInternationalConferenceonEnterpriseInformationSystems
468
technological-level factors is needed. The following
example shows how aggregate complexity can be
captured at both a micro (e.g. individual level) and
macro (e.g. organisational) level.
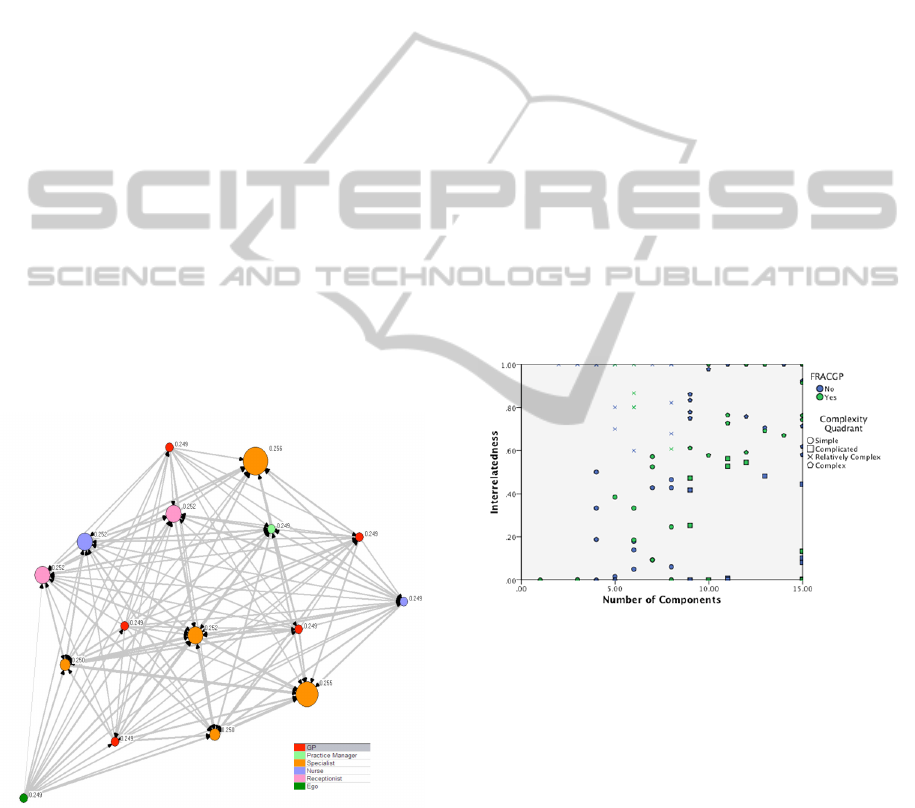
Micro Level: At the individual-level, one can
construct complexity profiles of social-professional
networks of knowledge-intensive workers, that can
be used to associate with individual performance or
decision making (Chung et al., 2013). Taking the
example of a general practitioner as a knowledge-
intensive worker, one can ask him or her to list a
finite (e.g. up to 15) number of contacts who are
important to her in the provision of care. One can
also ask her to elicit the relationship amongst the
contacts she provided, thus completing the entire
socio-professional network (see Figure 2). Once this
is done, mean values of the distribution of number of
contacts (i.e. components of the network) and the
mean values of the distribution of density and/or
inclusiveness of connections (i.e. degree of
interrelatedness) can be derived to define cut-points
for the complexity profiles. These profiles can then
be associated with social and professional outcomes
such as performance, coordination and decision-
making. That is, patterns of performance or
decision-making for various profiles can be
compared (e.g. simple vs. complex) for further
insights, useful for intervention mechanisms.
Figure 2: Example network map of knowledge intensive
worker (ego’s network indicated in bottom left green
colour).
Macro Level: If one wants to understand aggregate
complexity at an organisational level, it is also
possible to account for interdependencies beyond the
individual by accounting for interdependencies
between individuals, departmental units and
organisational units and so on, at specific points in
time. Reverting back to the example where one
wants to understand how such macro-level
complexity may be used to indicate or even provide
a sense of prediction about its impact of overall
organisational or operational performance, I
consider a hospital emergency department (ED), to
illustrate. Here, patients, doctors, human resources
and even artifacts, such as beds, healthcare
technologies, used by the patient or by the medical
professionals, within the boundaries of the ED, can
be deemed as components of the network. Therefore,
in this case, each tie would depict a form of
connection, be it an interaction between the
computer and the nurse, or a communication that
took place between the doctor and the patient, or the
utilization of the bed by the patient. In general, one
may treat these relations as simply
“interdependencies”. One can then start obtaining a
distribution of NoC and DoI variables at various
points in time. Once this is obtained, complexity
profile cut-points can then be obtained from the
distribution and complexity profiles can be obtained
and individual cases can be plotted against these
profiles (Figure 3).
Figure 3: Example Plots in Complexity Profiles.
4 DYNAMIC COMPLEXITY
Much of the description of how aggregate
complexity can be captured detailed above pertains
to static states. In other words, it is analogous to
taking snapshot of the number of components and
interdependencies amongst them within a social or
organisational system at any point in time. Similar to
how movies are essentially multiple frames of
snapshots put together, I argue here that dynamic
complexity is simply capturing various snapshots of
the interactions occurring within the system at
various points in time.
Professor Alex Pentland’s (2012) from MIT
TowardsReal-timeStaticandDynamicProfilingofOrganisationalComplexity
469

Media Labs pioneered the use of wireless tags that
captures relational information as well as body
language, including tone, volume and pitch, from the
communicator. The tags, whose size is similar to
those of name cards can be worn like any ordinary
ID card, are unobtrusive in nature. It ubiquitously
captures the ‘when’, ‘who’, ‘whom’ and ‘how’ of
the communication but not the ‘what’. In other
words, it does not capture content. Therefore, at any
point in time, it is possible for the communication
pattern of individuals to be captured. Furthermore,
with the use of Radio Frequency ID tags also
available these days, it is possible for these tags to
be used to capture relational data, particularly when
individuals deal with non human resources such as
computers, machines, and so on. Pentland used the
patterns of communication captured to associate
with individual and team success. In reality, the
association can be made with other social
phenomenon such as creativity, coordination, etc.
In a similar manner, reverting back to the
example of the hospital ED, it becomes possible for
us to understand how organisational complexity
associates with operational performance such as
patient queues and waiting times. Here, one would
capture the organisational complexity of the ED as a
whole, having these tags in place in both human and
non-human resources. This enables us to capture all
relations and interdependencies at various points in
time. It is also important that at these points in time,
data relating to the dependent variables - patient
queues and waiting times, for instance, should also
be recorded. To illustrate, the relational snapshots
can be taken at every 3 hours in a 24 period, yielding
8 data points. If one does this for a week, there
would be 56 data points and for two weeks, 112 data
points. A distribution of the NoC and DoI can then
be computed, and the mean values for each of these
variables can serve as the relative cutpoints for the
complexity profiles to be obtained. In this manner,
one can compare which organisational complexity
states perform better (e.g. when at the ‘simple’
profile or at the ‘complicated’ profile) in terms of
operational performance.
5 CONCLUSIONS
Complexity is still a controversial topic, one that is
multi-faceted in epistemological stance, in definition
and in oeprationalisation. In general, literature in
complexity studies can be categorised in to
deterministic, algorithmic and aggregate complexity.
In this position paper, I focus particularly on
aggregate complexity and argue that it is possible to
capture structural aspects of complexity in both
static and dynamic forms. Based on Kannampallil’s
theoretical framework for computing complexity, it
is proposed here that complexity, in an aggregate
sense, can be evaluated in terms of (i) the number of
components (NoC) there are within a socio-technical
organisation and (ii) the degree of interrelatedness
(DoI) between these components.
Given these variables, it is then possible to
characterise complexity in terms of simple,
complicated, relatively complex and complex
profiles. These profiles serve as useful toolkits for
indicating the complexity level a team, a department
or the entire organisation is at for useful
interventions or insights to be made. Adapting the
ideas of Pentland, I also argue that with
technological advances in Information Systems,
organisations are now able to capture relational or
social network data with relative ease, to construct
useful network and complexity maps of individuals,
teams and organisations in real time.
REFERENCES
Bar-Yam, Y. (2006). Improving the Effectiveness of
Health Care and Public Health: A Multiscale Complex
Systems Analysis. American Journal of Public Health,
96, 459-466.
Chung, K. S. K., Young, J., & White, K. (2013, 25 - 28
August). Towards a Network-enabled Complexity
Profile for Examining Responsibility for Decision-
making by Healthcare Professionals. Paper presented
at the International Symposium on Network Enabled
Health Informatics, Biomedicine and Bioinformatics,
Niagara Falls, Canada.
Johnson, N. (2007). Simply Complexity. Oxford: Oneworld
Publications.
Kannampallil, T. G., Schauer, G. F., Cohen, T., & Patel,
V. L. (2011). Considering Complexity in Healthcare
Systems. Journal of Biomedical Informatics, 44(6),
943-947.
Manson, S. M. (2001). Simplifying Complexity: A
Review of Complexity Theory. Geoforum, 32(3), 405-
414.
Mitchell, M. (2009). Complexity: A Guided Tour. New
York: Oxford University Press.
Mitchell, R. E., & Trickett, E. J. (1980). Task Force
Report: Social Networks as Mediators of Social
Support. An Analysis of the Effects and Determinants
of Social Networks. Community Mental Health
Journal, 16(1), 27-44.
Pentland, A. S. (2012). The New Science of Building
Great Teams. Harvard Business Review, 90(4), 60-70.
Pfeil, U., & Zaphiris, P. (2009). Investigating Social
Network Patterns within an Empathic Online
ICEIS2014-16thInternationalConferenceonEnterpriseInformationSystems
470

Community for Older People. Computers in Human
Behavior, 25(5), 1139-1155.
Scott, J. (2000). Social Network Analysis: A Handbook.
London: SAGE Publications.
Shannon, C. (1948). A Mathematical Theory of
Communication. The Bell System Technical Journal,
27, 379-423.
Simon, H. A. (1996). The Sciences of the Artificial.
Cambridge (MA): MIT Press.
Wasserman, S., & Faust, K. (1994). Social Network
Analysis: Methods and Applications. New York:
Cambridge University Press.
TowardsReal-timeStaticandDynamicProfilingofOrganisationalComplexity
471
