
Auditing Data Reliability in International Logistics
An Application of Bayesian Networks
Lingzhe Liu
1
, Hennie Daniels
1,2
and Ron Triepels
2
1
Rotterdam School of Management, Erasmus University, Burg.Oudlaan 50, Rotterdam, The Netherlands
2
CentER, Tilburg University, Warandelaan 2, Tilburg, The Netherlands
Keywords: Data Reliablity, Data-level Auditing, Business Intelligence.
Abstract: Data reliability closely relates to the risk management in international logistics. Unreliable data negatively
affect the business in various ways. Due to the competence specialization and cooperation among the
business partners in a logistics chain, the business in a focal company is inevitably dependent on external
data sources from its partner, which is impractical to control. In this paper, we present a research-in-
progress on an analysis method with Bayesian networks. The goal is to support auditor’s assessment on the
reliability of the external data. A case study is provided to illustrate the merits of Bayesian networks when
dealing with the data reliability problem.
1 INTRODUCTION
Reliable data are important for the business partners
operating in international trade and logistics, with
inter-organizational transactions dominating the
daily business in those companies. Inaccurate data
lead to inefficient business administration and of
course inefficient operations. Problems may include,
among others, bad planning, operations disruption,
and financial lost as well as reputation damage.
Simply put, when the data stored and processed in
the information system are not reliably representing
the cargo flows in reality, the companies are exposed
to the risks of losing control. Moreover, inaccuracy
in the data exchanged among partners adds to supply
chain uncertainty, blurring visibility (Klievink et al.,
2012) and eventually compromising the confidence
throughout the chain and the performance of the
whole chain (Christopher and Lee, 2004).
For a focal company in the chain, these are all
commercial risks which negatively affect the market
competitiveness of the company. On the other hand,
failure to manage data reliability can also bring in
compliance risk: in that, fraudulent cases may go
unnoticed, and its supply chain could be exploitable
to international criminals and terrorism.
Auditing the reliability of data serves both
purposes of preventing unintentional errors and
deterring intentional frauds (Cendrowski, Petro,
Martin & Wadecki 2007). Data coming from
internal or external sources should all be audited.
Internally, the audit focus more on the system level
than on the data level, since deploying proper
segregation of duties could better assure that
business operation generates data which will
undeniably correspond to reality (Hulstijn and
Overbeek, 2012). This would be difficult for
external data, because it is not always possible to
directly observe external operations in international
logistics, but only to get data from a third party. For
example, a carrier normally does not observe if
dangerous goods are packed in a container by the
shipper. It has to rely on the face-values of the
container contents stated on a packing list. The
packing list itself is usually provided by a third-party
logistics agent instead of the shipper. In such a case,
data reliability analysis using business intelligence
(BI) would be a useful instrument for detecting
inaccuracies in the external source, regarding the
latter as business exceptions in contrast to the
“normal” reliable data (Liu et al., 2013). The
analysis cannot replace the indispensable controls in
the external operations, such as the direct observer,
yet it serves as an internal control measure that
mitigates the related risks that affect the focal
company.
Due to the uncertainty nature of errors and data
frauds, managing them is a part of organizational
learning. The company learns to recognize the
symptoms indicating that data could be inaccurate
707
Liu L., Daniels H. and Triepels R..
Auditing Data Reliability in International Logistics - An Application of Bayesian Networks.
DOI: 10.5220/0004987507070712
In Proceedings of the 16th International Conference on Enterprise Information Systems (ISS-2014), pages 707-712
ISBN: 978-989-758-028-4
Copyright
c
2014 SCITEPRESS (Science and Technology Publications, Lda.)

and the causes of inaccuracy. BI as a knowledge
distiller helps to capture those indications by
analyzing the patterns hidden in historical data. The
pattern found may have a “side” benefit that they
can be used for other purpose, e.g. mitigating other
type of risks or managerial problems.
In this article, we examine the requirement of
data reliability analysis in the business setting of
international logistics in Section 2, and propose to
use Bayesian networks as the analysis approach.
After comparing the approach with other machine
learning methods in Section 3, we will explore the
applicability of Bayesian networks with a case study
in Section 4 on a data set collected from a freight
forwarding company, for the purpose of auditing the
correctness of their declarations, with discussions
and conclusions in Section 5.
2 DATA RELIABILITY ANALYSIS
WITH BAYESIAN NETWORKS
Reliability is a feature of an object or a system
which indicates how predictable the object or system
behaves. The research on the reliability of data
address the requirement that business decisions have
to be based on “high-quality data”, i.e. data which
are correct, accurate, and always reflecting the
reality (Wang and Strong, 1996). The goal of data
reliability analysis is to detect inaccurate data as a
business exception. The basic approach is to
integrate evidences to prove or disprove the
occurrence of the exception.
Statistical methods can be applied to find
exceptional data, based on how unlikely a piece of
data can occur given that the business behaves
normally. Although statistically “proving” that an
piece of data is exceptional is not always convincing
(Korb and Nicholson, 2003), one could at least infer
about the reality with statistical confidence, given
the evidence.
Two working assumptions are behind the
application of analytics in managing data reliability.
First, the majority of the data are reliable, meaning
that inaccuracy is a rare event; otherwise the
business would not be sustainable. Second, logistics
operations and business behaviors follows a
relatively stable and tractable pattern. For example,
the optimal choice of route for transporting certain
type of goods exists, as the buyer, seller and logistics
service provider makes rational decision basing on
similar economic consideration, such as price,
flexibility and service level (see e.g. Choi and
Hartley 1996; Tongzon, 2009). These assumptions
correspond to two types of uncertainties in the data:
1) the uncertainty of data reliability, which is to
some extend similar to the “measurement error” in
statistics, and 2) the uncertainty of business behavior,
which can be regarded as “structural error”. Note
that, in general these two types of uncertainties are
not distinguishable merely by statistical analysis, yet
the exceptions flagged by the analysis draw attention
for further investigations.
The analysis of exceptions takes the canonical
format of (Feelders and Daniels, 2001):
〈
, ,
〉
because
, despite
(1)
To determine whether the instance under question
is exceptional, its feature is compared with the
same feature of other instances of a reference. If
the difference is large, will be regarded
exceptional, and vice versa. To determine the
threshold for the difference, domain knowledge is
usually incorporated. One can further investigate the
contributing causes
and counteracting causes
to the difference. These causes are by definition the
exceptions on a lower level of details with finer data
granularity. Caron & Daniels (2013) demonstrated
an implementation of this type of analysis on multi-
dimensional data stored in OLAP cubes.
This format of analysis is arguably more suitable
to detect exceptions in managerial settings than
classification approaches, for several reasons. The
detection of business exception is usually an
explorative and unsupervised process, in which it is
difficult to explicitly and a priori define the feature
of an exception. Besides, the exceptional instances
are saliently recognizable only when compared to
proper reference, while the choice of the reference
depends to a large extent on the context of the
business problem. For instance, a piece of inaccurate
data may not be detectable on a case-by-case
comparison with other presumably accurate data of
the same type, but it would be more easily revealed
by comparing to the business behavior which is
summarized out of a set of accurate data. Therefore,
an interactive learning performed by the analyst with
BI support is more preferable in this setting, so that
the analyst can zoom in or out to proper level of
details to find a proper reference.
A Bayesian network is defined as a directed
acyclic graphical model containing a set of random
variables
,
,⋯
and a set of arcs
connecting two random variables
→
,
representing their dependency as a conditional
probability (Jensen and Nielsen, 2007).
We propose to use Bayesian networks to model
ICEIS2014-16thInternationalConferenceonEnterpriseInformationSystems
708

the feature for data reliability analysis (the
investigation for further causes
and
is not
within the scope of this paper). Given the
assumption that the feature of accurate data reflects
business behavior, this feature is unobservable at the
least and can be described with a probability at the
most. This is because the business behavior is
dictated by the economic rationale behind, which is
not captured by the data. Using conditional
probabilities to represent the dependencies of
variables allows a Bayesian network to update our
belief about the business behavior given the data as
evidence. Our proposed approach is to detect the
difference between the behaviors reflected by
accurate and inaccurate data, with the working
hypothesis that the behavior reflected by inaccurate
data will contradict intuitive economic rationale.
A procedure is followed when using Bayesian
networks for the analysis:
1. Identify the managerial problem;
2. Build the conceptual model of the economic
behavior by identifying relevant variables in the
data, as well as their inter-dependency;
3. Estimate and update the probability using
referential data (e.g. historical data);
4. Assess the reliability of target data.
3 RELATED WORKS
Available research dedicated to the use of machine
learning to analyze the declaration data of shipped
goods approach the learning problem from a risk
management perspective and use different
approaches to detect fraudulent declarations. Early
research proposes clustering to divide shipments into
similar clusters, since it appears that shipments
containing large quantities of goods share a lot of
common characteristics (Yan-hai and Lin-yan,
2005). Clustering approaches allow freight
forwarders to improve their risk management by
defining specific risk measures for each cluster of
shipments. More recent research is focused on the
classification task of high risk variables, like the
type of commodity or the paid customs duty. Several
machine learning approaches are proposed to
facilitate this learning task including: decision trees
(Kumar and Nagadevara, 2006), hierarchical
Bayesian modeling (Jambeiro Filho and Wainer,
2007), and association rules (Yaqin and Yuming,
2010). Freight forwarders can use predictions of
high risk variables to take specific risk measures
when they significantly deviate from the provided
declaration data.
4 CASE STUDY
This case study addresses a practical data reliability
problem facing a freight forwarding company ABC.
Freight forwarding companies nowadays strive
to increase the added value in their services, since
their role as an information intermediary is fading as
a result of the trend of globalization and e-Business.
ABC decides to strengthen their competence with
data analytics and knowledge management, while
continuing to excel in traditional services like
customs brokerage.
Being the party who files the declaration, ABC is
exposed to the risks of inaccurate data because it is
dependent on the accuracy of external provided
shipment data, while it will be held responsible for
any fraudulent declarations. Attempts to deal with
this risk from a classic risk management perspective
usually fail. This is because of the lack of control on
the external data source, and most IT controls lack
sufficient intelligence. ABC currently hires internal
auditor to do manual, ex-post verification on the data
accuracy of the filed declaration. In this research, we
aim to explore the innovative approach of using
Bayesian network to deal with the uncertainty during
the declaration process. This approach can support
both the ex-post assessment by the auditor and the
ex-ante assessment by the declarer on the data
accuracy.
4.1 Data
The data used for this case study are obtained from
ABC and constitute an extensive dataset of
international maritime freight transport including
compiled declarations. We collected 13.367
declarations between July 2012 and June 2013. The
declarations were made for 24 type of goods shipped
from 67 different states in the world to the harbors
of Port_P and Port_Q (location is anonymized to
protect confidentiality for ABC’s clients).
For the transportation variables, we used the
country of origin (COO) and the port of destination
(POD) to capture the route that goods took to travel
from the consignor to the importing country. As
ABC also arranges the physical transportation for
the client, data for the two variables can be regard as
coming from internal source and 100% accurate. For
the declaration variables, we identified the
commodity code (HSC), preferential documents
(PRD) and customs weight ratio (CWR) as the most
important variables to compile a declaration. Data
for these three variables come from external sources
and their accuracy need to be analyzed. Constructing
AuditingDataReliabilityinInternationalLogistics-AnApplicationofBayesianNetworks
709
a Bayesian network upon these variables allows
freight forwarders to analyze the patterns of
international trade, i.e. the relationships between the
type of goods and the transportation routes. This
information can be compared with a piece or a set of
the external provided shipment data, and this gives
certain indication on the accuracy of the data during
ABC’s declaration process. Table 1 shows an
example of the records. CWR takes numerical value,
while the rest of the variables are categorical.
Table 1 Example freight data of computers and plastic
articles.
HSC COO POD PRD CWR
8471 Country_S Port_P 100 12
8471 Country_X Port_P 100 10
3926 Country_D Port_P 200 – 035 7
8471 Country_F Port_P 100 11
3926 Country_M Port_Q 100 24
3926 Country_C Port_Q 100 23
4.2 The Bayesian Network
By using a Bayesian network with conditional
probabilities to represent the dependencies between
variables, we can update our belief about a variable
given the fact that other variables received evidence.
Our proposed network exploits this property to gain
more confidence about the accuracy of the external
provided shipment data when compiling a
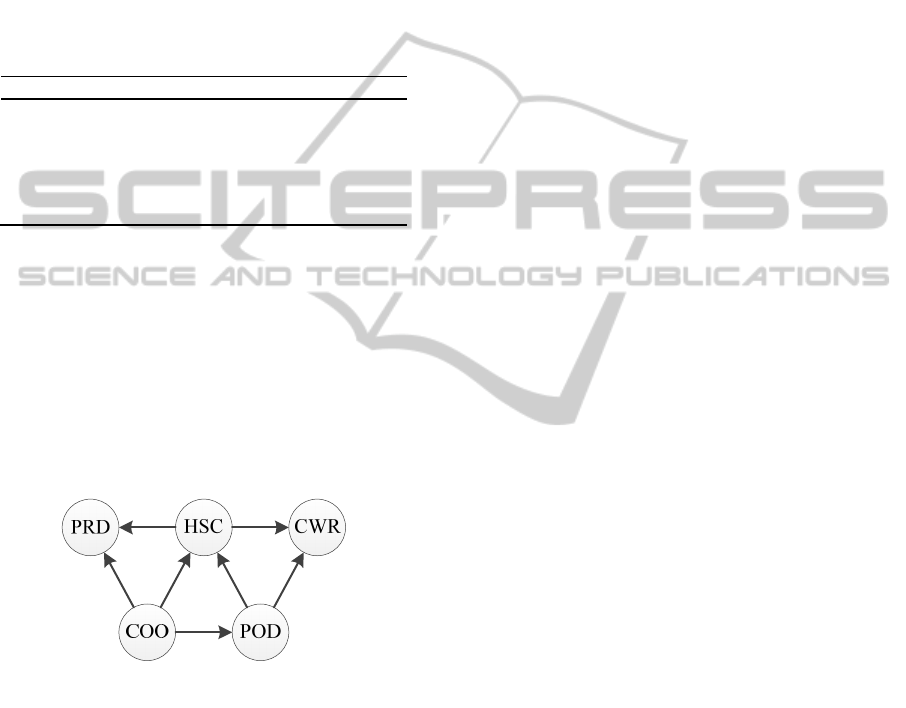
declaration (see Figure 1).
Figure 1: The Bayesian network of declaration variables.
We assume that the shipping routes from the country
of origin to the port of discharge allow us to explain
the declaration variables which at the time of
clearance are uncertain. The network is designed to
answer three main questions:
(I). Do the products stated in the commercial
invoice correspond to reality?
(II). Is the importer allowed to use a preferential
document to import the goods or gain a discount
on the customs duty?
(III). Does the ratio between the weights and the
commercial values of the goods correspond to
reality?
To answer these questions, we first identify the
logical dependencies among the declaration
variables, and then design the network accordingly.
The rationale behind question (I) is the following.
The type of goods is dependent on the origin of the
goods since many countries specialize in the
production and exportation of certain types of goods
according to their available resources and
knowledge. The opposite is also valid: countries that
lack specific goods need to import them from
favored country that is willing to sell. Modeling
these relationships in a Bayesian network requires
the converging relationship between HSC given
COO and POD. This converging relationship would
make COO and POD marginally independent to one
another. This is essentially invalid given the fact that
countries engage in long-term trade relationships
and buy specific goods from preferred countries.
Therefore, an additional arc is added between COO
and POD to include this dependency. Based on this
rationale, a design decision is made to model the
declaration variable (HSC) as conditionally
dependent on the transportation variables (COO and
POD). The arrows between HSC and COO, POD
cannot be reversed; otherwise the model would be
answering a different business question, i.e.
“whether the transportation route is normally /
correctly chosen for certain type for product”.
Reminding the format of exceptions analysis, we
use the dependency relations among HSC, COO and
POD to model the feature of accurate data. Having
this probability allow ABC to determine how likely
a product type (HSC) stated on the commercial
invoice is corresponding to reality and whether the
invoice may contain potential fraudulent information,
given the trading route COO and POD.
We can do similar reasoning for questions (II)
and (III) to incorporate declaration variables PRD
and CWR into the network. We leave this out from
the paper, and the following analysis will focus on
question (I) only.
4.3 Estimating the Parameters
The structure of the network must be parameterized
by determining the conditional probabilities for each
node. Identifying these probabilities based on expert
elicitation is problematic given the high cardinality
of some of the variables. Instead, we estimated each
conditional probability from our dataset given the
structure of our proposed network. The data does not
contain missing values but requires special attention
to deal with inaccurate submitted values. Maximum
Likelihood is used to deal with these inaccuracies.
ICEIS2014-16thInternationalConferenceonEnterpriseInformationSystems
710

4.4 Bayesian Inference
The posterior probability distribution of the target
variable HSC can be calculated when we receive
evidence on the transportation routes for various
types of goods. There has been a body of literature
on inference algorithms for Bayesian networks.
Logic sampling (Korb and Nicholson, 2003) is
applied in this case study to perform reasoning on
our network. Logic sampling computes the posterior
probability for each node in the network, traversing
from the root nodes down to the leaves.
To illustrate the intuition of the model, let’s look
at a fictional scenario in which a new declaration is
to be made for goods transported from the country of
origin Country_C to the port of discharge
Port_P. We use the distribution of as
prior which represents the probability that certain
type of goods are shipped globally during July 2012
to June 2013 (see Figure 2).
The posterior conditional probability
| Country_C, Port_P can be
calculated from the Bayesian network and used as a
decision variable. If the probability is below 0.2 (the
threshold is devised by experience of the experts),
there is doubt on the correctness of the value of HSC.
For instance, posterior conditional probabilities for
plastic articles ( 8471 ) and computers
( 3926) are:
3926| Country_C,
Port_P0.733
(2)
8471| Country_C,
Port_P0.133
(3)
Figure 2: Global shipping behavior.
So the correctness for declarations for plastic articles
transported on this route should be further verified,
e.g. by checking the weight ratio CWR.
In this analysis, the other products than plastic
articles transported on this route are used as the
reference.
Following this line of reasoning, we can then
analyze the change of shipping behavior in certain
period of time. We split the data set into two parts
and calculate the conditional probabilities
respectively:
In the second half of 2012:
3926| Country_C,
Port_P 0.800
(4)
8471| Country_C,
Port_P 0.100
(5)
And in the first half of 2013:
3926| Country_C,
Port_P 0.600
(6)
8471| Country_C,
Port_P 0.200
(7)
An interesting change of shipping behavior is
observed in this transportation route, with the
conditional probability for computers reduced while
that for plastic articles increased. The probability for
plastic articles becomes even higher than or equal to
the threshold 0.2. One should note that the
shipments of both types of goods are increasing
slightly during the same period (see Figure 3). The
change of probability distribution conditional on this
route contradicts the global seasonal effect. This
calls for more attention and further investigation by
the internal auditors in ABC.
Figure 3: Change of global shipping behavior in second
half of 2012 (black) compared with first half of 2013
(grey).
AuditingDataReliabilityinInternationalLogistics-AnApplicationofBayesianNetworks
711

5 DISCUSSION AND
CONCLUSIONS
As an initial attempt, the analysis presented here is
rather basic and for the purpose of demonstrating the
use of Bayesian network. However, it sufficiently
shows the merits of Bayesian inference for the audits
on the correctness of the declarations.
Compared to the OLAP-based analysis, Bayesian
networks provide a lot more flexibilities in modeling
the relations between variables. Bayesian networks
allow us to update our beliefs about the conditional
probabilities of the declaration variables when new
evidence is received. This is especially useful for a
logistics company that is continuously operating and
accumulating data, as trends and changes in shipping
behavior can be monitored. Another merit of
Bayesian networks is their resemblance to the
transportation network in international trade, as the
behavior of transportation and trading routes can be
easily incorporated in the analysis.
When applying this analysis, one should note
that the inference cannot indicate whether a
declaration is incorrect, or vice versa. The analysis
result only gives an indication on the data reliability.
This can still be helpful for the auditor to direct his /
her attention to verify the most suspicious cases.
The quality of the analysis result is of course
sensitive to the choice of the threshold. Expert
knowledge and experience can be brought in for this
choice. Analytically, supervised method like
classification can be combined to complete the
“learning cycle” for this choice.
ACKNOWLEDGEMENTS
This work was supported by the EC FP7 project
CASSANDRA (Grant agreement no: 261795). We
are thankful to the reviewers’ constructive feedbacks.
REFERENCES
Caron, E. & Daniels, H. 2013, “Explanatory Business
Analytics in OLAP.” International Journal of
Business Intelligence Research (IJBIR), vol. 4, no. 3,
pp. 67–82.
Cendrowski, H, Petro, L, Martin, J & Wadecki, A 2007,
The handbook of fraud deterrence,
Choi, T. Y. & Hartley, J. L. 1996, “An exploration of
supplier selection practices across the supply chain.”
Journal of Operations Management, vol. 14, no. 4, pp.
333–343.
Christopher, M. & Lee, H. L. 2004, “Mitigating Supply
Chain Risk through Improved Confidence.”
International Journal of Physical Distribution &
Logistics Management, vol. 34, no. 5, pp. 388–396.
Feelders, A. & Daniels, HAM 2001, “A general model for
automated business diagnosis.” European Journal of
Operational Research, vol. 130, no. 3, pp. 623–637.
Hulstijn, J. & Overbeek, S. 2012, “Integrity of supply
chain visibility: Linking information to the physical
world.” Lecture Notes in Business Information
Processing, vol. 112, pp. 351–365.
Jambeiro Filho, J & Wainer, J 2007, “Using a Hierarchical
Bayesian Model to Handle High Cardinality Attributes
with Relevant Interactions in a Classification
Problem.,” in IJCAI,pp. 2504–2509.
Jensen, F. V. & Nielsen, TD 2007, Bayesian networks and
decision graphs, Springer Science+Business Media,
LLC, New York.
Klievink, B, van Stijn, E, Hesketh, D, Aldewereld, H, et al.
2012, “Enhancing Visibility in International Supply
Chains.” International Journal of Electronic
Government Research, vol. 8, no. 4, pp. 14–33.
Korb, K. B. & Nicholson, A. E. 2003, Bayesian artificial
intelligence, cRc Press.
Kumar, A. & Nagadevara, V. 2006, “Development of
hybrid classification methodology for mining skewed
data sets-a case study of indian customs data,” in
Computer Systems and Applications, 2006. IEEE
International Conference on.,pp. 584–591.
Liu, L., Daniels, H. & Hofman, W. 2013, “Detecting and
Explaining Business Exceptions for Risk Assessment.”
ICEIS 2013.
Tongzon, J. L. 2009, “Port choice and freight forwarders.”
Transportation Research Part E: Logistics and
Transportation Review, vol. 45, no. 1, pp. 186–195.
Wang, R. Y. & Strong, DM 1996, “Beyond accuracy:
What data quality means to data consumers.” J. of
Management Information Systems, vol. 12, no. 4, pp.
5–33.
Yan-hai, L. & Lin-yan, S 2005, “Study and applications of
data mining to the structure risk analysis of customs
declaration cargo,” in e-Business Engineering, 2005.
ICEBE 2005. IEEE International Conference on,pp.
761–764.
Yaqin, W. & Yuming, S. 2010, “Classification Model
Based on Association Rules in Customs Risk
Management Application,” in Intelligent System
Design and Engineering Application (ISDEA), 2010
International Conference on,pp. 436–439.
ICEIS2014-16thInternationalConferenceonEnterpriseInformationSystems
712
