
The Impact of Agile Approaches on Software Quality Attributes
An Empirical Study
Doaa M. Shawky and Salwa K. Abd-El-Hafiz
1
Engineering Mathematics Department, Faculty of Engineering, Cairo University, Giza 12613, Egypt
Keywords: Agile Development, Software Metrics, Binary Logistic Regression.
Abstract: Agile software development describes those software systems which undergo rapid changes as a result of
the testing and requirements fulfillment processes. This development technique came into view in order to
overcome the drawbacks of long software life cycles of traditional development methods. This paper
investigates the effects of agile practices on the quality of the produced software systems. We have used 20
open and closed source systems of various sizes and functionalities. While the development process of 9 of
the studied systems followed agile approaches, the rest were developed using traditional approaches. Firstly,
a set of software metrics is generated to describe each system. The metrics encompass complexity and
inheritance characteristics of the studied systems. Secondly, the generated metrics are used as predictors of
the type of the followed development process using binary logistic regression. The obtained high goodness-
of-fit measures show the strong relationship between the used metrics and the type of the followed
development process. More specifically, the study reveals that following agile practices has a great impact
on lack of cohesion of methods, fan in and maximum depth of inheritance tree.
1 INTRODUCTION
The term agility refers to rapid movements in
different directions (Lee et al., 2009). Since the
introduction of the Agile Manifesto (Fowler and
Highsmith, 2001), agile development has been
widely adopted. Agile software development
approaches are a set of practices that is based mainly
on iterative and frequent code changes in response to
user’s requirements (Larman, 2003). Most of agility
definitions are related to the enterprise as a whole. In
practice, however, the same definitions are applied
when we talk about a software development process
as an important part of the enterprise. For example,
in (Kidd, 1995), agility is defined as: “An agile
corporation is a fast moving, adaptable and robust
business enterprise capable of rapid reconfiguration
in response to market opportunities”. This definition
relies on adaptability, which is achieved through
reconfiguration capability, with processes,
structures, organization, and people as the key
issues. Applying this definition to a software
development process results in an iterative process
that promotes close cooperation between the
development team and the customers. This usually
leads to more adherence to customers’ requirements.
Previous studies on agile development mainly
focused on end user perspectives where satisfaction
of end user is usually increased by following agile
development (e.g., (Hoda et al., 2011) and (Racheva
et al., 2008)). Only few studies have focused on the
effect of agile development on the software
produced by following agile practices. If we
discover this effect, we may be able to study the
reason agile approaches increase or decrease a
certain software quality. Consequently, we may be
able to modify the practice to make sure that agile
practices have positive effect on this quality
attribute.
In this paper, the impact of agile practices on a
set of OO software systems with different sizes and
functionalities is studied. The studied systems were
developed using agile or traditional methods. Then,
a set of OO metrics that represent complexity,
cohesion and inheritance attributes for each system
is calculated. The used metrics are utilized as
predictors for the type of the development method
using binary logistic regression. Obtained results
show that following agile approaches decreases the
values of some of the used metrics in comparison
with traditional approaches. These metrics represent
complexity of the system. Thus, less complex
49
Shawky D. and Abd-El-Hafiz S..
The Impact of Agile Approaches on Software Quality Attributes - An Empirical Study.
DOI: 10.5220/0004990700490057
In Proceedings of the 9th International Conference on Software Paradigm Trends (ICSOFT-PT-2014), pages 49-57
ISBN: 978-989-758-037-6
Copyright
c
2014 SCITEPRESS (Science and Technology Publications, Lda.)

systems are obtained. This demonstrates that
following agile approaches has a positive effect on
some quality attributes of the software systems.
Thus, agile development not only enhances user
satisfaction but also the quality of the produced
software system.
The rest of the paper is organized as follows.
Section 2 presents the related work. Section 3
introduces a brief background about binary logistic
regression. In Section 4, we present the experimental
study. Finally, Section 5 presents the conclusions
and draws some outlines for the future work
.
2 RELATED WORK
software metrics are a set of measures that provide
some insights about the developed software (Cem
Kaner, 2013). The literature includes many works
that employed software metrics for various tasks. In
(Basili et al., 1996), a study was performed to
predict the power of an object-oriented (OO) metrics
suite that was proposed by Chidamber and Kemerer
(Chidamber and Kemerer, 1994) as quality
measures. The authors concluded that many of
Chidamber and Kemerer's OO metrics are useful to
predict class fault-proneness during the early phases
of the life-cycle. Moreover, many researchers have
used software metrics for fault prediction (e.g.,
(Aggarwal et al., 2009)), component classification as
fault prone or not (e.g., (Nagappan et al., 2006)),
effort estimation (e.g., (Jeffery et al., 2001)),
estimation of software information content
(e.g.,(Abd-El-Hafiz, 2001)), clone detection (Abd-
El-Hafiz, 2011, Abd-El-Hafiz, 2012, Shawky and
Ali, 2010a, Shawky and Ali, 2010b) and re-
engineering or maintenance activities (Kitchenham,
2010, Shawky, 2008).
For instance in (Olague et al., 2007), the authors
have used several OO complexity metrics to
measure their predictive power of the quality and
reliability of OO software systems. The used metrics
include McCabe cyclomatic complexity, weighted
methods per class, average method complexity, and
four more complexity metrics. The predictive power
of these metrics was investigated using statistical
methods. Six versions of the Mozilla Rhino system,
which has a highly iterative development process
that is very similar to agile development, were
analyzed. The obtained results proved that OO
metrics can predict fault-prone classes in Rhino. The
limitation is the analysis of one system only, which
makes the generalization of their findings
questionable. Also in (Aggarwal et al., 2009), a
similar study was conducted to analyze the effect of
some OO metrics on predicting the faulty classes.
The main difference is the inclusion of OO
inheritance metrics in the study. The case study
included 12 different systems that were developed
by undergraduate engineering students. The study
concluded that cohesion and coupling metrics are
correlated to fault proneness. The limitation of the
presented approach is the small-sized case studies
that were developed by non-professional developers.
Thus, the results may be biased and non-
generalizable. A similar study was conducted, in
(Concas et al., 2012), on the evolution of a web
development project that used software metrics and
agile practices. The authors concluded also that there
is a relationship between the evolution of the applied
metrics and the applied agility practices.
Moreover, (Capiluppi et al., 2007) have studied
the evolution of a system that was developed using
Extreme Programming (XP). McCabe cyclomatic
complexity number was used as a measure of
complexity. The authors compared this number
between successive releases. The study concluded
that agile approaches allow for smooth growth and
less complexity. The major threat to validity of the
used approach is that they only used one software
system in the study. Also in (Giblin et al., 2010), the
authors studied two similar applications that were
developed by the same team. While one of these
applications was developed using agile practices, the
other was developed using the waterfall method. The
differences between the two systems were
characterized using software metrics. The authors
also concluded that agile practices yielded code with
better quality and maintainability characteristics. In
addition, in (Dybå and Dingsøyr, 2008), the authors
have studied the adoption of agile practices in
industry. The study investigated XP almost
exclusively. The main findings of the study are that
there is a lack of a complete adoption of agile
practices and that the number and quality of studies
on agile software development needs to be
increased. Also in (Korhonen, 2013), the author has
studied the impact of agile practices on software
quality in a large distributed organization. The study
employed defect data metrics and surveys of
involved personnel, and revealed the great effect of
the adoption of agile practices on the software
quality. However, the study used software systems
from the same organization which constitutes an
external threat to the obtained results.
ICSOFT-PT2014-9thInternationalConferenceonSoftwareParadigmTrends
50

3 LOGISTIC REGRESSION
To model the relationship between a categorical
outcome variable and a set of predictor variables,
logistic regression is frequently used. Traditionally,
logistic regression assumes that the model, which
represents the binary or dichotomous output Y, can
be expressed as (Harrell, 2001):
(1)
Where X is a vector that contains
, i = 1, 2, …,
n independent predictor variables,
is the
conditional probability of experiencing the event
1given the independent variable vector , and
is a random error term.
We can express
as follows.
1|X
1
(2)
where β is the model’s parameters vector.
Alternatively, (2) can be written as follows.
ln
1
⋯
(3)
This function is known as the logit link function.
Although the RHS is linear in ’s, the LHS is not
linear in the response variable . In addition, the
predicted values should belong to [0, 1]. Thus, the
usual least squares methods cannot be used to
estimate the parameters. Instead, a method known as
maximum likelihood is used to obtain these
estimates (Hamilton, 1994). Also, another useful
form for the logit function is the following:
oddsratio
π
1π
P
Y
1
P
Y
0
e
(4)
where "odds ratio" is known as the odds of the event
= 1 occurring. For example, if π = 0.8 then the
odds ratio of = 1 occurring are 4, or 4 to 1.
Usually, the effect of the independent variable
on
the odds ratio, is quantified by the term
as it
represents the change in the odds ratio for a unit
change in the independent variable
while keeping
all other parameters constant. Large values of this
term is an indication that the corresponding predictor
has a large effect on the predicted probability of the
output. Thus, it can be used to rank the predictors
according to their impact on the output.
When we apply logistic regression, several
measures can be calculated to evaluate how the built
model fits the observed data points. For instance,
suppose that data are collected on a discrete variable,
Y, with k categories. We can arrange the
observations in a one-way table. A one-way table
means that observations are classified according to
the values of a single categorical variable. The
number of values this variable can hold is called the
size of the table denoted by k. Thus, a one-way
frequency table with k cells will be denoted by the
vector: Y = (Y
1
, Y
2
,…,Y
k
) where Y
j
and y
j
are the
observed value and the count or frequency of the
observed value in cell j, respectively. Also,
∑
is the number of observations. One of the
commonly used measures of goodness of fit is the
Pearson goodness-of-fit test. In this test, a statistic
is calculated as follows (Hosmer et al., 1997,
Pregibon, 1981).
(5)
where O
j
=y
j
is the observed count in cell j, and if we
denote the model's output for cells j by
, j = 1, 2, .
. . , k, then E
j
= E(Y
j
) = n
is the expected count in
cell j under the null hypothesis that the assumed
model is a good one.
Another useful measure that is commonly used is
the deviance statistic (Agresti, 2002). The deviance
statistic is given by:
2
ln
(6)
Pearson and deviance statistics measure how
closely the model fits the observed data. If the
sample proportions p
j
=y
j
/nare exactly equal to the
model's
for cells j=1, 2, . . . , k, then O
j
=E
j
for all
j, and both
and
will be zero. That is, the
model fits perfectly. On the other hand, if the sample
proportions p
j
deviate from the
's computed under
the null hypothesis, then
and
are both
positive. Large values of
and
mean that the
data do not agree well with the assumed model. We
can reject the null hypothesis of good fit if the
computed
or
exceeds the theoretical value of
the statistic with degree of freedom that is equal to
k–1 and 95% degree of confidence (
1
whereα0.05. This is the value for which the
probability that a
random variable is less than
or equal to 1–. If the p-value is less than 0.05, we
can reject the null hypothesis with a 95% degree of
confidence. Thus, for models with adequate fit, the
p-values for these test statistics should be larger than
0.05. In this case, we cannot reject the null
TheImpactofAgileApproachesonSoftwareQualityAttributes-AnEmpiricalStudy
51

hypotheses. It should also be mentioned that, in this
case, we cannot confirm the goodness of fit. In
practice, it is a good idea to compute both
and
to see if they lead to similar results. If the
resulting p-values are close, then we can neglect the
effect of the small sample size.
If we need to know more about the deviation
between each observed value and its fitted one, we
can calculate the residuals. Two common residuals
are the Pearson and deviance residuals (Agresti,
2002). Using the Pearson goodness of fit statistic,
can be written as follows.
∑
,where
=
(7)
where
represents the contribution of y
j
to the
.
The Pearson residual for the j
th
cell is
=
.
The sign of
indicates whether the observed value
is greater or less than the expected one and the
magnitude indicates the departure. If the model is of
good fit for cell j, the absolute value of
should not
be much larger than
.
Testing the hypothesis that individual predictor
has a significant effect on the predicted value of the
output can be done through the application of Wald
chi-squared statistics (
). In this test, the null
hypothesis H
0
is that the corresponding coefficient
of the j
th
predictor is equal to zero. If the p-value
of this test is less than 0.05, then we can reject the
null hypothesis with a 95% degree of confidence.
4 AN EXPERIMENTAL STUDY
In this section, experimental analysis will be
performed in order to investigate the effect of
following agile practices on some software metrics.
The main hypothesis of the study is that agile
practices have a positive effect on some quality
attributes of software systems in comparison with
those that were developed using non-agile
approaches. To test the validity of this hypothesis, a
set that includes systems that were developed using
agile practices in addition to systems that were
developed using non-agile approaches is analyzed.
The analysis is based on statistical modelling using
logistic regression. In Section 4.1, descriptions of
the used systems and metrics are provided. In
addition, Section 4.2 presents the experimental
analysis. Finally, summary of findings and
conclusions are presented in Section 4.3.
4.1 Used Data
The analyzed systems consist of 20 case studies with
varying sizes and functionalities. Among the 20 used
systems, 9 of them were developed using agile
methods and the rest were developed using the
traditional waterfall method. These systems were
obtained by applying an internet search using
Google search engine with the keywords “agile
development + source code”. By investigating the
documentations related to the resulting systems, we
kept only those systems in which there is an explicit
reference to the adoption of agile approaches during
development. For those systems with no such
documentations, we checked the developers’ forums
to make sure that agile practices were applied. Thus,
we filtered out those systems with no evidence of the
adoption of agile approaches. Consequently, we
found a limited number of systems, which were
developed using agile methods, with their source
code available for download. We also used code
examples that were available in some books or
tutorial articles related to agility development. A
description of the used systems is provided in Table
1. In addition, a decision attribute is added to
indicate whether the corresponding system is agile
or not. This attribute is considered as the dependent
variable.
The set of metrics that are used to represent each
system is shown in Table 2. These metrics were
generated using Understand (www.scti.com),
('Understand, a tool for source code analysis and
metrics')('Understand, a tool for source code analysis
and metrics')which is a tool for reverse engineering,
documentation and metrics for source code. The
first column in the table indicates the symbol that
will be used when the corresponding metric is being
referred to throughout the paper. Meanwhile, the
name and the meaning of each metric as given in the
used tool’s manual (http://www.scitools.com/
documents/ metricsList. php) are presented in the
second and third columns, respectively. The used
metrics constitute the set of descriptors (independent
variables) that represent each system. We choose a
set of metrics that describes various characteristics
of a software system in order to be able to reveal the
influence of the agility of the development process
on these characteristics. We used this set of metrics
as we postulate that these metrics may be related to
agility to some extent. For instance, it is logical that
a rapid delivery of software in agile approaches
cannot be easily done if the software is too complex.
This implies possible relationship between
ICSOFT-PT2014-9thInternationalConferenceonSoftwareParadigmTrends
52

complexity metrics and the degree of the agility
process.
4.2 Experimental Analysis
We started our analysis by a preprocessing step in
which we normalized all the used metrics. This is
done using the following equation.
/
(8)
where
is the metric value before normalization,
is the metric value after normalization, and n =20.
In the next step, we applied the t-test with the
null hypothesis that the systems have equal means.
According to the p-values, the metrics were ranked
in an ascending order as follows; m1, m3, m6, m2,
m4, and finally m5. This gives us preliminary
indication that the best discriminating metrics are
possibly m1, m3 and m6. Moreover, to obtain good
results using logistic regression, the predictors
should not be correlated (Le Cessie and Van
Houwelingen, 1994). Thus, in the second step, we
investigated the correlation between the used
metrics. The most highly correlated metrics are m5
and m6. When metric m5 (the one with the largest p-
value) is removed because it is highly correlated to
m6, it is expected that the model fitting results are
enhanced.
Accordingly, when we used all metrics except
m5 in the regression model, the prediction accuracy
has increased. While Table 3 shows the evaluation
of each model with respect to overall model fitting,
Table 4 presents the predicted coefficients for each
metric. Finally, prediction accuracy, precision and
recall for each model are presented in Table 5. As
shown in Table 3, Pearson and deviance statistics
agree which means that the limited number of
samples has a small effect on the obtained results.
Also, the large obtained p-values of the tests makes
us unable to reject the null hypothesis that the
models have adequate fit. In addition, the small
range of Pearson residuals indicates that the models
have good fit. Compared to the maximum absolute
value of the expected theoretical Pearson residual
which is
≅0.7 (
with k=2 for binary
output), the calculated Pearson residuals are
accepted.
The estimated coefficients for each metric are
presented in Table 4. It should be noted that the
metrics m1, m3 and m6 have small p-values (< 0.05)
in all fitted models except in Model 4, where the
metric m5 is added. This is due to the high
correlation between m5 and m6. Moreover, Table 4
indicates that the metrics with the highest effect on
the predicted probability of the output are m1, m6
and m3 (since they have the highest
and their p-
values are less than 0.05). This can be shown from
the last column which gives us an indication of the
odds ratio using each metric. Another result that is
worthy of notice is the negative estimated
coefficients for the three metrics m1, m3 and m6.
This means that as the values of these metrics
increase, the expected output of the model
approaches zero which implies that the predicted
output will favor the non-agile process. Thus, we
can conclude that following agile practices leads to
less lack of cohesion, fan in and depth of
inheritance. Furthermore, Table 5 presents the
accuracy, sensitivity and specificity of the four fitted
models. Despite the fact that these measures indicate
that Models 3 and 4 are better than Model 1 and 2,
the large p-values of most of the parameters in
Models 3 and 4 makes us unable to reject the null
hypothesis of zero contribution of the corresponding
predictors to the output.
4.3 Evaluation and Discussion
In this section, we summarize the main findings and
conclusions of the presented study as follows.
According to the p-values of the t-test,
PercentLackOfCohesion (m1),
MaxInheritanceTree (m3), and CountInput (m6)
can differentiate between the systems that were
developed using agile methods and those that
were developed using traditional methods with a
high degree of confidence.
Close values of Pearson and Deviance test
statistics show that obtained results are reliable.
Thus, we can generalize the findings using a
good degree of confidence.
As shown in Table 3, the ranges of Pearson
residuals are small. The maximum values are
between 0.48 and 0.56 which is close to 0.7.
Thus, we can conclude that the built models
have a good fit to the used data.
As shown in Table 3, the p-values of both
Pearson and Deviance test statistics are close or
equal to one which means that we cannot reject
the null hypothesis of good-fit. We can
conclude that the used sample is a good
representative of the population. Moreover,
logistic regression is a good tool for analyzing
this sample.
TheImpactofAgileApproachesonSoftwareQualityAttributes-AnEmpiricalStudy
53

As shown in Table 4, the p-values of Wald’s
test statistics of all metrics in the four Models
are less than 0.05 except for m2, m4 in Model 3
and m2, m4, m5, m6 in Model 4. Thus, Model 1
and Model 2 are more reliable than Model 3 and
Model 4 since the p-values of all used predictors
are less than 0.05.
As shown in Table 5, the built models have high
values for average accuracy, precision and
recall. Although Models 3 and 4 are the best
models according to these measures, however,
taking into account the p-values of Wald’s test
statistics, we cannot highly trust the results
obtained from them. On the other hand,
performance measures for Model 1 and Model 2
are acceptable. In addition, the p-values of all
used predictors in these two models are small.
Accordingly, we can conclude that Model 1 and
Model 2 are good representatives of the used
systems.
As shown in Table 4, the estimated coefficients
for the three metrics m1, m3 and m6 are all
negative. This means that as the values of m1,
m3, and m6 increase, the built model’s output
will be approaching 0, hence, being classified as
non-agile. Accordingly, we can conclude that
following agile practices leads to less lack of
cohesion (m1), depth of inheritance (m3) and
fan in (m6).
Table 1: Used systems.
System, language Available at: # of Classes # of
Files
# of
Functions
# of Lines
(KLOC)
Agile
Eclipse SDK 4.3,
Java
http://qualitascorpus.com/ 33874 20157
0
608310 2442 1
Ace, C++ http://download.dre.vanderbilt.edu/ 7666 13975 66135 2290 1
VTK, C++ http://www.vtk.org/VTK/resources/ 3322 3340 7444 2939 1
ITK 4.5.0, C++ http://sourceforge.net/projects/itk/files/it
k/4.5/InsightToolkit-4.5.0.zip/download
3200 3420 7390 2834 1
Suneido, C++ http://sourceforge.net/projects/suneido/fi
les/Releases/
290 375 3964 968 1
PayRoll, C# http://www.objectmentor.com/resources/
books.html
112 153 489 1.7 1
Rails4 code
example, Ruby
http://langrsoft.com/index.php/agile-
java/example-code-switch-to-internal-
article
83 127 233 0.7 1
LngrSoft Code
example, Java
http://langrsoft.com/index.php/agile-
java/
46 89 123 0.4 1
Weather code
example, Java
http://www.objectmentor.com/resources/
books.html
15 136 65 0.8 1
Firefox, C++ http://ftp.mozilla.org/pub/mozilla.org/fir
efox/releases/
7823 29642 159711 6242 0
Azureous, Java http://qualitascorpus.com/ 7660 5038 50196 485 0
SharpDevelop 4.2,
C#
http://sharpdevelop.codeplex.com/releas
es/view/87331
7012 2371 94530 37000 0
VLC, C++ http://www.videolan.org/vlc/download-
sources.html
5917 15186 125812 4663 0
Flex 4.0, C++ http://sourceforge.net/adobe/flexsdk/wiki
/Get%20Source%20Code/
2763 3347 8529 245 0
HOXChess, C++ https://code.google.com/p/hoxchess/ 842 2092 9493 402 0
Apache Service
Mix, Java
http://servicemix.apache.org/downloads.
html
837 1052 6122 117 0
FileZilla , C++ http://sourceforge.net/projects/filezilla/fil
es/
206 207 2829 26 0
IsaViz, Java http://www.w3.org/2001/11/IsaViz/#dow
nload
88 53 573 13 0
Quiz, C++ http://www.sourcecodester.com/downloa
d-code
83 64 177 0.6 0
A Game, C++ http://www.sourcecodester.com/downloa
d-code
74 81 153 0.7 0
ICSOFT-PT2014-9thInternationalConferenceonSoftwareParadigmTrends
54
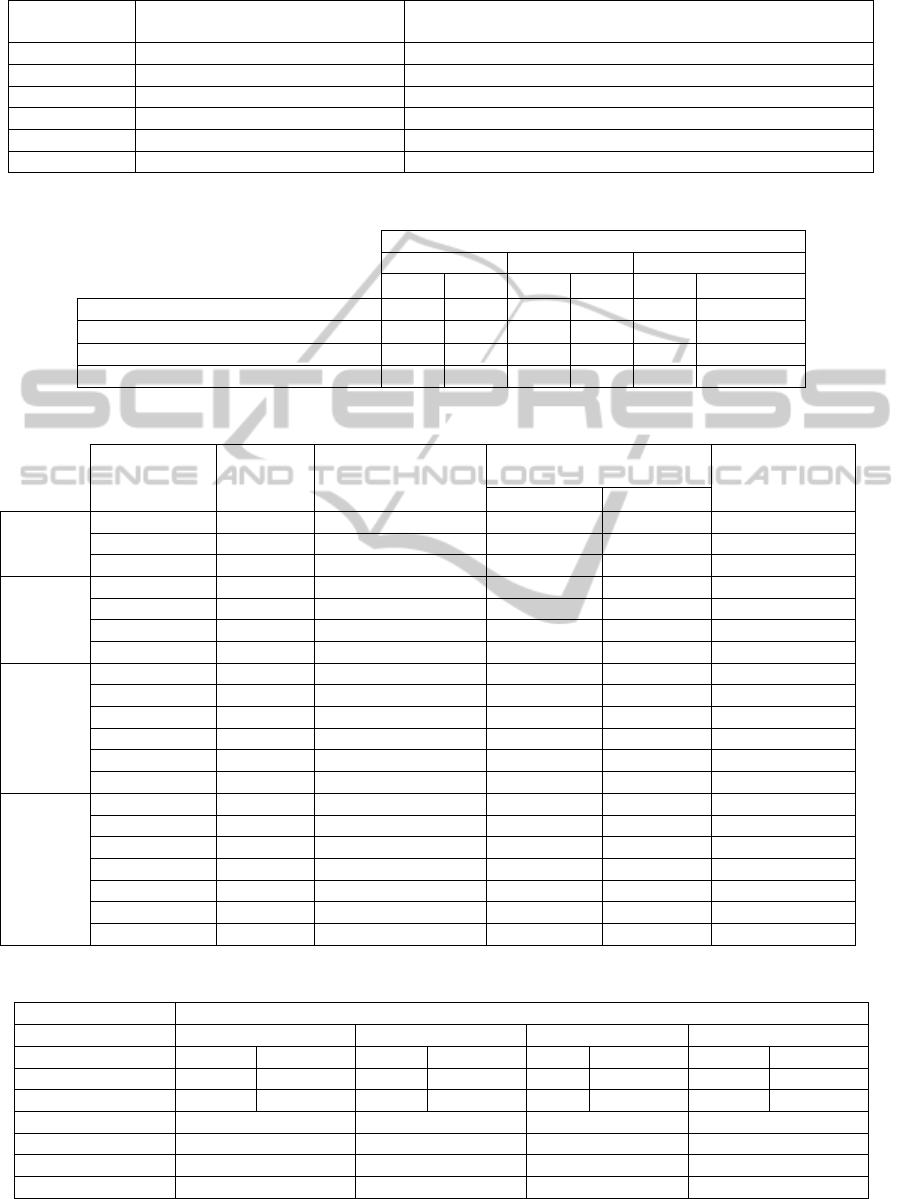
Table 2: Used metrics.
Metrics used
(Predictors)
Metric’s Name Metric’s Meaning
m1 PercentLackOfCohesion (LCOM) 100% minus the average cohesion for package entities.
m2 MaxNesting Maximum nesting level of control constructs.
m3 MaxInheritanceTree (DIT) Maximum depth of class in inheritance tree.
m4 Cyclomatic Cyclomatic complexity.
m5 CountOutput (Fan out) Number of called subprograms plus global variables set.
m6 CountInput (Fan in) Number of calling subprograms plus global variables read.
Table 3: Overall model fitting evaluation.
Goodness-of-fit Test
Pearson test Deviance test Pearson residuals
p
p max. min.
Model 1: using m1, m3 4.86 0.98 5.33 0.98 0.48 -0.62
Model 2: using m1, m3, and m6 4.53 0.99 5.32 0.98 0.53 -0.62
Model 3: using all except m5 4.02 0.99 5.12 0.98 0.56 -0.63
Model 4: using all metrics 4.29 0.98 5.41 0.98 0.55 -0.60
Table 4: Predictors’ evaluation.
Predictor
Standard Error (SE)
Wald’s test
p
Model 1 Constant 2.02 0.26 53.63 1e-6 Not applicable
m1 -0.06 0.02 15.20 7.7e-5 0.94
m3 -0.28 0.08 12.23 0.004 0.76
Model 2 Constant 2.33 0.31 58.15 7e-7 Not applicable
m1 -0.035 0.01 13.67 8e-5 0.97
m3 -0.33 0.08 19.12 7e-4 0.72
m6 -0.98 0.04 6.22 0.039 0.38
Model 3 Constant 2.53 0.34 51.27 6e-6 Not applicable
m1 -0.03 0.01 8.78 0.003 0.97
m2 -0.12 0.10 1.19 0.372 0.89
m3 -0.06 0.06 17.04 0.021 0.94
m4 0.01 0.03 2.24 0.71 1.01
m6 -0.12 0.05 6.20 0.04 0.89
Model 4 Constant 2.20 0.47 25.18 7e-4 Not applicable
m1 -0.02 0.02 9.21 0.001 0.98
m2 -0.06 0.16 0.13 0.73 0.94
m3 -0.22 0.09 12.64 0.003 0.80
m4 0.03 0.13 1.05 0.43 1.03
m5 0.18 0.25 3.67 0.40 1.20
m6 -0.28 0.19 2.33 0.14 0.76
Table 5: Performance evaluation of fitted models.
Observed Predicted
Model 1 Model 2 Model 3 Model 4
Agile Non-agile Agile Non-agile Agile Non-agile Agile Non-agile
Agile 8 1 9 0 9 0 9 0
Non-agile 0 11 1 10 0 11 0 11
Accuracy 0.95 0.95 1 1
Precision 0.89 1 1 1
Recall 1 0.9 1 1
F-measure 0.94 0.95 1 1
TheImpactofAgileApproachesonSoftwareQualityAttributes-AnEmpiricalStudy
55

Figure 1: Predicted probabilities using the four models.
Figure 1 shows the predicted probabilities for the
four models. When the predicted probability of the
output is less than or equal to 0.5, the corresponding
system is classified as non-agile. On the other hand,
a system is classified as agile, if the predicted
probability of the output is greater than 0.5. As
shown in the figure, the predicted probabilities
approximately follow the S-shape curve as expected
for logistic regression models with logit functions.
5 CONCLUSIONS
Agile software development is a promising approach
that overcomes major drawbacks of traditional
approaches. This study investigates the effect of
following agile practices in open and closed source
systems of various sizes and functionalities. A set of
20 systems were characterized by a set of software
metrics. The used set of metrics represents various
characteristics of the analyzed systems such as
complexity and coupling. Finally, a comparison
between the values of these metrics in systems that
followed agile practices and those which followed
traditional approaches was done using binary
logistic regression.
The analysis of the systems is based on
classification by logistic regression to study how
each used metric can well discriminate between the
two classes of systems. The good performance
measures of the built models reveal that, among the
used metrics, the metrics lack of cohesion (m1),
depth of inheritance (m3) and fan in (m6) can
discriminate the two classes with a high degree of
confidence, i.e., following agile approaches has high
effect on these metrics. In addition, agile approaches
lead to decreasing the values of these three metrics.
Since these metrics represent complexity
characteristics, we conclude that following agile
development leads also to less complex systems.
According to the obtained measures, the analyzed
systems are good representatives of the population.
Using the studied sample, it has been
demonstrated that following agile practices (e.g.,
iterative short feature delivery) has certain effects on
the developed systems irrespective of their
functionality. The variation in functionality affects
the metrics values as they are different for each
studied system. On the other hand, when compared
to non-agile practices, there is a consistent finding
which is less complexity as characterized by the
used metrics.
Although the sample size is relatively small, and
it lacks details about the specific agile approaches
that were followed during the development process,
promising results were obtained. More systems
should be added to the analyzed data to add more
power to the generalization. Moreover, we think it
would be very interesting to discover the set of
metrics that are most affected by a certain agile
practice. Also, if enough systems can be found,
considering the functionality of the analyzed system
and the corresponding metrics that might be affected
by this functionality is another point that is worthy
of investigation.
REFERENCES
Abd-El-Hafiz, S. K. 2001. Entropies as Measures of
Software Information. Proceedings of the IEEE
International Conference on Software Maintenance
(ICSM'01). IEEE Computer Society.
Abd-El-Hafiz, S. K. 2011 Efficient Detection of Function
Clones in Software Systems using the Fractal
Dimension and Metrics. Parallel and Distributed
Computing and Networks / 720: Software
Engineering. ACTA Press.
0,00
0,20
0,40
0,60
0,80
1,00
1,20
1234567891011121314151617181920
Predicted Probability
M1
M2
M3
M4
S
y
stem Index
ICSOFT-PT2014-9thInternationalConferenceonSoftwareParadigmTrends
56

Abd-El-Hafiz, S. K. 2012. A Metrics-Based Data Mining
Approach for Software Clone Detection. Computer
Software and Applications Conference (COMPSAC),
2012 IEEE 36th Annual, 35-41.
Aggarwal, K., Singh, S., Kaur, A. & Malhotra, R. 2009.
Empirical analysis for investigating the effect of
objectoriented metrics on fault proneness: a
replicated case study. Software Process: Improvement
and Practice, 14, 39-62.
Agresti, A. 2002. Categorical data analysis, John Wiley &
Sons.
Basili, V. R., Briand, L. C. & Melo, W. L. 1996. A
validation of object-oriented design metrics as quality
indicators. Ieee Transactions on Software
Engineering, 22, 751-761.
Capiluppi, A., Fernandez-Ramil, J., Higman, J., Sharp, H.
C. & Smith, N. 2007 An Empirical Study of the
Evolution of an Agile-Developed Software System.
Proceedings of the 29th international conference on
Software Engineering. IEEE Computer Society, 511-
518.
Cem Kaner, S. M., Walter P. Bond. 2004. Software
Engineering Metrics: What Do They Measure and
How Do We Know? In METRICS 2004. IEEE CS.
Chidamber, S. R. & Kemerer, C. F. 1994. A metrics suite
for object oriented design. Software Engineering,
IEEE Transactions on, 20, 476-493.
Concas, G., Marchesi, M., Destefaniso, G. & Tonelli, R.
2012. An Empirical Study Of Software Metrics For
Assessing The Phases Of An Agile Project.
International Journal of Software Engineering and
Knowledge Engineering, 22, 525-548.
Dybå, T. & Dingsøyr, T. 2008. Empirical studies of agile
software development: A systematic review.
Information and Software Technology, 50, 833-859.
Fowler, M. & Highsmith, J. 2001. The agile manifesto.
Software Development, 9, 28-35.
Giblin, M., Brennan, P. & Exton, C. 2010. Introducing
Agile Methods in a Large Software Development
Team: The Impact on the Code. Agile Processes in
Software Engineering and Extreme Programming, 48,
58-72.
Hamilton, J. D. 1994. Time series analysis, Princeton
university press Princeton.
Harrell, F. E. 2001. Regression modeling strategies: with
applications to linear models, logistic regression, and
survival analysis, Springer.
Hoda, R., Noble, J. & Marshall, S. 2011. The impact of
inadequate customer collaboration on self-organizing
Agile teams. Information and Software Technology,
53, 521-534.
Hosmer, D. W., Hosmer, T., Le Cessie, S. & Lemeshow,
S. 1997. A comparison of goodness-of-fit tests for the
logistic regression model.
Statistics in medicine, 16,
965-980.
Jeffery, R., Ruhe, M. & Wieczorek, I. 2001. Using public
domain metrics to estimate software development
effort. Software Metrics Symposium. METRICS
2001. Proceedings. Seventh International, 2001 2001.
16-27.
Kidd, P. T. 1995. Agile Corporations: Business
Enterprises in the 21st Century - An Executive Guide.
Cheshire Henbury.
Kitchenham, B. 2010. What’s up with software metrics? –
A preliminary mapping study. Journal of Systems and
Software, 83, 37-51.
Korhonen, K. 2013. Evaluating the impact of an agile
transformation: a longitudinal case study in a
distributed context. Software Quality Journal, 21, 599-
624.
Larman, C. 2003. Agile and Iterative Development: A
Manager's Guide, Addison-Wesley Professional.
Le Cessie, S. & Van Houwelingen, J. 1994. Logistic
regression for correlated binary data. Applied
Statistics, 95-108.
Lee, J. C., Scott Mccrickard, D. & Stevens, K. T. 2009.
Examining the Foundations of Agile Usability with
eXtreme Scenario-Based Design. Agile Conference,
2009. AGILE '09, 3-10.
Nagappan, N., Ball, T. & Zeller, A. 2006. Mining metrics
to predict component failures. Proceedings of the 28th
international conference on Software engineering.
ACM, 452-461.
Olague, H. M., Etzkorn, L. H., Gholston, S. &
Quattlebaum, S. 2007. Empirical Validation of Three
Software Metrics Suites to Predict Fault-Proneness of
Object-Oriented Classes Developed Using Highly
Iterative or Agile Software Development Processes.
Software Engineering, IEEE Transactions on, 33, 402-
419.
Pregibon, D. 1981. Logistic regression diagnostics. The
Annals of Statistics, 705-724.
Racheva, Z., Daneva, M. & Buglione, L. 2008. Supporting
the dynamic reprioritization of requirements in agile
development of software products. Software Product
Management, 2008. IWSPM'08, 49-58.
Shawky, D. M. 2008. Towards Locating Features Using
Digital Signal Processing Techniques. Journal of
Engineering and Applied Science, 50, 1-20.
Shawky, D. M. & Ali, A. F. 2010a. An approach for
assessing similarity metrics used in metric-based clone
detection techniques. Computer Science and
Information Technology (ICCSIT), 2010 3rd IEEE
International Conference on, 580-584.
Shawky, D. M. & Ali, A. F. 2010b. Modeling clones
evolution in open source systems through chaos
theory. Software Technology and Engineering
(ICSTE), 2010 2nd International Conference on. V1-
159-V1-164.
TheImpactofAgileApproachesonSoftwareQualityAttributes-AnEmpiricalStudy
57
