
Large-Scale Assessment and Visualization
of the Energy Performance of Buildings with Ecomaps
Project SUNSHINE: Smart Urban Services for Higher Energy Efficiency
Luca Giovannini
1
, Stefano Pezzi
1
, Umberto di Staso
2
, Federico Prandi
2
and Raffaele de Amicis
2
1
Sinergis, Via del Lavoro, 71 Casalecchio di Reno (BO), Italy
2
Fondazione Graphitech, via alla cascata, 56/C Trento (TN), Italy
Keywords: CityGML, WebGL, 3D City Model, Smart City, Interoperable Services, Energy Efficiency, City Data
Management, Open Data.
Abstract: This paper illustrates the preliminary results of a research project focused on the development of a Web 2.0
system designed to compute and visualize large-scale building energy performance maps, so called
“ecomaps”, using: emerging platform-independent technologies such as WebGL for data presentation, an
extended version of the EU-Founded project TABULA/EPISCOPE for automatic calculation of building
energy parameters and CityGML OGC standard as data container. The proposed architecture will allow
citizens, public administrations and government agencies to perform city-wide analyses on the energy
performance of building stocks.
1 INTRODUCTION
During the last years, one of the hottest topics in the
information technology research area has certainly
been the one about “smart-cities”. But, what is a
smart-city? What is its role in shaping the quality of
our life?
Many definitions exist in the current literature,
for example (Giffinger et al. 2010, Bowerman et al.
2000, Washburn et al. 2009, Giffinger 2007) define
a smart-city in different ways, but all of them have a
factor in common: the existence of an underlying
ICT infrastructure that connects the physical
infrastructure of the city with web 2.0 capabilities
and enables innovative solutions for city
management, in order to improve sustainability and
the quality of life for citizens.
Typical factors that are taken into consideration
when the “quality of life” offered by a city,
especially a big city or a metropolitan area, is
evaluated are:
Level of urban traffic.
Quantity and quality of green spaces.
Public transportation efficiency.
Level of air pollution.
Services to citizens (schools, hospitals, etc.).
However, there are also other, less-intuitive,
factors that have an impact on the overall city
ecosystem. A factor that, tackled by an ICT-enabled
smart approach, would increase the quality of life of
city dwellers is certainly the energy consumption
efficiency of residential houses. Increasing building
energy efficiency would not only mean a cut-down
in energy expense for citizens, but would also have
an impact on the overall production of CO
2
(at
energy plants) but also, less intuitively, on the city
air pollution. In fact, researches conducted in this
area (Fenger, 1999) demonstrated that the major
causes of poor air quality are actually industries and
domestic heating systems, not the quantity of
vehicles circulating in the urban area, as one might
more typically think.
So, how can ICT tackle this topic? What kind of
smart service can be designed in order to support the
increase of building energy efficiency and improve
the city quality of life in this respect? What we
present in this paper is a specific answer to these
questions. The paper will illustrate the concept and
the development of smart services which will allow
to assess the energy performance of all the
residential buildings in a city and to visually deliver
that information with a language accessible not only
to experts, but to the entire city population alike.
170
Giovannini L., Pezzi S., di Staso U., Prandi F. and de Amicis R..
Large-Scale Assessment and Visualization of the Energy Performance of Buildings with Ecomaps - Project SUNSHINE: Smart Urban Services for
Higher Energy Efficiency.
DOI: 10.5220/0004997001700177
In Proceedings of 3rd International Conference on Data Management Technologies and Applications (DATA-2014), pages 170-177
ISBN: 978-989-758-035-2
Copyright
c
2014 SCITEPRESS (Science and Technology Publications, Lda.)

The challenge is related to effectively providing
these services on the whole city area, avoiding the
typical discontinuous availability of energy
certification of buildings. Indeed, the classical
building certifications, adopted by many of EU
countries, can provide a very detailed insight on
building energy properties, but on the other hand,
these certifications are not mandatory for all the
residential buildings and their availability is thus
very sparse.
The development of these services is part of the
wider-scope SUNSHINE project (Smart UrbaN
ServIces for Higher eNergy Efficiency,
www.sunshineproject.eu), that aims at delivering
innovative digital services, interoperable with
existing geographic web-service infrastructures,
supporting improved energy efficiency at the urban
and building level. SUNSHINE smart services will
be delivered from both a web-based client and a
dedicated App for smartphones and tablets. In
particular, the SUNSHINE platform is structured
into three main scenarios:
Building Energy Performance Assessment:
Automatic large-scale assessment of building
energy behaviour based on data available from
public repositories (e.g. cadastre, planning data
etc.). The information on energy performances
will be used to create urban-scale maps to be
used for planning activities and large-scale
energy pre-certification purposes.
Building Energy Performance Optimization:
Assessed energy performance data will be used,
together with localised weather forecasts
available through interoperable web-services, to
enable optimisation of energy consumption of
heating/cooling systems through automatic
alerts that will be sent via the SUNSHINE App
to the final users.
Public Lighting Energy Management:
Interoperable control of public illumination
systems based on remote access to lighting
network facilities via interoperable standards, to
enable optimised management of energy
consumption from a web-based client as well as
via the SUNSHINE App.
This paper focuses on the preliminary results for
the first of the three scenarios: Building Energy
Performance Assessment. As we have already
hinted, the aim of the service for Building Energy
Performance Assessment and Visualization is to
deliver an automatic large-scale assessment of
building energy behaviour and to visualize the
assessed information in a clear and intuitive way,
through the use of what we call Ecomaps.
Ecomaps will be publicly available via a 3D
WebGL-based virtual globe that leverages on
interoperable OGC standards, allowing citizens,
public administrations and government agencies to
evaluate and perform analysis on the building energy
performance data.
Having a clear and self-descriptive view of the
energy efficiency state of a city building stock
makes it possible to plan infrastructural maintenance
activities to increase the overall energy efficiency,
allow citizen to save more money and, ultimately,
improve the air quality of the city.
2 STATE OF THE ART
The current availability of relevant technologies and
standards has encouraged the development of many
research projects in the area of building energy
performance estimation based on publicly available
data. These data generally do not include all the
information needed for the energy performance
calculation regulated by the 2006/32/CE directive,
so one of the most critical aspects for these type of
projects is how to estimate the missing information
in a reliable way, using the basic input data that is
typically available, such as building geometry,
building use, construction year, climatic zone, etc.
A common and powerful approach to the
problem, as described in (Nouvel et al., 2013), is to
use the CityGML (City Geography Markup
Language) OGC standard (Gröger et al., 2008) to
semantically describe the set of objects that compose
the urban environment, exploit a building typology
database (such as the outcome of TABULA project,
Ballarini et al. 2011) to statistically estimate the
energy performance properties of buildings and,
finally, define an Application Domain Extensions
(ADE) to store the estimated information in the
GML of each building (Carrión et al. 2010, Kaden
et al. 2013, Krüger et al. 2012).
A radically different approach is described in
(Hay et al., 2010), where operational energy
performance of buildings is estimated from thermal
images acquired by airborne thermal cameras.
Both approaches have pros and cons: in the
former case, input data are publicly available,
requiring no additional cost; the main limit is instead
represented by the energy performance estimation
process that takes into consideration only residential
buildings (other typical building use typologies are
offices, schools, sport facilities, warehouses,
factories, etc.). Moreover, the overall software
architecture is typically desktop based, so the access
Large-ScaleAssessmentandVisualizationoftheEnergyPerformanceofBuildingswithEcomaps-ProjectSUNSHINE:
SmartUrbanServicesforHigherEnergyEfficiency
171
to the results is often limited to a small number of
users with advanced GIS skills. Another limit is
related to the dissemination and exploitation
activities of the computed results: for performance
reasons, the visualization of CityGML encoded data
is commonly provided via a conversion to KML
(Wilson, 2008), where the link between the building
performance data and its geometry is colour-coded
in each building-style parameter and the other
information stored in the starting CityGML file is
lost.
In the thermal image approach, instead, all the
building use typologies are taken into consideration,
but the cost to collect thermal images to cover an
entire city is hardly negligible. Furthermore, only the
roof surface is evaluated in terms of energy
performance, ignoring the full contribution of walls.
Moreover, the use of proprietary standards does not
encourage the adoption of the same solution by the
research community.
3 SUNSHINE APPROACH
3.1 Architectural Concept
In this chapter, the system architecture of the
SUNSHINE platform is presented. As reported in
the introduction, the SUNSHINE project covers
three different scenarios; however, given the focus
of the paper on the first scenario, the system
architecture description has been rearranged to focus
on the components that are meaningful in this
context.
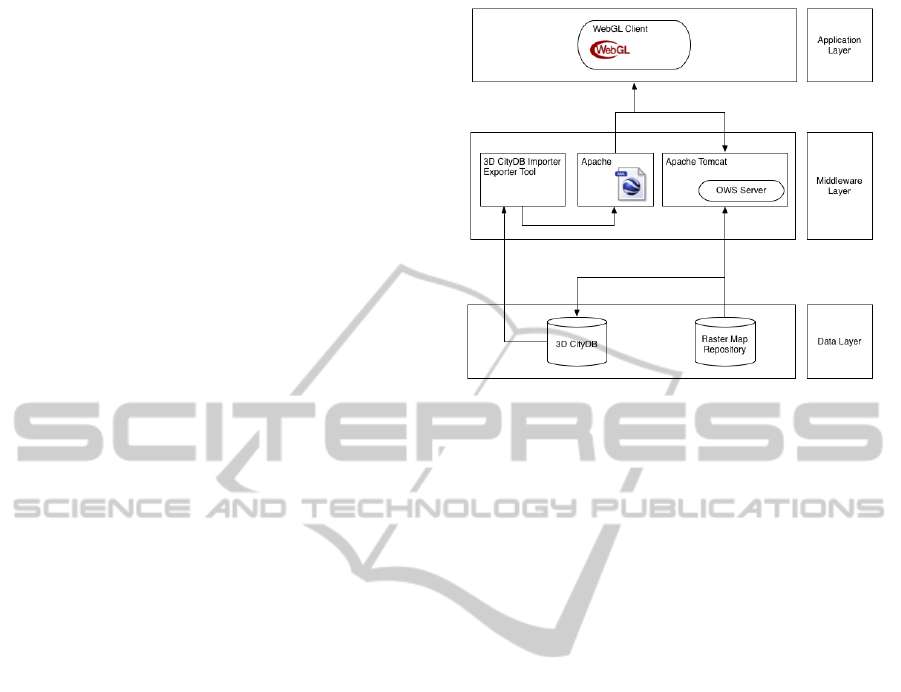
The chosen approach for this scenario was that of
leveraging on a building typology database and the
system architecture that has been designed to
comply with it (see Fig. 1) is based on a Services
Oriented Architecture (SOA) with three tiers (data,
middleware and application layers). A SOA-based
approach allows accessing to the resources through a
middleware layer in a distributed environment and
thus avoids single access-points limitations that are
instead typical for desktop-based architectures.
3.1.1 Data Layer
The bottom level of the SUNSHINE system
architecture is aimed at storing geometry and
semantic information about buildings and thematic
raster data. The two fundamental components of this
layer are the 3D CityDB and the raster map
repository.
Figure 1: System Architecture.
The 3D City Database (Stadler et al., 2009) is a
free 3D geo database designed to store, represent,
and manage virtual 3D city models on top of a
standard spatial relational database. The database
model contains semantically rich, hierarchically
structured, multi-scale urban objects facilitating GIS
modelling and analysis tasks on top of visualization.
The schema of the 3D City Database is based on the
CityGML standard for representing and exchanging
virtual 3D city models.
The 3D City Database is described via a PostGIS
relational database schema and specific SQL scripts
are provided to create and drop instances of the
database on top of a PostGIS DBMS. The main
features of the 3D City Database are:
Semantically rich, hierarchically structured
model.
Five different Levels of Detail (LoDs, see Fig.2).
Appearance data in addition to flexible 3D
geometries.
Representation of generic and prototypical 3D
objects.
Complex digital terrain models (DTMs).
Management of large aerial photographs.
Version and history management.
Matching/merging of building features.
Works with PostGIS 2.0 or higher.
Open source and released under the terms of the
GNU Lesser General Public License v3 (LGPL).
The raster map repository is a data file store
aimed at containing geo-located orthophoto and
elevation files in raster file format.
DATA2014-3rdInternationalConferenceonDataManagementTechnologiesandApplications
172
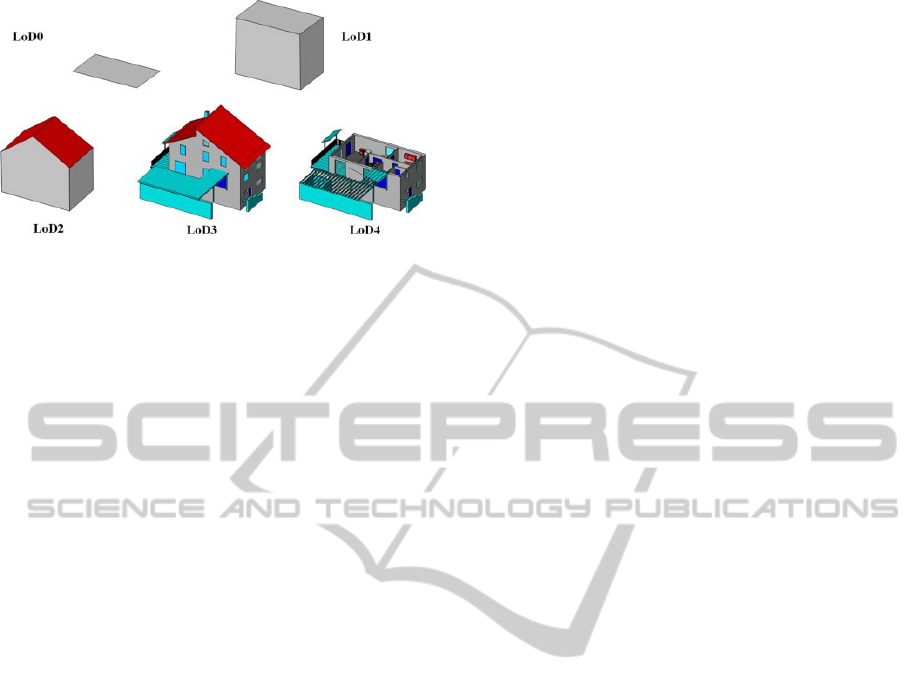
Figure 2: CityGML LOD example.
3.1.2 Middleware Layer
The middleware layer is the core component of the
SUNSHINE platform. Its duty is to manage the
connection between the application layer and the
data layer, providing access to the resources stored
in databases and map repository. The middleware
layer is composed by the 3D CityDB
Importer/Exporter Tool and Apache Tomcat.
The 3D CityDB Importer/Exporter Tool allows
interacting with the 3D City Database or external
data and has the following specific features:
Full support for CityGML 1.0 and 0.4.0.
Exports of KML/COLLADA models.
Generic KML information balloons.
Reading/writing CityGML instance documents
of arbitrary file size.
Multithreaded programming facilitating high-
performance CityGML processing.
Resolving of forward and backwards XLinks.
XML validation of CityGML documents.
User-defined Coordinate Reference Systems.
Coordinate transformations for CityGML
exports.
Matching/merging of building features.
Open source and released under the terms of the
GNU Lesser General Public License v3 (LGPL).
The Apache Tomcat (Apache Community, 2014)
is an open source software implementation of the
Java Servlet and JavaServer Pages technologies.
3.1.3 Application Layer
A further challenge that the SUNSHINE project took
into high consideration is the dissemination and
exploitation of the reached results. A smart-city will
become smarter only if all the involved stakeholders
(citizens, public administrations and government
agencies) are aware about the outcomes of the
research activities in that particular scope. For this
reason, a great effort was put in designing and
implementing a client platform that would be usable
by the majority of devices, both mobile and desktop-
based.
To achieve the widest dissemination possible for
the project’s results, the emerging WebGL
technology (Marrin, 2011) has been employed, in
conjunction with HTML5 elements, as the main
component of the application layer. WebGL is a
cross-platform royalty-free web standard for a low-
level 3D graphics API based on OpenGL ES 2.0,
exposed through the HTML5 Canvas element as
Document Object Model interface.
3.2 Ecomap Generation Workflow
The aim of this section is to describe how each
building is associated with an energy class index.
The energy class is an index describing the energy
performance of a building and it is usually computed
from a series of detailed information on building
energy properties that are not available in general as
public domain data. Publicly available data is
usually limited to more basic information, such as
building geometry, year of construction, number of
building sub-units, etc. So, the approach we
followed was to estimate the energy parameters
needed for performance calculation from the few
publicly available data and to do so we leveraged on
the outcomes of project TABULA (Loga, 2010).
Project TABULA had a two-fold aim:
Define a set of building typologies for each of
the countries participating into the project. Each
country defined a classification of its building
stock basing on 4 parameters: country, climate
zone, building construction year, building size
type. A building stereotype, described in all its
energy properties, is associated to each class,
with the aim of representing the average energy
behaviour for buildings of that class.
Define a common set of parameters to describe
the energy behaviour of buildings and a coherent
common energy balance method, in accordance
with field standards ISO 13790, ISO 15316. In
this way the procedure can be applied to the
entire national building categories and provide a
common framework of reference to compare
computed energy performance parameters.
So, if data are available on country, climate zone,
construction year and size type for a building, than,
via the use of TABULA, it is possible to associate
the building to a specific typology class and thus to
its corresponding building stereotype and its energy
performance properties, including estimated energy
Large-ScaleAssessmentandVisualizationoftheEnergyPerformanceofBuildingswithEcomaps-ProjectSUNSHINE:
SmartUrbanServicesforHigherEnergyEfficiency
173
performance class that will then be shown via the
ecomap.
However, it is to be noted that the building
classification defined in TABULA currently applies
specifically to residential buildings and thus cannot
be used to assess the energy performance of
buildings with a predominant use that is other than
residential (commercial, administrative, industrial,
educational, etc). As a consequence, the ecomap
itself will carry information only for residential
buildings. This seems to us a reasonable
compromise as residential buildings are among the
major causes for energy consumption and air
pollution (Fenger, 1999). It is also to be stressed that
the ecomap, that is the display of the energy
performance classes of residential buildings as
estimated via the use of building typology
stereotypes, is a statistical representation of the
residential building energy condition, so its intrinsic
value lies on the overall picture that it provides, not
on the accuracy of the estimation for any given
specific building.
In order to evaluate the validity of our approach
we foreseen to compare the simulation results with
the information available from the existing energy
certificates for a statistically meaningful number of
buildings.
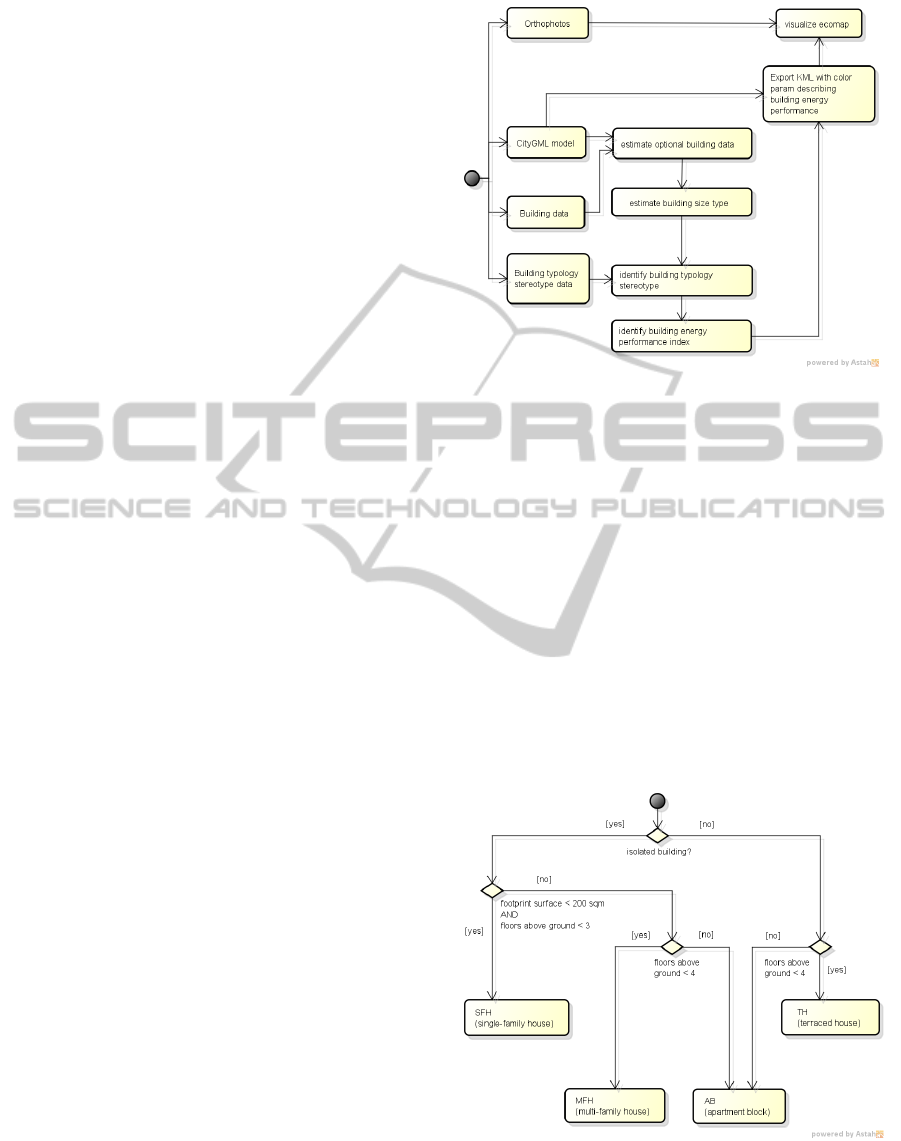
Fig. 3 shows the workflow diagram for the
ecomap generation procedure. The inputs to the
procedure are:
A LoD-1 CityGML model, containing the
information on building geometry and spatial
distribution;
Mandatory building data: country, climate zone,
building main use (residential, non-residential),
year of construction;
Optional building data: refurbishment level
(none, standard, advanced), storey height,
number of floors;
Building typology stereotype data. One building
typology stereotype for each class defined by:
country, climate zone, period of construction,
building size type, refurbishment level.
It can be noted that the information about
building size type class is necessary to identify the
proper corresponding building stereotype, but it is
not among the requested input building data.
TABULA identifies four building size type classes
for residential buildings: single-family house, multi-
family house, terraced house and apartment block.
This kind of data typically is not publicly available,
but it can nonetheless be estimated from the
available building data.
Figure 3: Ecomap workflow diagram.
The simple and clear-cut approach that we have
taken to estimate building size type from the other
data is described in Fig. 4. Only three parameters are
taken into consideration: building isolation (derived
from knowledge on footprint reciprocal position),
footprint surface and number of floors above
ground. The information about storey height and
number of floors is either part of the provided input
or estimated during the building size type estimation
phase by assuming a storey height of 3 meters. The
thresholds for the number of floors above ground
include the mansard space that is usually present in
buildings with sloping roofs. This is a consequence
of LoD-1 building geometrical model that includes
mansard space as an integral part of the building.
Figure 4: Building size type estimation.
Finally, the estimated data about building size
type is used to identify the proper building
DATA2014-3rdInternationalConferenceonDataManagementTechnologiesandApplications
174
stereotype from the available typology classes. If the
information about refurbishment level is not
provided in input, than it is assumed that no
refurbishment activity has been performed on the
building. From that, the energy performance
parameters are derived, including the energy
performance class index to be shown in the ecomap.
3.3 CityGML Extension for Building
Energy Performance Data
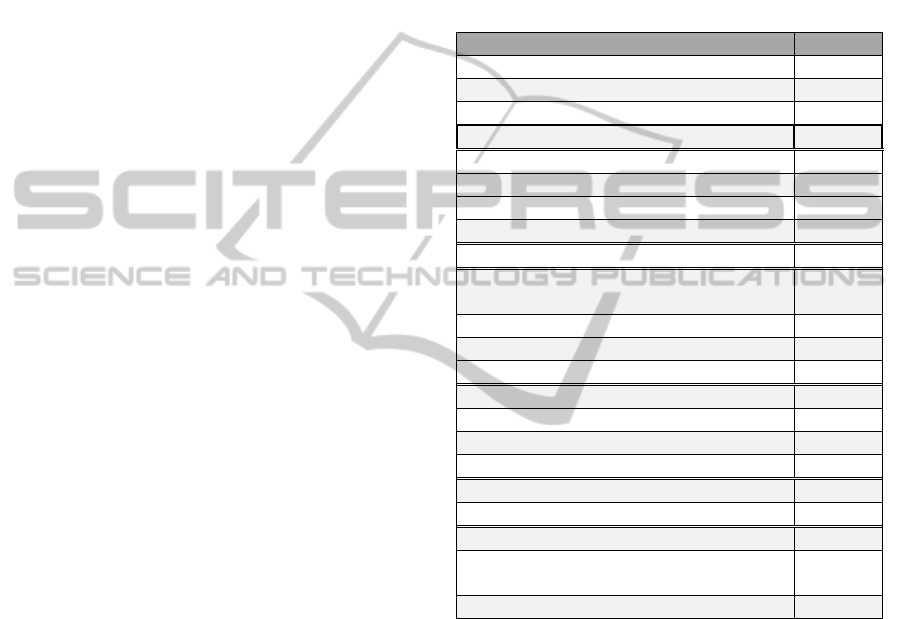
This section is intended to provide a more detailed
view of the attribute list that we defined for
describing building energy-related properties. As
Tab. 1 shows, attributes include both input and
output data to the ecomap generation procedure.
The first sets of attributes store the mandatory
input data (country, climate zone, building main use
and construction period) and the optional input data
(refurbishment level, storey height, number of
floors, number of sub-units). As discussed in the
previous section, the latter are either provided by the
user or estimated during the workflow execution.
From these attributes and by the use of TABULA
building typology database, the appropriate value for
the building size type is identified.
The following sets of attributes in the table
describe the thermal-related properties of the
building: the envelope heating balance (mean
envelope heat transmission coefficient, heating
comfort temperature, heating season start and end)
and the systems performance (heating system type,
main heating controls, hot water preparation system
type, ventilation system type). The values assigned
to those attributes are taken from the TABULA
building stereotype corresponding to the building
typology class the building belongs to. Those
attributes are the base for the computation of the
energy performance parameters for the building,
according to TABULA common energy balance
computation procedure.
The final sets of attributes store the computed
energy performance parameters: energy need (for
space heating and hot water preparation) and
delivered energy (for space heating, hot water
preparation and for auxiliary systems). Different
choices can be made about which of those attributes
or combination thereof to use as a cumulative index
for the energy performance of the building. Energy
need refers to the net energy needed to maintain
thermal comfort, while delivered energy is the actual
energy delivered by the energy distributor that takes
also into account the efficiency of heating/hot water
systems in producing the energy needed to maintain
thermal comfort. So, the choice of referring to
delivered energy is the most reasonable if
comparison between estimated and measured
consumption are foreseen, as it is the case in the
SUNSHINE project. Indeed the possibility to
compare the estimated values with the measured
ones in a number of pilot buildings is an important
target of the project in order to assess the validity of
the estimation process.
Table 1: Building energy performance attributes.
Attribute Name Type
Country string
Climate zone string
Building main use string
Construction period string
Refurbishment level string
Storey height real
Number of floors integer
Number of sub-units integer
Building size type string
Mean envelope
heat transmission coefficient
real
Heating comfort temperature real
Heating season start date
Heating season end date
Heating system type string
Main heating controls string
Hot water preparation system type string
Ventilation system type string
Energy need for space heating real
Energy need for hot water preparation real
Delivered energy for space heating real
Delivered energy
for hot water preparation
real
Delivered auxiliary energy real
Our choice of attributes is in line with the results
of other research activities, such as (Dalla Costa et
al., 2011). However, while that research focuses on
providing an attribute schema that can accommodate
for building energy performance analysis on
different level of aggregation (sub-unit, building,
block, etc), our choice of attributes has been done
having in mind a building centred approach as this is
the aim of the SUNSHINE project.
3.4 Ecomap Visualization via WebGL
As described in the previous section about system
architecture, via the WebGL-enabled visualization
the project stakeholders can easily discover,
compare and perform statistics on the estimated
Large-ScaleAssessmentandVisualizationoftheEnergyPerformanceofBuildingswithEcomaps-ProjectSUNSHINE:
SmartUrbanServicesforHigherEnergyEfficiency
175
ecomap data by accessing to a classical HTML web
page.
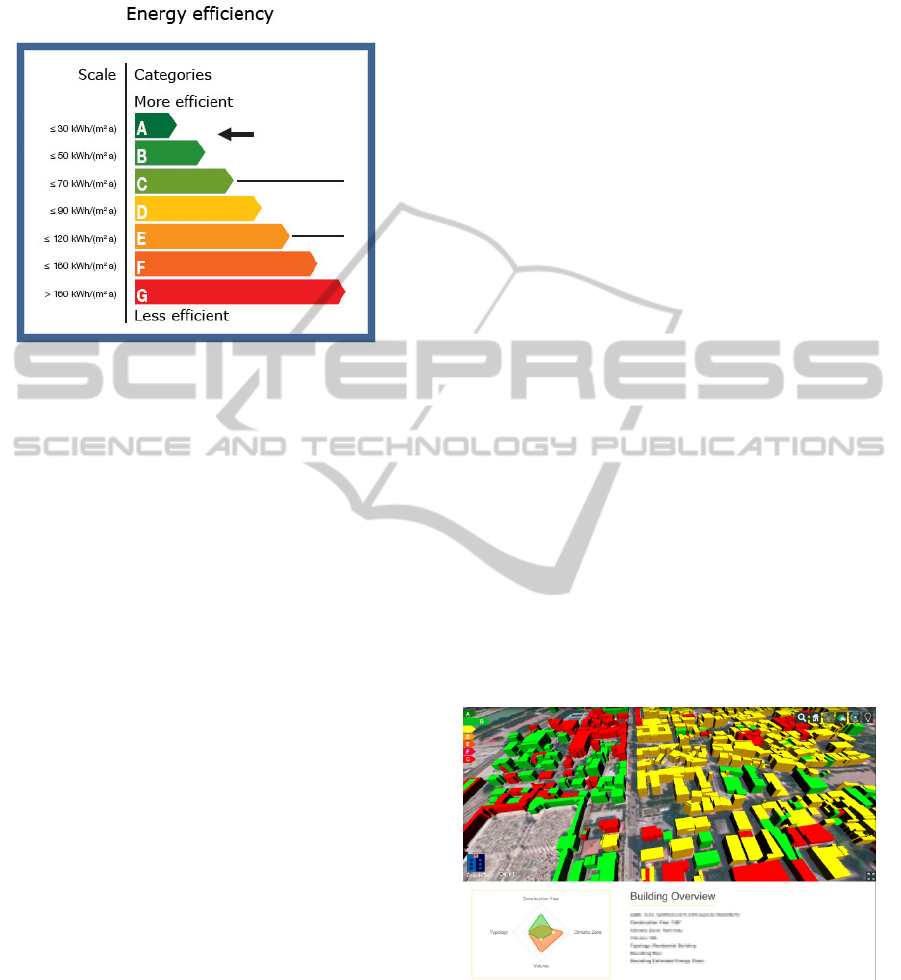
Figure 5: Building colour-coding scale.
Ecomaps are generated merging geometry LOD-
1 information from the CityGML of the displayed
city with the output of the energy performance
estimation procedure. More specifically, the colour
of each extruded KML polygon will be dependent
on the estimated building energy class. The
reference between each building in the KML file and
the corresponding building in the 3D CityDB is
ensured by storing the unique GML UUID of the
building in the KML polygon name property. By the
use of a web service it will then be possible to
retrieve the energy-related parameters corresponding
to the selected object.
The following code shows an example of how
each building is specified in the KML file.
<Style id="F">
<PolyStyle>
<color>FF0000FF</color>
<fill>1</fill>
<outline>0</outline>
</PolyStyle>
</Style>
<Placemark>
<description>Building extruded
test 1</description>
<name>UUID_a2017297-d0cf-45ee-
ae6d-94a5d4fcda03</name>
<styleUrl>#F</styleUrl>
<Polygon>
<altitudeMode>absolute</altitudeMode>
<extrude>1</extrude>
<outerBoundaryIs>
<LinearRing>
<
coordinates>
11.1263299929,46.0683712643,213.486
11.1263070656,46.0684180254,214.313
11.1262141309,46.0684011600,208.837
11.1262401711,46.0683529640,213.74
11.1263299929,46.0683712643,213.486
</coordinates>
</LinearRing>
</outerBoundaryIs>
</Polygon>
</Placemark>
Referring to the code listed above, the first part is
used to make a visual representation of the energy
class determined by the estimation procedure. Fig. 5
shows the colour coding of each building geometry
based on its estimated energy class. The second part
of the KML code is used to describe the extruded
geometry of each building contained in the source
file.
As Fig. 6 shows, the ecomap visualizer is
composed by two interconnected parts:
1. An HTML5 canvas that displays the WebGL
virtual globe in which KML ecomaps, based on
CityGML LOD-1 geometries, are loaded;
2. A classical HTML tab, displaying the detailed
energy data corresponding to the selected
building. Comparisons between building energy
efficiency characteristics can easily be performed
using the “radar” diagram placed in the bottom-
left part of the page. The diagram allows the
comparison of the most important building
proprieties between the current and the
previously selected building.
Figure 6: Ecomap visualization.
4 CONCLUSION AND FUTURE
DEVELOPMENTS
In this paper we have presented some of the
preliminary results of the SUNSHINE project. The
DATA2014-3rdInternationalConferenceonDataManagementTechnologiesandApplications
176

use of the TABULA building typology database
allows for a large-scale application of the building
energy performance assessment and the underlying
service-oriented system architecture supports a
distributed access to the related services. Moreover,
the use of the emerging WebGL technology ensures
the largest available audience in terms of devices,
both desktop and mobile, avoiding the development
of device-dependent custom clients for 3D city map
visualization.
Future developments on the building typology
side will be linked to the efforts of the EPISCOPE
project extending the results of TABULA project to
additional European countries and to building with
predominant use other than residential. In particular
a deeper investigation on the influence of the shape
factor of the building (Waste surface/Volume)
should be performed in order to improve the
classification especially in specific urban context.
On the side of data structure and visualization,
improvements will be focused on increasing the
quality of the geometry displayed, making it
possible to render buildings based on CityGML
LoD-2 level of detail and on the development of
more detailed building size type estimation
procedures.
ACKNOWLEDGEMENT
The project SUNSHINE have received funding from
the EC, and it has been co-funded by the CIP-Pilot
actions as part of the Competitiveness and
innovation Framework Programme. The author is
solely responsible of this work, which does not
represent the opinion of the EC. The EC is not
responsible for any use that might be made of
information contained in this paper.
REFERENCES
Apache Community, 2014. Apache Tomcat.
http://tomcat.apache.org/
Ballarini, I., et al., 2011. Definition of building typologies
for energy investigations on residential sector by
TABULA IEE-project: application to Italian case
studies. Proceedings of the 12th. International
Conference on Air Distribution in Rooms, Trondheim,
Norway, p. 19-22.
Bowerman, B., et al., 2000. The vision of a smart city. 2nd
International Life Extension Technology Workshop,
Paris.
Carrión, D., et al., 2010. Estimation of the energetic
rehabilitation state of buildings for the city of Berlin
using a 3D city model represented in CityGML. ISPRS
international conference on 3D Geoinformation, p. 4.
Dalla Costa, S., et al., 2011. A CityGML 3D geodatabase
for buildings’ energy efficiency. International Archives
of the Photogrammetry, Remote Sensing and Spatial
Information Sciences 38.4: C21.
Fenger, J., 1999. Urban air quality. Atmospheric
environment, 33.29: 4877-4900.
Giffinger, R., 2007. Smart cities: Ranking of European
medium-sized cities. Final report, Centre of Regional
Science, Vienna UT.
Giffinger, R., Gudrun, H., 2010. Smart cities ranking: an
effective instrument for the positioning of the cities?
ACE: Architecture, City and Environment, vol. 4,
num. 12, p. 7-26.
Gröger, G., et al., 2008. OpenGIS city geography markup
language (CityGML) encoding standard. Open
Geospatial Consortium Inc.
Hay, G., et al., 2010. HEAT - Home energy assessment
technologies: a web 2.0 residential waste heat
analysis using geobia and airborne thermal imagery.
The International Archives of the Photogrammetry,
Remote Sensing and Spatial Information Sciences,
Vol. XXXVIII-4/C7.
Kaden, R., Kolbe T., 2013. City-wide total energy demand
estimation of buildings using semantic 3D city models
and statistical data. ISPRS Annals of the
Photogrammetry, Remote Sensing and Spatial
Information Sciences, Volume II-2/W1.
Krüger, A., Kolbe, T., 2012. Building Analysis for urban
energy planning using key indicators on virtual 3D
city models - The energy atlas of Berlin. International
Archives of the Photogrammetry, Remote Sensing and
Spatial Information Sciences, Volume XXXIX-B2.
Loga, T., 2010. Use of Building Typologies for Energy
Performance Assessment of National Building Stocks:
Existent Experiences in European Countries and
Common Approach. IWU, 2010.
Marrin, C., 2011. WebGL specification. Khronos WebGL
Working Group.
Nouvel, R., et al., 2013. CityGML-based 3D city model for
energy diagnostics and urban energy policy support.
Proceedings of BS2013, 13th Conference of
International Building Performance Simulation
Association, Chambéry, France.
Stadler, A., et al., 2009. Making interoperability
persistent: A 3D geo database based on CityGML.
3D
Geo-Information Sciences, Springer, p. 175-192.
Washburn, D., Sindhu, U., 2009. Helping CIOs
Understand “Smart City” Initiatives. Report by
Forrester Research, Inc.
Wilson, T., 2008. OGC® KML. OGC Encoding Standard,
Version 2.0.
Large-ScaleAssessmentandVisualizationoftheEnergyPerformanceofBuildingswithEcomaps-ProjectSUNSHINE:
SmartUrbanServicesforHigherEnergyEfficiency
177
