
Routing Strategy of a Prioritized Limited Multi-Server
Processor-Sharing System
Yoshiaki Shikata and Nobutane Hanayama
Shobi University 1-1-1 Toyoda-cho, Kawagoe-shi, Saitama, Japan
Keywords: Processor-Sharing, Multi-Server, Routing Strategy, Performance Evaluation, Loss Probability, Sojourn
Time, Traffic Simulation.
Abstract: In this work, routing strategies of an arriving request to a server in a prioritized limited multi-server
processor-sharing (PS) system are studied in order to optimize a given performance criterion. In this system,
an arriving request enters the dispatcher, which routes this request to each server according to a
predetermined strategy. In the prioritized limited PS server, a high-priority request is allocated a service
ratio that is m (called the priority ratio) times greater than that of a low-priority request. Moreover, the sum
of the number of the requests receiving service is restricted to a fixed value. The arriving request which
cannot receive service will be queued (waiting system) or rejected (loss system). In this server, at the arrival
(or departure) of a request, the extension (or shortening) of the remaining sojourn time of each request that
is receiving service can be calculated using the number of requests and priority ratio. Employing a
simulation program to execute these events and calculations enables us to analyze the performance of this
system, such as the loss probability, mean sojourn time, and mean waiting time. Based on the evaluation
results, the most suitable routing strategy for the loss or waiting system is clarified.
1 INTRODUCTION
The processor-sharing (PS) discipline has gained an
important role in evaluating the performance of a
variety of resource allocation mechanisms. Under PS
discipline, if there are n (> 0) requests in a single-
server system, then each request receives 1 / n of the
service facility capacity. No arriving request has to
wait for the service because it will be served
promptly, even if the service rate becomes slow. The
PS paradigm emerged as an idealization of Round-
Robin (RR) scheduling algorithms in time-shared
computer system.
A PS discipline with a priority structure has been
proposed as well, wherein a larger service ratio is
allocated to requests that have high-priority. In such
a prioritized PS paradigm, with an increase in the
number of arriving requests, the service ratio for an
individual request decreases; accordingly, the
sojourn time of each request increases. In order to
prevent an increase in the sojourn time of each
request in such a prioritized single-server PS
paradigm and to realize a realistic model of sharing,
a method for limiting the number of requests
receiving service has been proposed. In such a
prioritized limited single-server PS system, a high-
priority (class-1) request is allocated a service ratio
that is m (1, called the priority ratio) times greater
than that of a low-priority (class-2) request.
Moreover, the sum of the number of the requests
receiving service is restricted to a fixed value. The
arriving requests that cannot receive service will be
attached to the service-waiting queue (waiting
system) or is rejected (loss system).
On the other hand, communication services such
as web server-farms, database systems and grid
computing clusters, routinely employ multi-server
systems to provide a range of services to their
customers. An important issue in such systems is to
determine which server an arriving request should be
routed to, in order to optimize a given performance
criterion. Therefore, we investigate the routing
strategies in a multi-server system where each server
employs the prioritized limited PS rule. The
following two routing strategies are proposed:
(a) RST (Remaining Sojourn Time)-based strategy
– Routing to the server that has the smallest
value of the sum of the remaining sojourn time
of each request.
(b) NNR (Normalized Number of Requests)-based
5
Shikata Y. and Hanayama N..
Routing Strategy of a Prioritized Limited Multi-Server Processor-Sharing System.
DOI: 10.5220/0004998900050012
In Proceedings of the 5th International Conference on Data Communication Networking (DCNET-2014), pages 5-12
ISBN: 978-989-758-042-0
Copyright
c
2014 SCITEPRESS (Science and Technology Publications, Lda.)

strategy – Routing to the server with the
smallest value of (m * n1
i
+ n2
i
), which is the
normalized number of requests. Here, n1
i
and
n2
i
represent the number of class-1 and class-2
requests in the server i (including the arriving
one).
The performance measures of practical interest
of these strategies, such as the loss probability, mean
waiting time in the service waiting queue, and mean
sojourn time are evaluated via simulation, and
compared with the values in case of the following
conventional strategies:
(c) IT strategy – Routing to each server in turn
according to a fixed order.
(d) RAND strategy – Routing to each server
randomly, with the same probability.
Based on the evaluation results, we discerned the
most suitable routing strategies for the loss system
and waiting system.
Under the PS rule, when a request either arrives
at or departs from the system, the remaining sojourn
time of other requests will be extended or reduced,
respectively. This extension or reduction of the
sojourn time is calculated using the number of
requests of each class and the priority ratio.
Employing a simulation program to execute these
events and calculations enables us to analyze the
performance of the prioritized limited multi-server
PS rule, which is realistic in a time-sharing system
(TSS) with a sufficiently small time slot.
In the simulation program, the arrival timer or
service timer of each request controls the simulation
clock. In each while loop of the simulation program,
one of these timers expire, and the abovementioned
arrival processing or service end processing is
executed. Simultaneously, the time duration until the
expiry of the next timer is pushed forward in order
to skip the insignificant simulation clock, thereby
shortening the total simulation time.
The PS rule, an idealization of quantum-based
RR scheduling at the limit where quantum size
becomes infinitesimal, has been the subject of many
papers (Kleinrock, 1967) (Fayolle and Mitrani,
1980) (Altman, Avrachenkov and Ayesta, 2006)
(Haviv and Val, 2008). A limited PS system and a
prioritized limited PS system, in which the number
of requests receiving service is restricted to a fixed
value, have been proposed as well. Further, the
performance of these systems has been analyzed
(Yamazaki and Sakasegawa, 1987) (Shikata,
Katagiri and Takahashi, 2011). Moreover, load-
balancing strategies for multi-class multi-server PS
systems with a Poisson input stream, and
heterogeneous service rates have been investigated
(Chen, Marden and Wierman, 2009) (Gupta, Balter,
Sigman, and Whitt, 2007) (Altman, Ayesta, and
Prabhu 2011). However, routing strategies in a
prioritized limited multi-server PS system have not
been investigated. Thus, the most suitable routing
strategy in the loss system or waiting system
remains to be discerned. Moreover, the influence
that the service facility capacity may have on the
mean sojourn time, the mean waiting time in the
service waiting queue, and the loss probability in the
prioritized limited multi-server PS system have not
been investigated.
2 PRIORITIZED LIMITED
MULTI-SERVER PS SYSTEM
In the prioritized limited multi-server PS system, an
arriving request enters the dispatcher, which routes
this request to each prioritized limited PS server
according to a predetermined strategy. Suppose that
there are two classes, and an arriving (class-1 or
class-2) request, which is routed to server i,
encounters n1
i
class-1 and n2
i
class-2 requests.
According to the prioritized limited multi-server PS
rule, if (m * n1
i
+ n2
i
≤ C
i
), class-1 requests
individually and simultaneously receive m / (m * n1
i
+ n2
i
) of the service facility capacity of server i,
whereas class-2 requests receive 1 / (m * n1
i
+ n2
i
)
of it. When a server meeting this condition (m * n1
i
+ n2
i
≤ C
i
) does not exist, the arriving request will
be queued in the corresponding class waiting room
prepared in the dispatcher or rejected. Here, m (1)
denotes the priority ratio, and C
i
(∞), the service
facility capacity of server i.
2.1 Routing Strategies
The evaluation model is shown in Figure 1. When a
request arrives at the dispatcher, first, it is checked
whether there exists a server that satisfies the
condition (m * n1
i
+ n2
i
) ≤ C
i
. Otherwise, the
arriving request is rejected or is placed in the service
waiting queue for each request prepared in the
dispatcher. If there are one or more servers in which
the value of (m * n1
i
+ n2
i
) is less than the C
i
, the
arriving request is routed to one of these servers
according to the predetermined routing strategy. In
the waiting system, when the service for a request
ends in one of the servers, another request is taken
from the service waiting queue and is routed to this
server. The following four routing strategies are
considered, and their performances are compared.
DCNET2014-InternationalConferenceonDataCommunicationNetworking
6

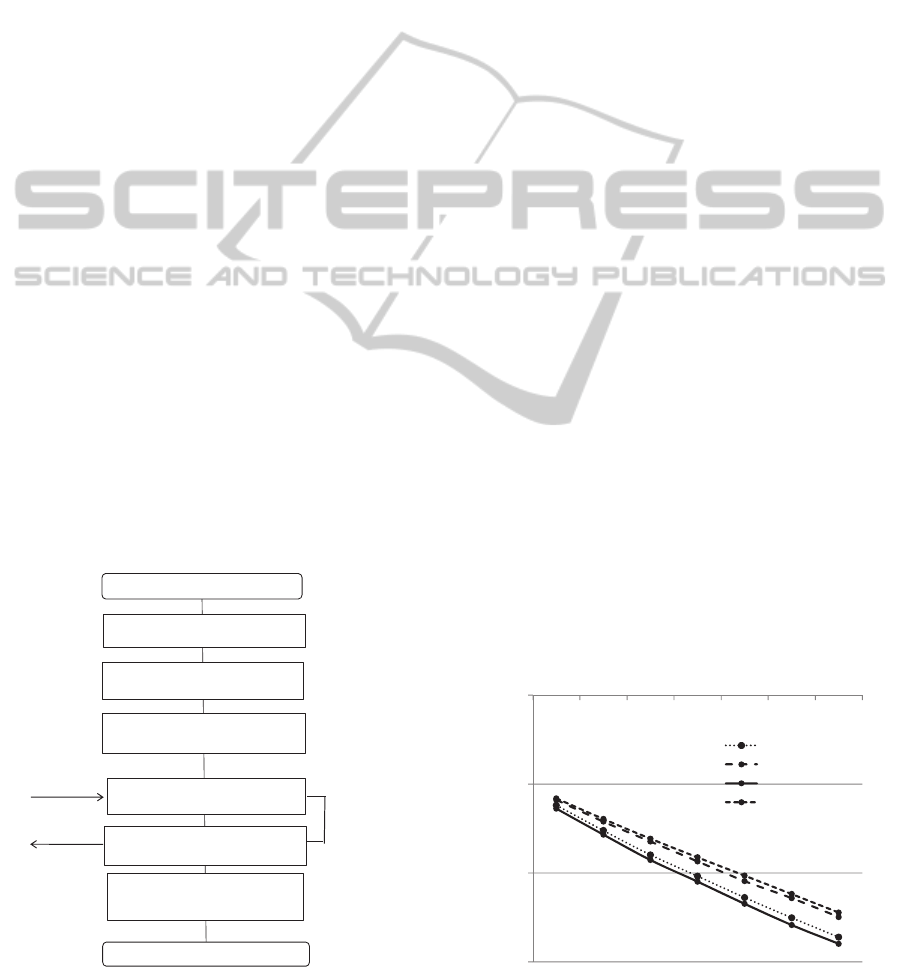
Figure 1: Evaluation Model.
2.1.1 RST-based Strategy
In this strategy, at the arrival of a request, the sum of
the remaining sojourn time of each request in each
server is evaluated. An arriving request is routed to
the server that has the smallest sum.
2.1.2 NNR-based Strategy
In this strategy, at the arrival of a request, the value
of (m * n1
i
+ n2
i
) in each server is evaluated. An
arriving request is routed to the server that has the
smallest value of (m * n1
i
+ n2
i
).
2.1.3 IT Strategy
In this strategy, the server to which an arriving
request is routed is selected in turn according to a
fixed order. If (m * n1
i
+ n2
i
) > C
i
in the selected
server i, the next server is selected according to the
same rule.
2.1.4 RAND Strategy
In this strategy, the server to which an arriving
request is routed is selected at random with the same
probability. If (m * n1
i
+ n2
i
) > C
i
in the selected
server i, the next server is selected according to the
same rule.
2.2 Remaining Sojourn Time
When a request arrives at (or departs from) the
system, the remaining sojourn time of each of the
requests that are currently receiving service is
extended (or shortened). This extension (or
reduction) of the remaining sojourn time of each
request that is receiving service can be calculated
using the number of each class requests and the
priority ratio. By tracing these numerical changes in
the remaining sojourn time in the simulation
program, the loss probability, mean waiting time in
the queue, and mean sojourn time of an individual
class request in the server are evaluated.
If a class-1 request is routed to a server i, m / {m *
(n1
i
+ n2
i
)} of the service facility capacity will be
allocated to this request thenceforth until the arrival
(or departure) of the next request in this server. The
sojourn time of an arriving request So is then given
by
So = Sr * (m * n1
i
+ n2
i
) / m (1)
where Sr is the requested service time of an arriving
request. Moreover, m / {m * (n1
i
– 1) + n2
i
} (to a
class-1 request) or 1 / {m * (n1
i
– 1) + n2
i
} (to a
class-2 request) of the service facility capacity is
given to each request that is receiving service in this
server currently. Thenceforth, until the arrival (or
departure) of the next request, m / {m * (n1
i
+ n2
i
)}
(to a class-1 request) or 1 / {m * (n1
i
+ n2
i
)} (to a
class-2 request) of the service facility capacity will
be allocated to each request that is being serviced in
this server. Therefore, the remaining sojourn time of
each request following the arrival of this request, Sa,
is then extended as follows:
Sa = Sb * {m * (n1
i
+ n2
i
)} / {m * (n1
i
– 1) + n2
i
)
(2)
where Sb is the remaining sojourn time of each
request immediately before this request arrives.
Similarly, at the arrival of a class-2 request, the
sojourn time of an arriving request So is given by:
So = Sr * (m * n1
i
+ n2
i
) (3)
The remaining sojourn time of each request
following the arrival of this request, Sa is extended
as follows:
Sa = Sb * (m * n1
i
+ n2
i
) / (m * n1
i
+ n2
i
– 1)
(4)
In addition, when the sojourn time of a class-1
request terminates, the remaining sojourn time of
each request following the departure of this request
from this server Sa reduces to the following:
Sa = Sb * {m * (n1
i
– 1) + n2
i
} / (m * n1
i
+ n2
i
)
(5)
here Sb is the remaining sojourn time of each
request immediately before this request departs from
this server. At the conclusion of service of a class-2
request, Sa is reduced as follows:
Sa = Sb * (m * n1
i
+ n2
i
– 1) / (m * n1
i
+ n2
i
)(6)
Queue
Prioritized
limitedPS
Prioritized
limitedPS
Server
Dispatcher
Class1
requests
Class2
requests
RoutingStrategyofaPrioritizedLimitedMulti-ServerProcessor-SharingSystem
7
Tracking these events and calculations enables us
to evaluate practical performance measures, such as
the loss probability, mean waiting time in the service
waiting queue, and mean sojourn time of requests.
3 SIMULATION FLOW
Simulation flow of the prioritized limited multi-
server PS system is shown in Figure 2. The
simulation program is developed in C programming
language. In this program, the simulation clock is
controlled by the arrival timer or service timer of
each request that is receiving service. At the arrival
of each class request, the time duration until the next
arrival of the request is set into the arrival timer
according to the predetermined arrival time
distribution. Further, the service time (e.g.,
remaining sojourn time) of each arriving request
calculated using the equation (1) or (3) is set into the
service timer. Moreover, the arrival time of each
request is memorized in the corresponding variable.
The sojourn time of each request in the server is
evaluated using this data and service end time. In
addition, the waiting time in the service-waiting
queue is evaluated using this data and service start
time. In the while loop of this simulation program,
the extension or shortening of the remaining sojourn
time of each request mentioned in the Section 2.2 is
executed on the expiry of one of the arrival timers or
service timers. Moreover, the service timer or arrival
timer with the next smallest value is detected, and
the time duration of this timer is subtracted from all
the remaining timers.
Figure 2: Simulation flow.
Therefore, in the next while loop this timer expires.
Simultaneously, the simulation clock is pushed
forward by this time duration in order to skip the
insignificant simulation clock. The while loop is
repeated until the number of arriving requests attains
a predetermined value.
4 EVALUATION RESULTS
In the evaluation, the priority ratio m is assumed to
be two, and the two-stage Erlang inter-arrival
distribution and the two-stage hyper-exponential
service time distribution are considered. Two servers
are prepared, and these servers have the same
performance and service facility capacity.
Evaluation results are obtained as the average of ten
simulation results. About 80,000 requests were
produced for each class in each run.
4.1 Limited Multi-Server PS System
4.1.1 Loss System
In this system, only the class-2 requests are served.
Figure 3 compares the loss probabilities in the loss
system in case of the RST-based, NNR-based, IT,
and RAND strategies. Here, S or A represents the
mean requested service time or arrival rate
respectively. The range of markers includes 95% of
the reliability intervals obtained from the ten
simulation runs. The logarithm of the loss
probability increases linearly as the service facility
capacity decreases. The loss probability value in
case of the RST-based strategy is slightly lesser than
its value in case of the NNR-based strategy, and is
lesser than its value in case of the IT or RAND
strategy.
Figure 3: Loss probability versus service facility capacity
/A=0.8, S=2).
An other request
leaves the system.
An other request
arrives.
Repeat
A request arrives.
The remaining sojourn time is
extended.
The remaining sojourn time is
reduced.
The service time is over.
The sojourn time is calculated
The request leaves the system.
The request is dispatched to the
selected server.
The most suitable server is selected.
The sojourn time is caluculated,
and the service starts.
0.001
0.01
0.1
1
3456789
Lossprobability
Servicefacilitycapacity
NNR
IT
RST
RAND
DCNET2014-InternationalConferenceonDataCommunicationNetworking
8
The loss probability in case of the RAND and IT
strategies shows almost the same value.
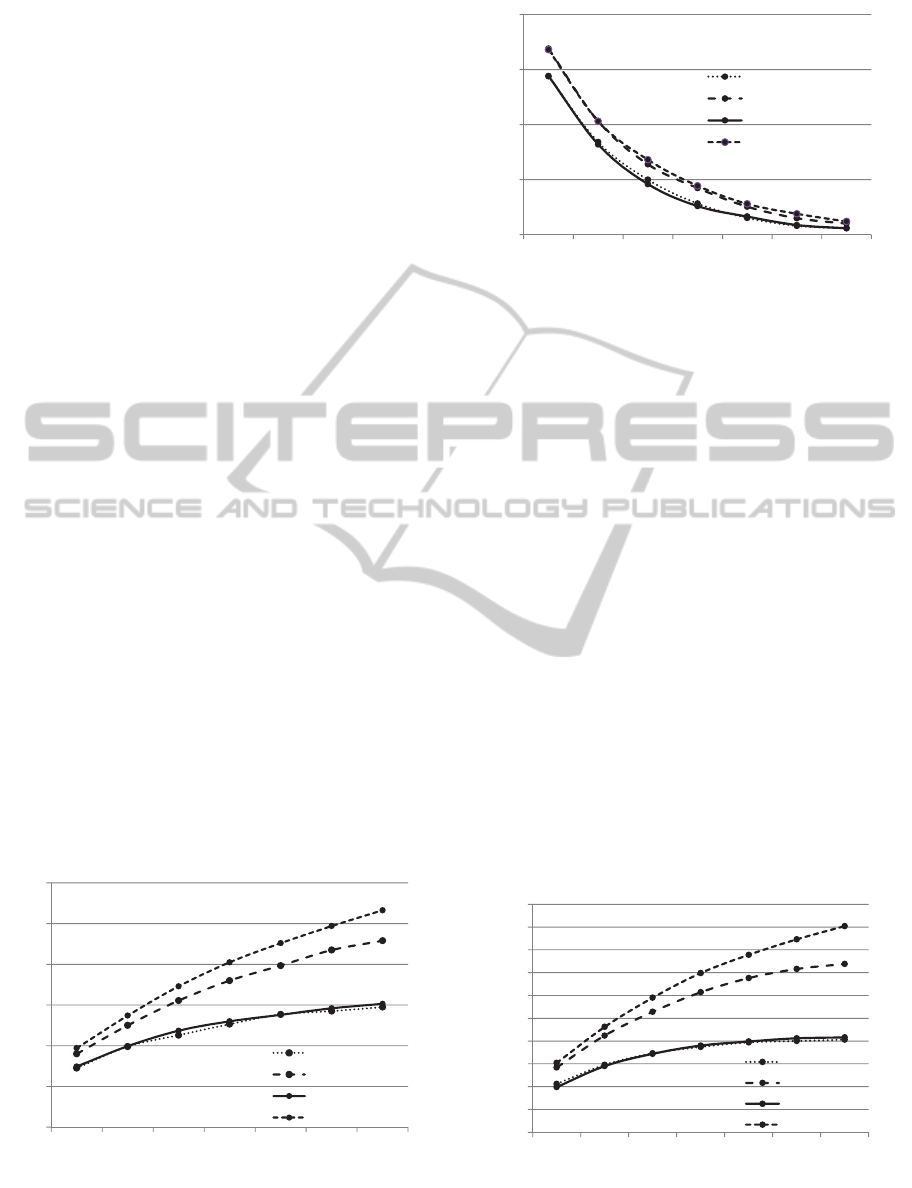
Figure 4 compares the mean sojourn time of the
RST-based, NNR-based, IT, and RAND strategies.
The mean sojourn time increases as the service
facility capacity increases. The mean sojourn times
of the RST-based and NNR-based strategies are
almost the same, and are significantly lesser than
their corresponding values obtained by the IT or
RAND strategies. The mean sojourn time in case of
the RAND strategy approaches the value obtained
by the IT strategy as the service facility capacity
decreases. Based on the above-mentioned results, it
may be inferred that the RST–based strategy, which
realizes small loss probability and mean sojourn
time, is the most suitable routing strategy for the loss
system of the limited multi-server PS system.
4.1.2 Waiting System
Figure 5 and 6 compares the mean waiting time in
the service waiting queue, and mean sojourn time
(not includes the waiting time in the service waiting
queue) in the waiting system, respectively, for the
RST-based, NNR-based, IT, and RAND strategies.
The mean sojourn time in case of the IT strategy is
lesser than its corresponding value in the RAND
strategy, and approaches the value obtained by the
RAND strategy as the service facility capacity
decreases. The mean waiting time increases as the
service facility capacity decreases.
On the other hand, the mean sojourn time
decreases as the service facility capacity decreases.
Both the mean waiting time and mean sojourn time
of the RST-based and NNR-based strategies is lesser
than the corresponding values in the IT or RAND
strategy.
Figure 4: Mean sojourn time versus service facility
capacity (A=0.8, S=2).
Figure 5: Mean waiting time versus service facility
capacity (A=0.8, S=2).
There are few differences in mean waiting time
and mean sojourn time between the RST-based and
NNR-based strategies. It is evident from the details
mentioned above that the NNR-based or RST-based
strategies demonstrate the best performances in the
waiting system. On the other hand, the calculation
algorithm of the normalized number of requests in
the NNR-based strategy is easier than that of the
sum of the remaining sojourn time in the RST-based
strategy. Therefore, it may be inferred that the NNR-
based strategy is the most suitable routing strategy
for the waiting system of the limited multi-server PS
system.
4.2 Prioritized Limited Multi-Server
PS System
In the evaluation of the performance of the
prioritized limited multi-server PS system, the
arrival rate and mean requested service time of each
class request are assumed to have the same value.
Figure 6: Mean sojourn time versus service facility
capacity (A=0.8, S=2).
2
3
4
5
6
7
8
3456789
Meansojourntime
Servicefacilitycapacity
NNR
IT
RST
RAND
0
0.5
1
1.5
2
3456789
Meanwaitingtime
Servicefacilitycapacity
NNR
IT
RST
RAND
3
3.5
4
4.5
5
5.5
6
6.5
7
7.5
8
3456789
Meansojourntime
Servicefacilitycapacity
NNR
IT
RST
RAND
RoutingStrategyofaPrioritizedLimitedMulti-ServerProcessor-SharingSystem
9

4.2.1 Loss System
Figure 7 compares the loss probability of the class-1
request (shown as round markers) and class-2
request (shown as cross markers) in case of the RST-
based, NNR-based, IT, and RAND strategies. The
logarithm of the loss probability increases linearly as
the service facility capacity decreases. The loss
probability of the class-1 request of the RST-based
and NNR-based strategies is almost the same, and is
smaller than the value in case of the IT or RAND
strategy. The loss probability of the class-2 request
of the NNR-based strategy is smaller than its value
in other strategies.
Figure 8 compares the mean sojourn time of the
class-1 request (shown as round markers) and class-
2 request (shown as cross markers) in case of the
RST-based, NNR-based, IT, and RAND strategies.
The mean sojourn time increases as the service
facility capacity increases. The mean sojourn times
of the class-1 request of the RST-based and NNR-
based strategies are also the same, and are smaller
Figure 7: Loss probability versus service facility capacity
(A=0.8, S=2).
Figure 8: Mean sojourn time versus service facility
capacity (A=0.8, S=1).
the corresponding values obtained by the IT or
RAND strategy.
On the other hand, the mean sojourn time of the
class-2 request in case of the RST-based strategy is
slightly lesser than its value in case of the NNR-
based strategy, and is lesser than its value in case of
the IT or RAND strategy. Based on the above-
mentioned results, it may be inferred that the NNR-
based is the most suitable routing strategy in the loss
system of the prioritized limited multi-server PS
system in cases where the loss probability is a higher
priority than the sojourn time. On the other hand, in
cases where the sojourn time is a higher priority than
the loss probability, the RST-based strategy is the
most suitable routing strategy.
4.2.2 Waiting System
Figure 9 shows the relationship between the mean
sojourn time and service facility capacity of the
class-1 requests and class-2 requests in case of the
RST-based, NNR-based, IT, and RAND strategies.
Figure 9: Mean sojourn time versus service-facility
capacity (A=0.8, S=1).
Figure 10: Mean waiting time versus service-facility
capacity (A=0.8, S=1).
0.001
0.01
0.1
1
456789101112
Lossprobability
Service‐facilitycapacity
NNR
IT
RST
RAND
1
1.5
2
2.5
3
3.5
4
4.5
456789101112
Meansojourntime
Service‐facilitycapacity
NNR
IT
RST
RAND
1
1.5
2
2.5
3
3.5
4
4.5
5
4 5 6 7 8 9 10 11 12
Meansojourntime
Service‐facilitycapacity
RST
NNR
IT
RAND
0
0.2
0.4
0.6
0.8
1
1.2
456789101112
Meanwaitingtime
Service‐facilitycapacity
RST
NNR
IT
RAND
DCNET2014-InternationalConferenceonDataCommunicationNetworking
10
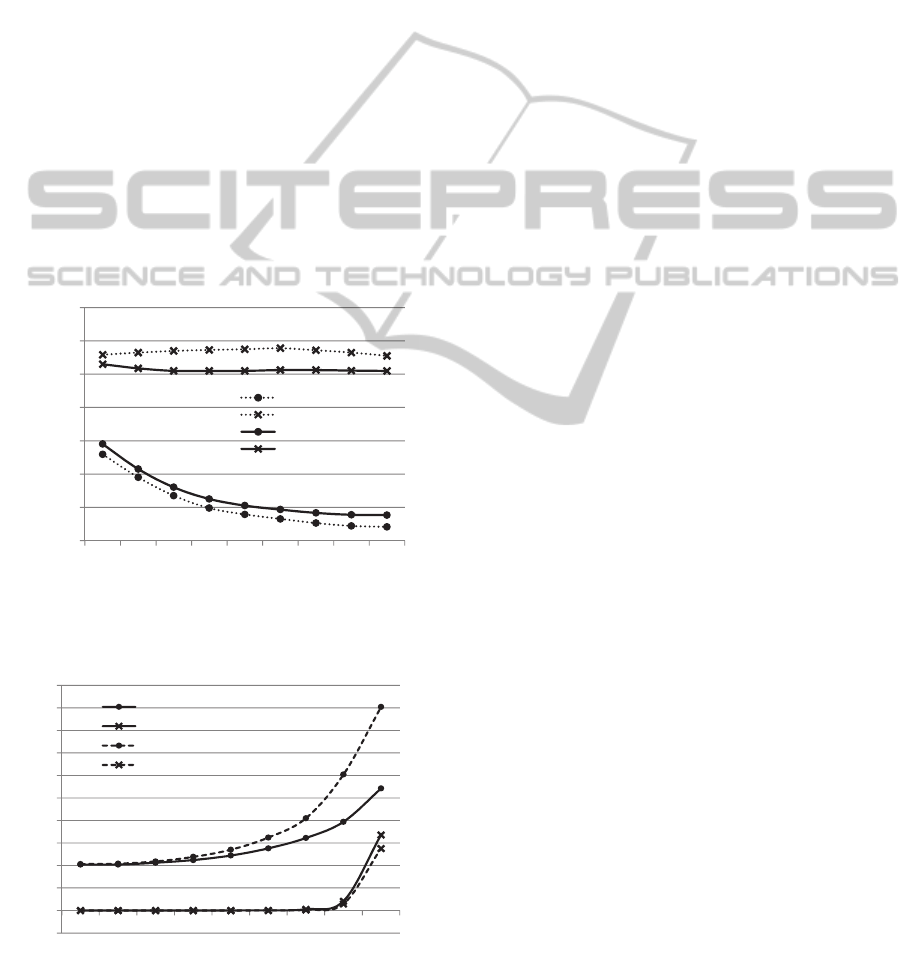
The mean sojourn time of the class-2 requests of
the RST-based strategy is slightly lesser than the
corresponding values obtained by the NNR-based
strategy, and significantly lesser than that value
obtained by the IT and RAND strategies. The mean
sojourn time of the class-1 requests in case of the
NNR-based strategy is the same as that value in case
of the RST-based strategy, and is significantly lesser
than that obtained by the IT and RAND strategies.
Figure 10 shows the relationship between the mean
waiting time in the service waiting queue and
service facility capacity of the class-1 requests and
class-2 requests in case of the RST-based, NNR-
based, IT, and RAND strategies. The mean waiting
time of the class-1 requests and class-2 requests in
case of the NNR-based strategy is almost the same
as that obtained by the RST-based strategy, and is
significantly lesser than that value of the IT and
RAND strategies.
Based on the above-mentioned results, it may be
inferred that the RST-based and NNR-based
strategies are the suitable routing strategies in the
Figure 11: The sum of the mean sojourn and mean waiting
time versus service-facility capacity (A=0.8, S=1).
Figure 12: Mean sojourn or waiting time versus arrival
rate (S=1, SFC=8).
waiting system of the prioritized limited multi-server
PS system.
Figure 11 compares the sum of the mean sojourn
time or waiting time in the service waiting queue of
the class-1 request (shown as the round marker) and
class-2 request (shown as the cross marker) in case
of the two (NNR-based and RST-based) strategies
which realize the higher performance than the other
two (IT and RAND) strategies. The sum of the mean
sojourn time or waiting time of the class-1 request in
the NNR-based strategy is smaller than that value in
the RST-based strategy. On the other hand, the sum
of the mean sojourn time and waiting time of the
class-2 request in the NNR-based strategy is larger
than that value in the RST-based strategy.
Figure 12 shows the relationship between the
mean sojourn time (shown as round markers) or
mean waiting time in the service waiting queue
(shown as cross markers), and the arrival rate in case
of the NNR-based strategy. Here, SFC means the
service facility capacity. As the arrival rate
increases, the differences between the mean sojourn
time and mean waiting time in case of the class-1
request and class-2 request increases.
5 CONCLUSION
Routing strategies of an arriving request in the
prioritized limited multi-server PS system are
proposed, and the practical performance measures,
such as the loss probability, mean sojourn time, and
mean waiting time in the service-waiting queue are
evaluated via simulation for each strategy. In the
simulation program, by tracking the extension (or
shortening) of the remaining sojourn time of each
request that is receiving service at the arrival (or
departure) of a request, the performance measures,
e.g., the loss probability, mean waiting time in the
service waiting queue, and mean sojourn time in
these strategies, can be evaluated.
Based on the evaluation results, in the loss
system of the limited multi-server PS system, it may
be inferred that the RST-based strategy realizes the
best performance. On the other hand, in the waiting
system, the NNR-based strategy realizes the best
performance along with the simple routing control
mechanism. In the prioritized limited multi-server
PS system, NNR-based or RST-based strategy may
be said to be the most suitable routing strategy in the
case of both loss and waiting systems. It also may be
inferred that the RST–based strategy is best for
reducing the sojourn time, and NNR-based strategy
is best to reduce the loss probability.
2
2.2
2.4
2.6
2.8
3
3.2
3.4
456789101112
Sumofthemeansojourntimeand
meanwaitingtime
Service‐facilitycapacity
NNR
NNR
RST
RST
‐0.5
0
0.5
1
1.5
2
2.5
3
3.5
4
4.5
5
0.1 0.2 0.3 0.4 0.5 0.6 0.7 0.8 0.9
Meansojournorwaitingtime
Arrivalrate
Class‐1
Class‐1
Class‐2
Class‐2
RoutingStrategyofaPrioritizedLimitedMulti-ServerProcessor-SharingSystem
11

In the future, we intend to study the influence of
the service time distribution on the routing strategy
of a prioritized limited multi-server PS System, and
routing strategies in a prioritized limited multi-
server RR system.
REFERENCES
L. Kleinrock, "Time-Shared Systems: A Theoretical
Treatment", J.A.C.M Vol.1, No.14, 242-261 (1967).
G.Fayolle and I.Mitrani, “Sharing a Processor Among
many Job Classes”, J.A.C.M Vol.27, No.3, July 1980.
Pp519-532
E.Altman, K.Avrachenkov and U.Ayesta, “A survey on
processor sharing”, Queueing Syst (2006) 53:53-63
M.Haviv and J.Val, “Mean sojourn times for phase-type
discriminatory processor sharing system”, European
Journal of Operational research, 189(2008), 375-386
G. Yamazaki and H. Sakasegawa, “An optimal design
problem for limited sharing systems”, Management
Science, vol.33(8), pp.1010--1019 (1987).
Y.Shikata, W.Katagiri, and Y.Takahashi, “Prioritized
Limited Processor-Sharing System with its Performance
Analysis”, International Conference on Operations
Research, August30 - 1, 2011 Zurich.
H.L. Chen, J. Marden, and A. Wierman, “The effect of
local scheduling in load balancing designs”, In
Proceedings of IEEE INFOCOM, 2009.
V. Gupta, M. Harchol-Balter, K. Sigman, and W. Whitt,
“Analysis of join-the-shortest-queue routing for web
server farms”, In Proceedings of Performance, page
180, 2007.
E. Altman1, U. Ayesta, and B.J. Prabhu, “Load Balancing
in Processor Sharing Systems”, Telecommunication
Systems, June 2011, Volume 47, Issue 1-2, pp 35-48.
M. Haviv and T. Roughgarden. “The price of anarchy in
an exponential multi-server”, Operations Research
Letters, 35:421–426, 2007.
H. Kameda, E. Altman, O. Pourtallier, J. Li, and Y.
Hosokawa. “Paradoxes in performance optimization of
distributed systems”, In Proceedings of SSGRR 2000
Computer and ebusiness conference, 2000.
D. Starobinski and T. Wu. “Performance of server s
election algorithms for content replication networks”, In
IFIP Networking, 2005.
DCNET2014-InternationalConferenceonDataCommunicationNetworking
12
