
The Front Velocity Approach in the Modelling of
Simulated Moving Bed Process (SMB)
Anderson L. J. Bihain
1
, Antônio J. da Silva Neto² and Leôncio D. T. Câmara
2
1
Department of Mathematics, UNIPAMPA Federal University of Pampa, Bagé, Rio Grande do Sul, Brazil
2
Department of Mechanical Engineering and Energy, IPRJ-UERJ Polytechnic Institute of the
State University of Rio de Janeiro, Nova Friburgo, Rio de Janeiro, Brazil
Keywords: Simulation Moving Bed, Inverse Problems, Modelling and Simulation, Chromatography.
Abstract: The Simulated Moving Bed (SMB) is a countercurrent and continuum process that presents a high
separation efficiency. It has been extensively applied in the separation of the petrochemical compounds, in
the enantiomeric separation of racemic drugs, and in other mixtures that are difficult to separate. Currently
the models used to predict the mass transport along chromatographic columns consist of systems of partial
differential equations that presents a high computational cost. To modeling SMB process the novel approach
Front Velocity is presented. This consists of ordinary differential equations and do not utilize adsorption
isotherms, and therefore it is not necessary to perform equilibrium experiments, which are common
procedures in classical modeling. The first stage of the research work was to characterize the
chromatographic column, where the Random constraint window (R2W) algorithm was employed associate
to a kinetic mass transfer equation of the new approach in the solution of the inverse problem. With the
parameters obtained in the characterization of the chromatographic column, the SMB process simulation
was performed, obtaining the separation profiles of the studied compounds. To validate the model
developed, the simulated results were compared with experimental data of enantiomeric separation of the
Ketamine, also confronted with the simulations obtained from classical models. The results show that the
Front Velocity model has a reasonable agreement with experimental data. Likewise showed similar results
to those separation profiles obtained by classical modeling using partial differential equations, requiring
computational cost about twenty times smaller.
1 INTRODUCTION
The adsorption and reaction process are adopted
extensively by the food industry, textile,
petrochemical, chemical and pharmacological
(Gomes et al., 2002).
Therefore, many studies have been carried out
with the aim of improve and create new separation
techniques, and discover new substances to be used
in the separation of a range of products (Zaijun et
al., 2011).
Currently there are a variety of technical
separation, among them, the Simulated Moving Bed
(SMB), created in the sixties by the Universal Oil
Products (Broughton, 1961). This process stands out
for being a powerful tool to separate compounds that
are very difficult to separate, as when the difference
of affinity between the molecules is very small.
Another positive point is that processes operates
continuously requiring less solvent than batch
chromatography (Gal et al., 2005). The potential of
this chromatography tool has been evidenced by
means of high number of studies and publications of
the academic community.
The development of SMB separation processes
requires a thorough study, since is necessary to
determine some operating conditions such as the
flow rate in each section, feed concentration and the
switch time of the position of the currents
(Gonçalves, 2008). The determination of the
operational conditions can become a very costly to
the operator of the equipment.
To resolve this issue many authors has been
formulated math models capable of predicting the
SMB process of separation with statistically
acceptable errors compared to experimental data.
According to (Antos and Seidel-Morgenstern, 2001),
two different approaches, the discrete (mixed cells)
5
Bihain A., Silva Neto A. and Câmara L..
The Front Velocity Approach in the Modelling of Simulated Moving Bed Process (SMB).
DOI: 10.5220/0005009400050011
In Proceedings of the 4th International Conference on Simulation and Modeling Methodologies, Technologies and Applications (SIMULTECH-2014),
pages 5-11
ISBN: 978-989-758-038-3
Copyright
c
2014 SCITEPRESS (Science and Technology Publications, Lda.)
and continuous (dispersion) models can model
chromatographic columns. Currently, the models
used by the researchers are robust and efficient, but
they require a numerical treatment of partial
differential equations, which carries a high
computational cost.
In order to get a new math model to predict the
profiles of separating compounds of a mixture
submitted to a chromatographic separation by SMB
adsorption process, the new approach called Front
Velocity is proposed.
This approach does not require equilibrium
experiments, does not need application of adsorption
isotherms for characterizing the components
involved in the process, and is compost for ordinary
differential equations.
To validate the proposed model, it was applied in
the separation of the enantiomers of ketamine
anaesthetic (Santos, 2004; Santos et al., 2004) and
the results were compared with those obtained by
conventional models.
2 THEORY
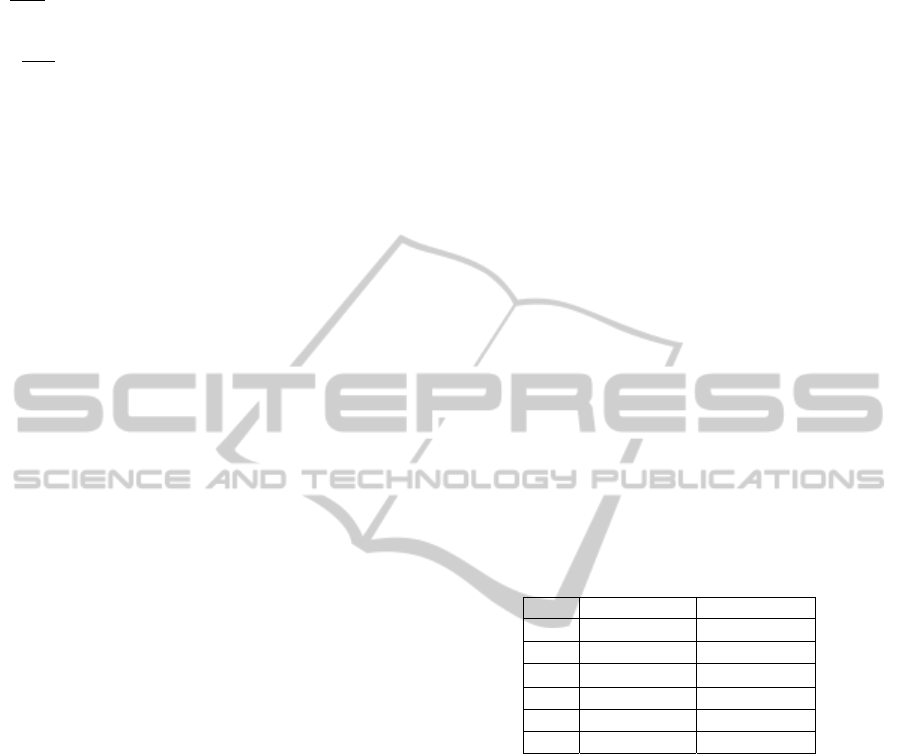
The SMB process used by Santos in the separation
of enantiomers of racemic Ketamine consists of
eight chromatographic columns connected in series,
divided two by two per section. Each column has
0.77 cm diameter and 20 cm in length as shown in
Figure 1. The more retained enantiomer (R) is
collected in the extract (Ex), while the least adsorbed
enantiomer (S) is collected in the raffinate (R).
Figure 1: SMB process with two chromatography columns
per section.
In the stationary and mobile phases were used,
respectively, MCTA (microcrystalline cellulose
acetate) and ethanol. (Santos et al., 2004) also used a
HPLC (High Performance Liquid Chromatography)
column, where was injected ketamine samples for
calibration and determination of purity. The HPLC
column used has 0.46 cm in diameter and 20 cm in
length.
To represent the mass transfer, which occurs
inside one chromatography column, during a
separation process, the Front Velocity new approach
was developed. This establishes that convection is
the dominant phase in the solute transport along the
chromatographic column. The Front Velocity is a
discrete model (mixed cells), where the flow rate
determines the liquid phase advances along the
column. The rate at which the liquid phase
percolates the porous column (v), is the ratio
between volumetric flow rate of the mobile phase
through the porous medium is described by Equation
1,
.
(1)
where, , and
represent the volumetric flow
rate, porosity and the total area of the porous
column, respectively (these data are obtained
experimentally).
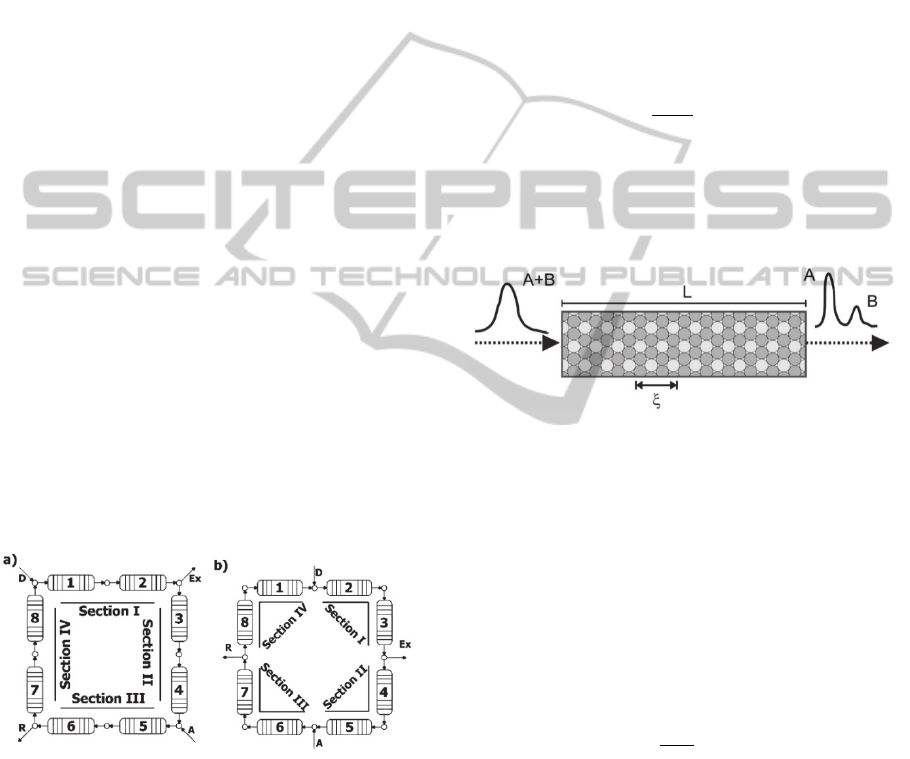
Figure 2: Chromatographic column of length L, and
volume control length ξ.
To perform the calculation of the mass transfer,
the chromatographic column was divided into
control volumes (mixed cells) of length ξ, that
moves along the column with the same speed as the
eluent, as can be seen in Figure 2.
The necessary time to move the liquid phase
along each control volume is obtained from
Equation 2, where is the total volume of the
column and is the number of mixed cells.
∆
.
.
(2)
To perform the calculation of the mass transfer in
the chromatography process SMB, the equations
with lumped mass transfer parameter kinetics (Eqs.
3, 4) assumes that equilibrium is achieved
everywhere at all times, so that the effects of axial
dispersion and the mass transfer resistance were
disregarded. Kinetic equations of mass transfer has
been successfully employed in chromatographic
processes (Câmara, 2014; Bihain et al., 2012).
SIMULTECH2014-4thInternationalConferenceonSimulationandModelingMethodologies,Technologiesand
Applications
6
ξ
.
.
(3)
ξ
.
.
(4)
,
, ,
,
, and represent the
concentration of compound in the liquid phase at
the column, the concentration of compound in
the solid adsorbent phase at the column, the
maximum adsorption capacity, the mass transfer
kinetic parameter of adsorption, the mass transfer
kinetic parameter of desorption and the time,
respectively. These equations (3, and 4) are applied
in all mixture cells (Antos and Seidel-Morgenstern,
2001) and solved numerically utilizing a fourth-
order Runge-Kutta method with a time step equal to
10–5 implemented in Fortran90.
The SMB process consists of four sections (Fig.
1), each on with different volumetric flow rate,
influenced by two input streams and two output
streams (feed, desorbent, extract, and raffinate). To
calculate the mass transfer in each column, first is
necessary determine those volumetric flow rate and
after incorporate the mass balance at the entrance of
each column. After each change in the
configuration of the streams (Fig. 1), the new mass
balance of solutes at the nodes has to be
recalculated.
As the SMB has two streams of input and two
output, the overall flow is necessarily written by
Eq.5.
(5)
To calculate the flow rates in each section and
the mass balance for the first column of each
section, equations 6-9 are used.
Section I:
,
.
.
(6)
Section II:
,
(7)
Section III:
(8)
.
.
(9)
Section IV:
,
(10)
, , , and represent the desorbent, Extract,
Feed, and Raffinate stream, respectively. is the
inlet concentration (concentration at the inlet of the
first column of each section), is the concentration
at the last column of each section, and is relative to
the compound mixture (eg in the case of the racemic
compounds, is R or S).
3 RESULTS AND DISCUSSION
3.1 Characterization of the
Chromatographic Column
A preview and important step in SMB
chromatography process is the characterization of
the columns, through of determination of the lumped
mass transfer parameter kinetics (
, and
).
These parameters determine the rate of adsorption
and desorption of molecules between the liquid and
solid phases.
Table 1: Lumped mass transfer parameters obtained from
the application of the inverse tool, R2W.
S enantiomer R enantiomer
0,00218857 0,00247352
0,05430671 0,02700426
0,04030017 0,09159742
n 505 505
29,567 29,567
R
*
2,54E-05 1,87E-06
*Is the sum of squares of the residuals between the simulation and
experimental data.
(Santos et al., 2004) via an analysis in a High
Performance Liquid Chromatography (HPLC)
system obtained the separations profiles of the
enantiomers of the Ketamine. To determine
,
and
parameters, the retention times
(experimental) observed in the chromatogram
(Santos et al., 2004) resulting from chromatographic
pulse in a HPLC analysis system were used in this
study. These data were combined with mass transfer
equations (Eq.3, and Eq.4) and with the inverse tool,
Random Restricted Window (R2W) (Câmara and
Silva Neto, 2008). The results can be seen on the
table 1. The R2W is considered a simple stochastic
inverse method, which uses a search algorithm with
a random distribution.
In Figure 3, it is remarkable the good correlation
between the experimental data (chromatogram), and
TheFrontVelocityApproachintheModellingofSimulatedMovingBedProcess(SMB)
7
the simulation performed with Front Velocity
approach.
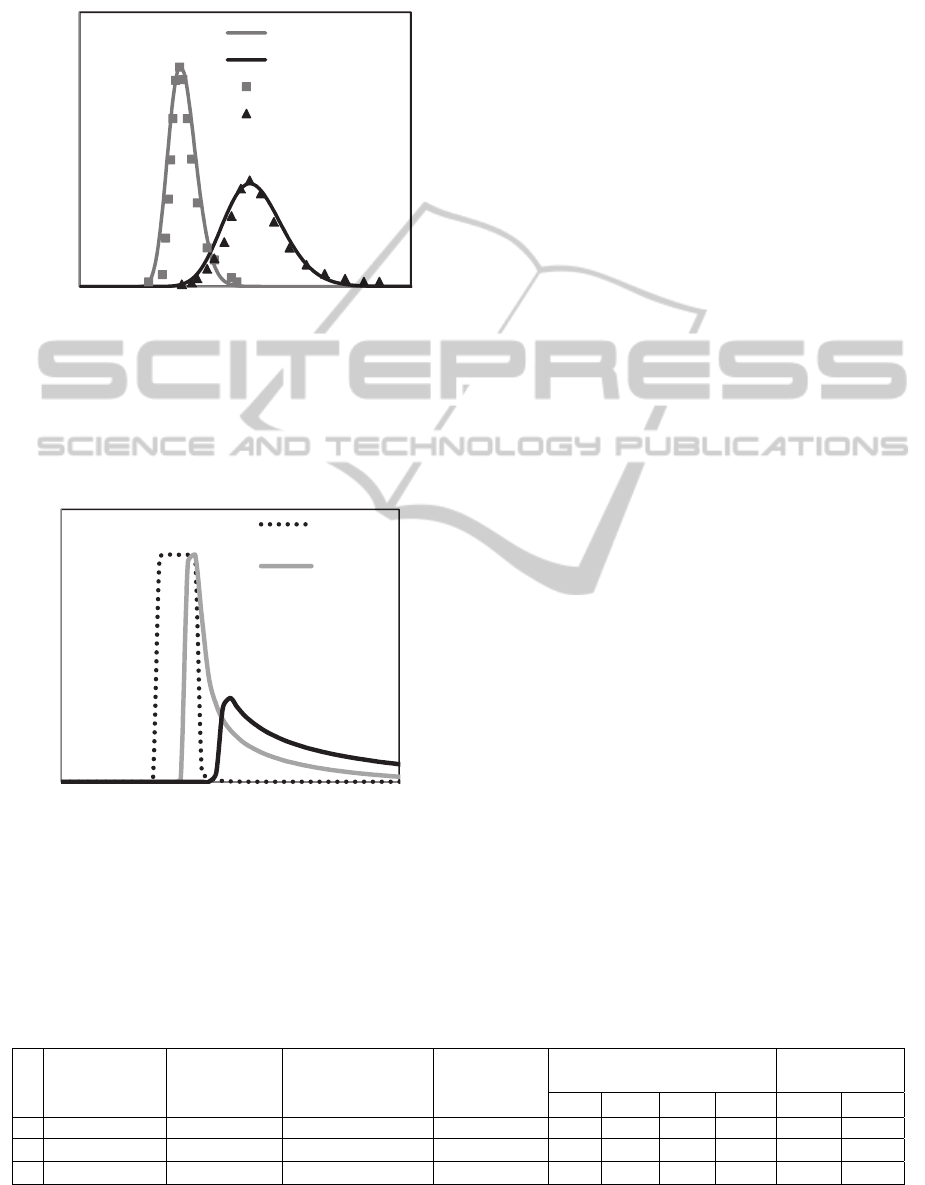
Figure 3: Chromatogram of racemic ketamine injection in
the analysis column packed with MCTA; anhydrous
ethanol as mobile phase, flow rate 0.25 mL/min, loop
20, the solution concentration 1.5 g/l. Results simulated
with Front Velocity approach, compared to the
experimental data.
Figure 4: Variation of the maximum adsorption capacity
of the adsorbent phase.
15/,30/
,300,10,005/.,2
0,01/.
In a theoretical analysis performed to one
chromatographic pulse as can be seen in figure 4, is
observed that the novel approach presented in this
work has potential to represent the resistance to
mass transfer as well as the saturation of the
adsorbent phase (rectangular peak). The
chromatogram of the simulation also shows a peak
tailing, which is a behaviour observed in the
literature with the use of adsorption isotherms.
Therefore, the characterization of a chromatography
column cannot be linked exclusively with the
isotherm application, but also with mass transfer
kinetic equations.
3.2 SMB Continuous Process
With the data obtained (Table 1) in the
chromatographic column characterization stage, the
SMB was performed under the experimental
conditions (table 2) that were determined by (Santos
et al., 2004). The kinetic equations (Equations 3-4)
and mass balance equations (Equations 6-9) were
applied to each column of the SMB to simulate
separation of the enantiomers of the ketamine,
allowing the results were compared with those
obtained by (Santos et al., 2004; Santos, 2004).
The equations used in the modeling of the LMS
in this work, were solved numerically utilizing a
fourth-order Runge-Kutta method, and implemented
in Fortran 90. The total simulation time to SMB was
approximately 1.5 minutes on a computer with Intel
Core i5 processor (2.3 GHz) with a time step equal
to 10
. The number of mixed cells (divisions of the
columns) in each section is determinate by
volumetric flow rate (figure 1), and it is around 300-
1000 equilibrium stages as can be seen in tables
Table 3.
The differential partial equations of the
dispersive equilibrium model used by Santos et al.
(2004), were solved by public subroutine PDECOL
(Madsen and Sincovec, 1979), which implements
the finite element method for spatial discretization
and the ordinary differential equations were solved
by GEARIB time integrator (Hindmarsh, 1976). The
total simulation time was about 4 hours, using an
Table 2: Operation condition evaluations according to solvent consumption, productivity, and purity.
Feed
Concentration
Switch time
(seconds)
Solvent
consumption
(L/g rac.)
Productivity
(q.rac./D.kg)
Volumetric flow at the
streams (min
)
Purity (%)
Ext. Raff. Feed
S R
1 1.5 1500 2.67 10.65 0.47 0.43 0.18 1.10 99.83 99.71
2 2.5 1500 1.6 17.75 0.47 0.43 0.18 1.10 99.84 99.71
3 5 1500 1.46 19.79 0.44 0.39 0.1 1.10 99.99 99.90
0
0,002
0,004
0,006
0,008
0,01
0,012
0 204060
Concentration(g/L)
Time(min)
S‐FrontVelocity
R‐FrontVelocity
S‐Experimental
R‐Experimental
0
2
4
6
8
10
12
14
16
18
0 20406080
Conc.(g/L)
Time(min)
qm=0.1
g/L
qm=5g/L
SIMULTECH2014-4thInternationalConferenceonSimulationandModelingMethodologies,Technologiesand
Applications
8
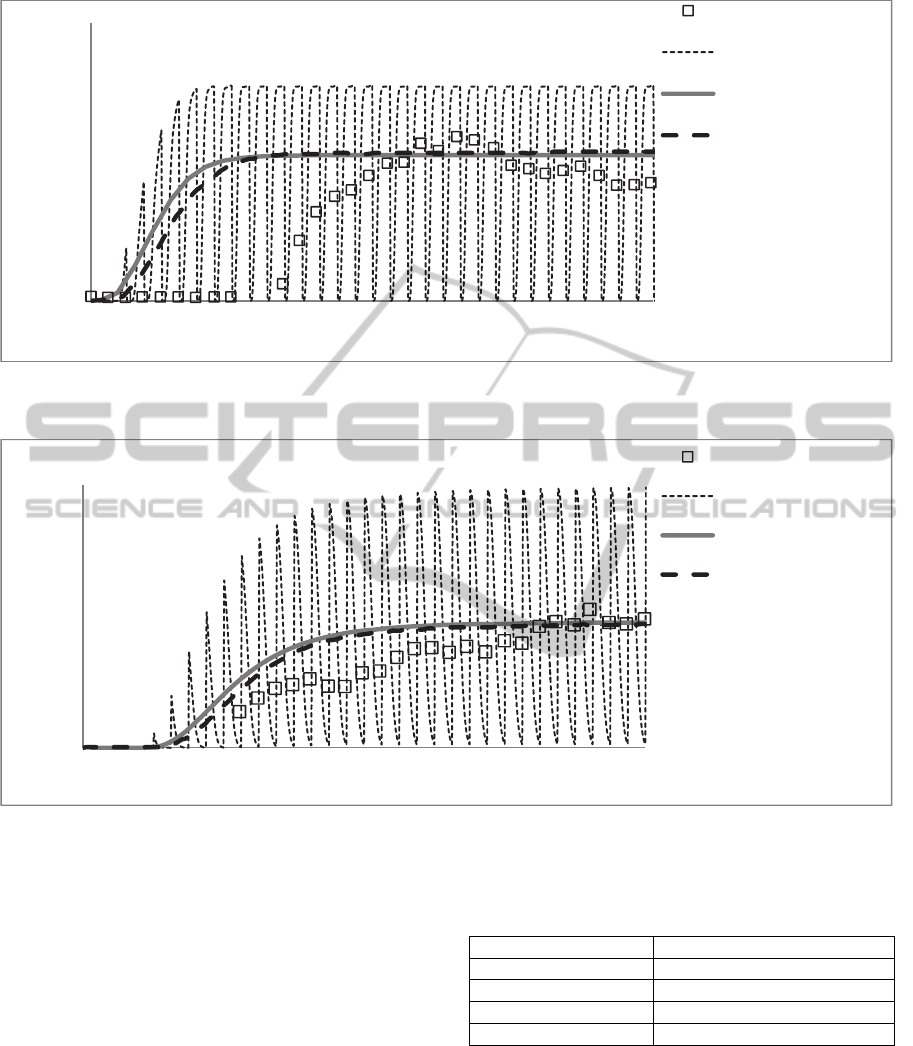
Figure 5: SMB evolution of S enantiomer concentration in the extract stream over time (transient), under experimental
condition 1.
Figure 6: SMB evolution of R enantiomer concentration in the raffinate stream over time (transient), under experimental
condition 1.
Intel Pentium IV (2.4 GHz) processor, with a time
step equal to 10
. Each column has been divided
only into 30 elements.
The good correlation between the simulation
using the Front Velocity approach, and the classical
model used by (Santos et al., 2004), over the time in
the separation process can be seen in Figures 4, and
5. In addition, a comparison with the experimental
data in the extract and raffinate streams can be
visualized, where there is a small deviation between
the simulated and experimental data while the
process is still in the transient. When the process
achieves the pseudo steady-state is reached a better
fit.
Table 3: Number of mixed cells of the columns per
section.
SMB Sections Number of control volumes
Section I 322
Section II 562
Section III 437
Section IV 932
Figure 7 shows the concentration profiles of each
enantiomer over the columns when the SMB reaches
steady state. The good representation of the new
approach is observed due to correlation with
experimental data, and may be noted that Front
Velocity achieves a slightly better fit compared with
(Santos et al., 2004) simulations.
0
0,1
0,2
0,3
0,4
0,5
0,6
0 100 200 300 400 500 600 700 800
Concentration(g/L)
Time(min)
Exp.Santos
FrontVelocityaverage
FrontVelocitysim.
average
Santossimulation
average
0
0,1
0,2
0,3
0,4
0,5
0,6
0 100 200 300 400 500 600 700 800
Concentration(g/L)
Time(min)
Exp.Santos
FrontVelocity
simulation
FrontVelocityaverage
Santossimulation
average
TheFrontVelocityApproachintheModellingofSimulatedMovingBedProcess(SMB)
9
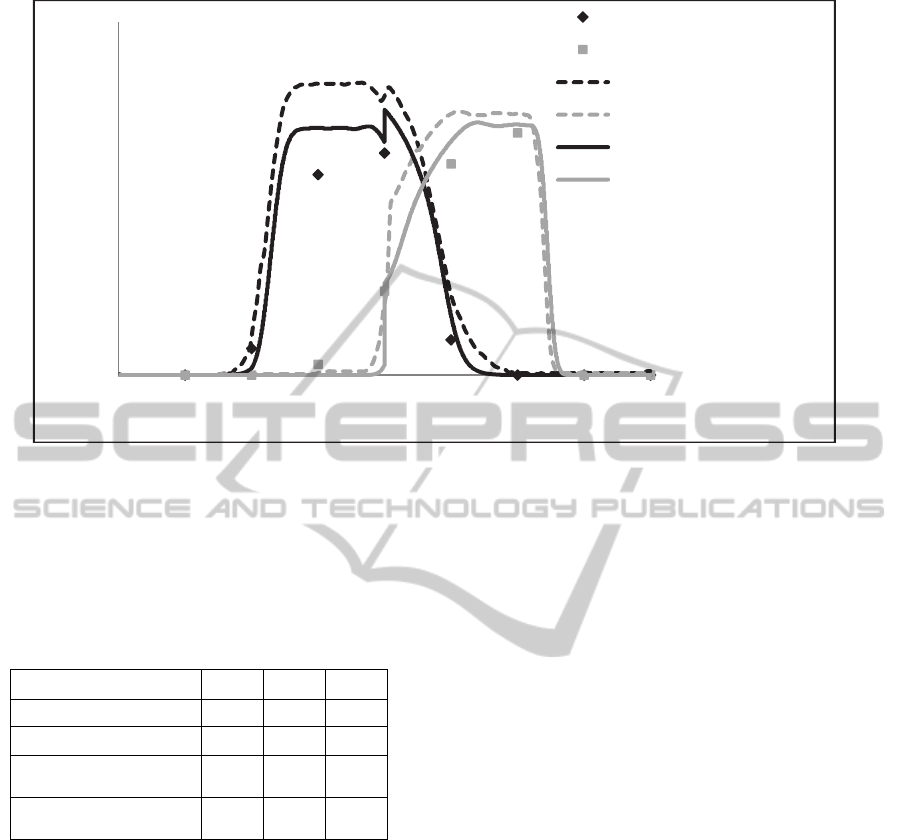
Figure 7: SMB evolution of R enantiomer concentration in the raffinate stream over time (transient).
The solvent consumption, productivity, and
purity showed in table 4 were calculated with the
novel approach proposed in this work. These results
are very similar to experimental values (Table 2).
Table 4: The solvent consumption, productivity, and
purity calculated with Front Velocity approach.
Experimental condition 1 2 3
Raffinate purity (S) % 97.72 98.84 99.89
Extract purity (R) % 99.70 99.93 99.99
Productivity
(q.rac./D.kg)
10.63 17.63 19.49
Solvent consumption
(L/g rac.)
2.66 1.61 1.47
4 CONCLUSIONS
A set of programs for continuous simulation of SMB
process, and also to characterize the
chromatographic column was developed and used
under the new proposed idea of modeling the pulse
experiment to determine the kinetic constants of
mass transfer with mass transfer kinetic equations,
instead of performing equilibrium experiments and
combining them with some kind of adsorption
isotherm. This procedure satisfactorily performed
the separation of the enantiomers of the anaesthetic
ketamine at SMB. The R2W algorithm was effective
in determining the parameters of adsorption,
desorption, and the maximum adsorption capacity of
the adsorbent phase (
,
,
).
The concentration profiles of the simulations
proved to be consistent with the SMB process, and
the simulated profiles of enantiomers were similar to
the experimental data, showing a slightly more
suiting behaviour in relation to the experimental data
than the classical modeling as the model adopted by
(Santos et al., 2004).
The results showed the potential of Front
velocity in the prediction of the SMB separations. In
a shortest time than classical models this approach
performs a full simulation of the separation in a
SMB process. The low computational cost is due the
use the ordinary differential equations in this
approach that requires less parameters than classical
models, furthermore, the ease of implementation and
analysis, and the need to know just few operational
data of the real problem. Another relevant fact is no
be necessary performing equilibrium experiments to
characterize the chromatographic column.
ACKNOWLEDGEMENTS
The authors acknowledge the financial support from
UERJ, CNPq and CAPES.
0
0,1
0,2
0,3
0,4
0,5
0,6
0,7
012345678
Concentration(g/L)
Columns
Renantiomer
Senantiomer
RenantiomerSoaressim.
SenantiomerSoaressim.
EnantiomerR‐FrontVelocity
EnantiomerS‐FrontVelocity
SIMULTECH2014-4thInternationalConferenceonSimulationandModelingMethodologies,Technologiesand
Applications
10

REFERENCES
Antos, D. and Seidel-Morgenstern, A. (2001). Chemical
Engineering Science, 56, 6667.
Bihain, A. L. J., Silva Neto, A. J., Santiago, O. L., Afonso,
J. C., Câmara, L. D. T. The front velocity modelling
approach in the chromatographic column
characterization of glucose and fructose separation in
SMB. Trends in Chromatography, v. 7, p. 33-41,
2012.
Broughton, D. B. (23 May 1961). EUA Patent Nº
US002985589.
Câmara, L. D. and Silva Neto, A. J. (2008). Inverse
Stochastic Characterization of Adsorption Systems by
a Random Restricted Window (R2W) Method.
International Conference on Engineering
Optimization (ENGOPT). Rio de Janeiro - RJ.
Câmara, L. D. Stepwise Model Evaluation in Simulated
Moving-Bed Separation of Ketamine. Chem. Eng.
Technol. 2014, 37, No. 2, 301–309.
Gal, G., Hanak, L., Argyelan, J., Strbka, J., Szanya, T.,
Aranyi, A., & Temesvari, K. (2005). Simulated
Moving Bed (SMB) Separation of Pharmaceutical
Enantiomers. Hungarian Journal of Industrial
Chemistry, 33, pp. 23-30.
Gomes, P. M., Figueirêdo, R. M. and Queiroz, A. J.
(2002). Caracterização e Isotermas de Adsorção de
Umidade da Polpa de Acerola em Pó. Revista
Brasileira de Produtos Agroindustriais, 4(2), pp. 157-
165.
Gonçalves, C. V. (2008). Separação do Racemato N-Boc-
Rolipram pelo Processo Cromatografico de Leito
Movel Simulado Utilizando Fase Estacionaria Quiral
Tris-(3,5-dimetilfenilcarbamato de celulose)
Suportada em Silica. Campinas: UNICAMP: Doctoral
thesis.
Hindmarsh, A. (1976). Preliminary Documentation of
GEARIB - Solution of Implicit Systems of Ordinary
Differential Equations with Banded Jacobian. Report
UCID - 30130.
Madsen, N. K. and Sincovec, R. F. (1979). PDCOL:
General Collection Software for Partial Differential
Equations. ACM Trans. Math. Software, 5, pp. 326 -
351.
Santos, M. A. (2004). Separação dos Enantiômeros do
Anestésico Cetamina por Cromatografia Contínua em
Leito Móvel Simulado. Campinas: UNICAMP:
Doctoral thesis.
Santos, M. A., Veredas, V., Silva JR, I. J., Correia, C. R.,
Furlan, L. T. and Santana, C. C. (2004). Simulated
Moving-Bed Adsorption for Separation of Racemic
Mixtures. Brazilian Journal of Chemical Engineering,
21(01), pp. 127-136.
Zaijun, L., Xiulan, S. and Junkang, L. (2011). Ionic Liquid
as Novel Solvent for Extraction and Separation in
Analytical Chemistry. Chemical Engineering
Applications and Perspectives, pp. 154-180.
TheFrontVelocityApproachintheModellingofSimulatedMovingBedProcess(SMB)
11
