
Simplified Closed Form Numerical Approaches to Predict Natural
Rubber Behavior under Sulfur Curing in Standard Rheometer Tests
Marco Brotto
1
, Gabriele Milani
2
and Federico Milani
1
1
CHEM.CO Consultant, Via J.F.Kennedy 2, 45030 Occhiobello (RO), Italy
2
Technical University in Milan, Piazza Leonardo da Vinci 32, 20133 Milan, Italy
Keywords: Rubber Vulcanization, NR, Numerical Model, Kinetic Approach.
Abstract: In this paper, a complex numerical and a simplified mathematical closed form approach with robust kinetic
base are proposed to interpret NR sulfur vulcanization. A preliminary phase of preparation of meta-
rheometer curves from few experimental data may be necessary to have at disposal the whole curve to fit
with the model when experimental data at disposal are a few. Then, on such data (either experimental or
artificially generated) partial reaction kinetic constants characterizing the vulcanization process within the
models proposed are derived. When needed, meta-data are obtained using a direct C2 natural cubic spline
interpolation of the rheometer curve, which proved to fit the experimental data well. Both the presence and
absence of reversion are discussed and how they are reflected in the model calculations. The chemical
schemes, translated mathematically into differential equations systems, are suitably re-arranged to derive
single analytical equations, which represents the crosslinking degree evolution vs time. The parameters of
the single equations may be determined setting the kinetic constants of the chemical model by means of best
fitting in the first model (more complex) and with the direct solution of a non linear system of equations in
the second (simplified) approach. The major improvement of the second procedure here proposed is to
utilize some ad hoc values for the kinetic constants that do not necessarily require an optimization
algorithm, thus by-passing the usage of a least squares minimization routine.
1 INTRODUCTION
Sulphur vulcanization maybe represents the most
popular technique to cure both natural rubber (NR)
and its synthetic counterpart (IR), as well as for
other synthetic rubbers such as polybutadiene (BR),
styrene–butadiene rubber (SBR), nitrile rubber
(NBR), butyl rubber (IIR), and ethylene–propylene–
diene rubber (EPDM), only to indicate the most
important in the market. In general, it is commonly
accepted that vulcanization takes place roughly into
three steps: induction, crosslinking and post
crosslinking. The idea comes from the macroscopic
interpretation of what happens to a sample during
controlled temperature curing conditions in the
rheometer chamber. The rheometer curve, which is
simply the measure of the torque resistance of a
sample subjected to fixed temperature cure at
increasing time, typically exhibits an initial plateau
with low and slightly decreasing torque, a rapid
crosslinks formation with a significant torque
increase and eventually a final degradation, i.e. a
torque decrease, at sufficiently large vulcanization
times, usually denoted with the term “reversion”.
Reversion is a key distinctive aspect of the
vulcanization with sulphur and, from a macroscopic
point of view, consists in a remarkable decrease or
rubber vulcanized properties at the end of the curing
process. It depends on a series of concurring factors,
the most important being rubber type, its structure,
% of double bonds see (Milani and Milani, 2012),
presence of additives, in particular the accelerators,
and co-adjuvants, as well as vulcanization
temperature.
In the paper, two numerical models to interpret
natural rubber vulcanization with reversion are
presented: a complex and a simplified one. Both of
them have robust kinetic base. A preliminary phase
of preparation of meta-rheometer curves from few
experimental data may be necessary to have at
disposal the whole curve to fit with the model when
experimental data at disposal are a few. In this latter
case, meta-data are obtained using a direct C2
natural cubic spline interpolation of the rheometer
141
Brotto M., Milani G. and Milani F..
Simplified Closed Form Numerical Approaches to Predict Natural Rubber Behavior under Sulfur Curing in Standard Rheometer Tests.
DOI: 10.5220/0005013401410147
In Proceedings of the 4th International Conference on Simulation and Modeling Methodologies, Technologies and Applications (SIMULTECH-2014),
pages 141-147
ISBN: 978-989-758-038-3
Copyright
c
2014 SCITEPRESS (Science and Technology Publications, Lda.)

curve, which proved to fit the experimental data
reasonably well. On either experimental or
artificially generated data, two kinetic schemes are
assumed to fit rheometer curves, the first involving 5
kinetic constants, the second only 2. The chemical
schemes, translated mathematically into differential
equations systems, are suitably re-arranged to derive
single analytical equations, which represents the
crosslinking degree evolution vs time. Kinetic
constants of the first model are derived by means of
a best fitting procedure, whereas in the second
model the solution of a two variables non linear
system of equations is needed. The major
improvement of the second procedure here proposed
is avoid the utilization of an optimization algorithm,
which sometimes proved to be not sufficiently
robust. Both models are validated on a wide set of
experimental data available in the literature.
Figure 1: Products and schematic reaction mechanisms of
NR accelerated sulphur vulcanization.
2 META-DATA GENERATION
WITH NATURAL CUBIC
SPLINES
When a few “characteristic” experimental points on
the rheometer curve are available, i.e. when the
entire cure curve is not at disposal, a natural cubic
spline interpolation of the experimental data at hand,
which typically include a few “meaningful” points
may be used to produce a meta-curve approximating
the experimental rheometer one, see (Milani and
Milani, 2014a; Milani and Milani, 2014b). Instead of
MHF the reversion percentage, i.e. the decrease in
the peak torque at the end of the rheometer test, may
be provided.
The fundamental idea behind cubic spline
interpolation is based on the engineer’s tool used to
draw smooth curves through a number of points of
the actual rheometer curve M(t).
Spline interpolation is based on the following
hypotheses:
1) The piecewise function M(t) interpolates all data
points.
2) M(t) together with its first and second derivatives
(M‘(t) and M‘‘(t) respectively) are continuous on the
interval 0-t
max
.
The kernel, Deitel relies on the fitting of known
experimental points at times t1, t2,., tn by means of a
piecewise function of the form:
nnn
tttiftM
tttiftM
tttiftM
tM
11
322
211
(1)
where
i
M
are third degree polynomial defined by
iiiiiiii
dttcttbttatM
23
with
1,,2,1
ni
.
The previous interpolating function has first and
second derivative equal to:
iiii
iiiiii
bttadttMd
cttbttadttdM
26/
23/
22
2
(2)
Assuming that the composite function passes
through experimental points (say that, at ti, the
rheometer curve has a torque equal to
i
M ), it is
continuous with its first and second derivatives
(equal to
'
i
M and ''
i
M in
i
t
respectively) we
obtain 2
n
-2 mathematical conditions from the
passage through points and 2(
n
-2) conditions for
the first and second derivative continuity
respectively.
Total coefficients to set are 4(
n
-1), so that the
number of coefficients exceed equality conditions by
2 equations.
In order to evaluate the degree of vulcanization
t
exp
, see (Milani et al., 2013) and (Sun et al.,
2009), the following relation may be used:
cross-link precursor
form ation
K
0
S
sulphurating
agent
unvulcanized
natural
rubber
X
1
cross-link precursor
(S)
y
X
formation of stable S-S
bond
K
1
X
2
formation of unstable S-S
m ultiple bond
K
2
S*
(S)
1,2
reticulated rubber
(S)
x>2
reticulated rubber
X
1
multiple bond break
K
3
bond break
X
2
single/double bond break
K
4
D'
D
SIMULTECH2014-4thInternationalConferenceonSimulationandModelingMethodologies,Technologiesand
Applications
142

00
minmax
min
exp
'
TT
T
SS
StS
t
(3)
where:
- M
minT
is the minimum value of torque M(t) during
a cure experiment at temperature T. Before reaching
this minimum value,
t
exp
is considered equal to
zero.
- M
minT0
and M
maxT0
are the minimum and maximum
torque values obtained for a cure experiment at a
temperature T
0
low enough to allow reversion to be
neglected.
In this way, the rheometer curves to fit always
range between 0 and 1, with a maximum torque
sensibly less than 1 for high vulcanization
temperatures.
3 A REFINED FIVE CONSTANTS
KINETIC MODEL
A mechanistic model, already presented in (Milani
et al., 2013), based on a detailed kinetic scheme, is
here recalled. The mathematical solution of the
mechanistic model allows to numerically reproduce
rheometer curves for NR vulcanized with sulfur. The
basic reaction schemes are schematically represented
in Figure 1. Such scheme simplifies well established
chemical interpretations available from the technical
literature, see (Ding and Leonov, 1996; Han et al.,
1998; Leroy et al., 2013).
Adopting for NR the kinetic scheme constituted
by the chemical reactions shown in Figure 1, the
following schematization holds:
*
0
SS
k
'
31
1
*
DXS
k
k
DXS
kk
42
2
*
(4)
In Equation (4),
S
is the uncured polymer,
*
S
the unmatured crosslinked polymer, which evolves
into matured
crosslinked polimer
1
X
+
2
X
, with
1
X
indicating the stable crosslinked part and with
2
X
the unstable part. Part of both
1
X
and
2
X
may
evolve into
D
and
'
D
unvulcanized polymer due to
multiple S-S chains breaks and consequent
backbiting.
4,...,0
K
are kinetic reaction constants.
Here it is worth emphasizing that
4,...,0
K
are
temperature dependent quantities, hence they
rigorously should be indicated as
)(
4,...,0
TK
, where
T
is the absolute temperature. In what follows, for
the sake of simplicity, the temperature dependence
will be left out.
Differential equations associated to chemical
reactions are the following:
(a)
SK
dt
dS
o
(b)
*
210
*
'
SKKSK
dt
dS
(c)
13
*
1
1
XKSK
dt
dX
(d)
24
*
2
2
XKSK
dt
dX
(5)
A closed form solution for the crosslink degree,
intended as
21
XX
, may therefore be
deduced from relations (7). In particular, the
variation of the cure degree as a function of time
t
assumes the following form:
tK
tK
tKK
tKK
tK
tK
e
KKKKK
SKK
e
KKKKK
SKK
e
KKK
K
C
e
KKK
K
C
eCeCXX
0
0
21
21
3
4
30021
020
40021
010
321
2
2
421
1
2
6421
(6)
Having indicated with
2
C
,
4
C
and
6
C
the
following integration constants:
201
00
2
KKK
SK
C
42140
010
4
KKKKK
SKK
C
32130
020
6
KKKKK
SKK
C
(7)
and with
0
S
the initial amount of unvulcanized
polymer, which, as already mentioned, has to be put
equal to 1 when the crosslink percentage
(ranging from 0% to 100%) has to be determined.
SimplifiedClosedFormNumericalApproachestoPredictNaturalRubberBehaviorunderSulfurCuringinStandard
RheometerTests
143

3.1 Starting Point Determination
In order to evaluate kinetic constants of the model
(problem (4)), a non-linear least squares routine -to
fit with the mathematical model normalized
rheometer curves- has to be used, see (Milani et al.,
2013). The utilization of non-linear optimization
algorithms is not always effective, may fail in some
cases in finding the minimum point or may require
an excessive processing time. Two alternative
strategies are possible, the first is to find a
reasonable starting point, intending with the term
reasonable a point sufficiently near the solution of
the least-squares problem. Such procedure is
however not an easy task in this case and the starting
point determination is usually done by attempts,
discriminating the quality of the starting point
looking at the stability of the algorithm. An
alternative is to simplify the kinetic scheme and
compare the results obtained with those provided by
the mathematical solution of problem (4).
4 THE NEW SIMPLIFIED
MECHANISTIC MODEL
PROPOSED
In this section, we propose a novel, simplified but
robust mechanistic model to fit experimental
rheometer curves that do not require the least
squares data fitting, mandatory for solving problem
(4).
According to the chemical reactions reported in
Figure 1, it is possible to analyze the problem by
means of the following simplified kinetic model:
'
'
PP
k
*
*
' PP
k
(8)
Where
21
' KKK
and
43
* KKK
.
Differential equations associated to chemical
reactions are the following:
(a)
PK
dt
dP
'
(b)
''
'
*
PKPK
dt
dP
(c)
'
*
*
PK
dt
dP
(9)
Differential Eq. (9)(a) may be solved
immediately providing
)(tP
as
tK
ePtP
'
0
)(
. The
previous equation may be substituted into Eq. (9) (b)
providing directly a differential equation for
)(' tP
,
which represents the matured polymer as:
tk
eKPPK
dt
dP
'
0
''*
'
(10)
which is solved in closed form finding a general
integral and a particular solution.
The general integral is the following:
tK
g
eCP
*
1
'
(11)
whereas a particular integral is:
*
'
01
'
'
**
*
KK
ee
PeCP
tKKtK
tK
p
(12)
So that the solution of the differential equation under
study is:
*
'
01
'
'
**
*
KK
ee
PeCP
tKKtK
tK
(13)
Assuming that
00'
P
, hence Eq. (13) becomes:
tKKtK
ee
KK
P
tP
**
'
*
0
1
'
'
(14)
Assuming that at t
1
the rheometer curve reaches a
maximum and that at t
2
the reversion percentage is,
say,
R, it is possible to directly evaluate '
K
and
*
K
by means of the solution of a non linear system
of equations (two equations in two variables).
5 MODEL VALIDATION
A full validation of the approach proposed has been
already performed on the 5 kinetic constant model,
considering some experimental data available in the
technical literature, see (Davis et al., 1986), where a
NR blend is vulcanized with sulphur, in presence of
different accelerators at the same curing temperature
(144°C). The accelerators proved, in some cases, to
give the blend an excellent reversion resistance.
SIMULTECH2014-4thInternationalConferenceonSimulationandModelingMethodologies,Technologiesand
Applications
144

Figure 2: preliminary simplified model validation on data
set 5 of Table 1 and Table 2.
The performance of the accelerators was
comparatively estimated collecting a few rheometer
data, as for instance
2
t
and
90
t
times, reversion %,
total cure time, maximum torque and some
mechanical
properties of the cured specimens, as
elongation at break, ultimate tensile strength and
elastic modulus at 300% of elongation. Information
regarding the behaviour of the blend in the
rheometer chamber is particularly suitable to
calibrate meta data in the first step.
A preliminary validation of the simplified
procedure proposed in this paper is still running and
is under study by the authors. However, first results
obtained on some data sets, see e.g. Figure 2, seem
to confirm a generally satisfactory capability of the
numerical model to fit reasonably well the main
features of the experimental rheometer curves, i.e.
amount of reversion and time needed to achieve an
optimal vulcanization.
When dealing with specific chemical aspects of
the validation, it is possible to compare synoptically
the numerical results obtained in terms of kinetic
constants (5 constants model), see Figure 3, with
reference to the experimental results available, see
Table 1 and Table 2.
Using dialkyldithiophosphates (as ZDBDP) it is
possible to obtain improved reversion resistance, see
(Davis et al., 1986). However, blends containing
such accelerators generally burn slightly on the
surface and this affects their practical use. ZDBDP
with TBBS is a accelerators combination that
decreases drastically the cure time needed, but with
a very short scorch delay. With about a
stoichiometric equivalent by w. of CTP, roughly the
same improvements in the curing rate with very
small reversion may be obtained. Finally, certain
triazine derivatives have been identified as active
accelerators however, increasing their amount in the
blend also with the PSSR accelerator resulted into
superficial burn.
Table 1: Overview of the experimental data utilized to
validate the two-step numerical model (1/2).
Numerical
Test #
1 10 5 6 11 9
Reversion % 19.1 17.1 12.1 9.5 6.5 3.9
M300
[MPa]
15.2 11.8 14.5 14.3 15.0 18.5
UST [MPa] 28.8 27.5 28 27.1 26.0 29.0
UE [%] 517 574 499 510 477 459
Cure time
[min]
25 21.2 36.5 30.0 50.7 29
ODR 144°C
t2 [min] 9.2 4.65 10.5 9.5 10.9 10.5
t90 [min] 21.6 17.4 31.7 25.5 45.8 25.2
Products concentration in phr
PYSSPY 1.0 1.0
MBS 0.25
TBBS 0.6
TSSR 0.7 1.0
MBTS 1.0
Table 2: Overview of the experimental data utilized to
validate the two-step numerical model (2/2).
Numerical Test # 4 8 7 2 3
Reversion % 6.1 9.0 5.7 5.6 6.5
M300 [MPa] 15.5 11.6 16.8 13.0 13.2
UST [MPa] 28.0 25.0 27.1 28.0 28.0
UE [%] 503 544 464 555 550
Cure time [min] 29 43 26 13 24
ODR 144°C
t2 [min] 7.8 15.3 9.5 5.7 14.7
t90 [min] 25 37.6 22.5 12.0 22.0
Products concentration in phr
TSST 0.7
PSSR 1.0 0.5
TSSR 0.5
TBBS 0.2 0.2
ZDBDP 0.76 0.76
CTP 0.72
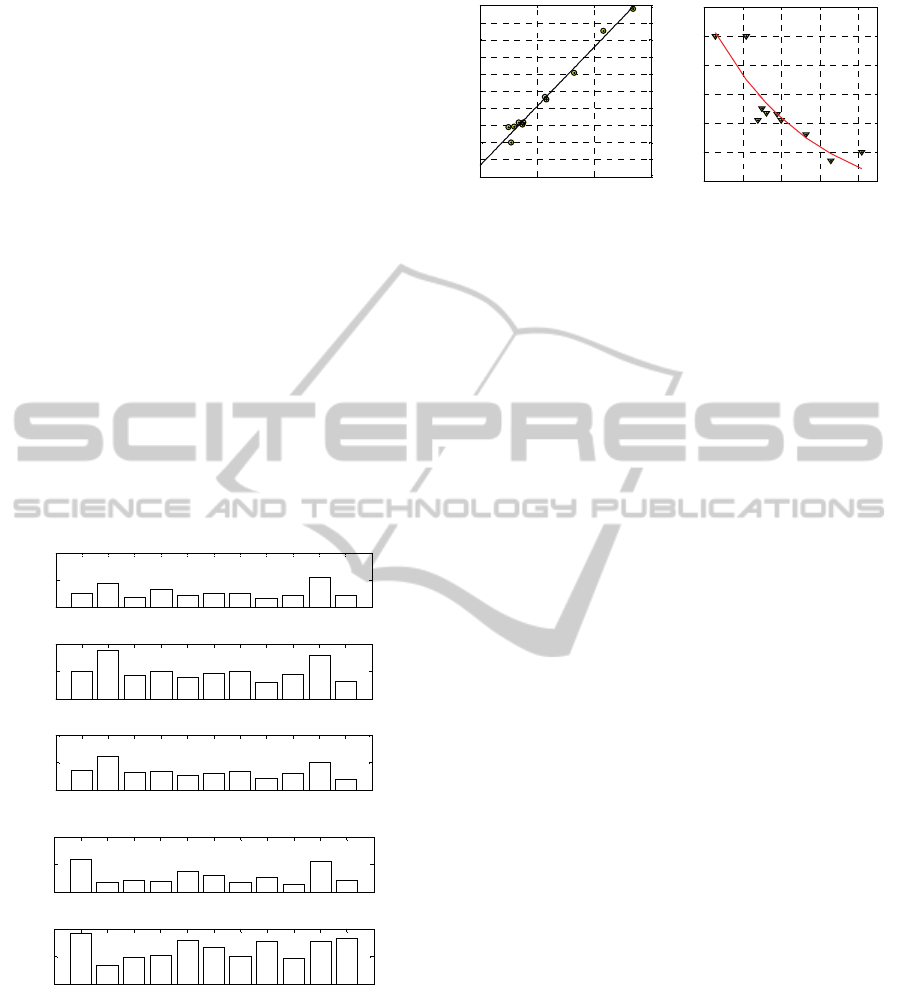
Finally, plotting the numerical constants found
with the 5 kinetic constants model as in Figure 4 (in
subfigure –a a relationship between K
3
+K
4
and
reversion % is provided whereas in subfigure –b a
relationship between K
1
+K
2
and cure time is shown)
it is very straightforward to conclude that K
3
+K
4
(which follow almost rigorously a straight line for
the reversion) globally gives a quantitative
information on the amount of degradation of cure,
whereas K
1
+K
2
the speed of reticulation. Best fitting
curves reported in Figure 4 may be therefore
0 2 4 6 8 10 12
0
0.2
0.4
0.6
0.8
1
1.2
1.4
Time [min]
Normalized torque M
t
/M
tmax
Coran set-5
Present model solution
Full experimental meta data curve
SimplifiedClosedFormNumericalApproachestoPredictNaturalRubberBehaviorunderSulfurCuringinStandard
RheometerTests
145
extremely useful from a practical point of view to
directly predict the most important parameters of
vulcanization of a rubber blend, i.e. time needed for
curing and expected reversion.
6 CONCLUSIONS
Two kinetic models suitable -to interpret NR
vulcanization in presence of reversion- through the
utilization of the experimental rheometer curve have
been presented. Depending on the level of
complexity of the kinetic model proposed, more
detailed or less precise information on the degree of
curing, as well as on the single and multiple-bond
percentage of resulting links may be retrieved.
However, an increased complexity of the models
results both into the impossibility to deal with
closed-form predicting expressions for the cure
percentage and in complex numerical best fits on
experimental data available to estimate single kinetic
constants representing the chemical scheme adopted.
Figure 3: Synoptic comparison between the partial kinetic
constants obtained in the different cases analyzed
numerically.
Two models of different complexity have been
presented: the first describes in a quite complex way
the vulcanization process and requires the
knowledge of five kinetic constants, the second is
rougher but less complex, needing only the
evaluation of two kinetic constants.
-a -b
Figure 4: –a: Relationship between K
3
+K
4
and reversion
%. –b: relationship between K
1
+K
2
and cure time.
The first approach proved to fit very well
experimental rheometer curves (or meta-curves
deduced numerically from few experimental data
available), but needs expensive and not always
robust best fitting procedures, whereas the second is
less precise but allows the determination of model
constants directly by mean of the solution of a non-
linear equations system into only two variables.
The validation of the simplified model is still
running. In particular, the choice of the two points
into the rheometer curve to select in order to obtain
the best performance of the model (in terms of
fitting) appears the key issue to be investigated.
REFERENCES
ASTM D 2084-81, Annual Book, 1986.
Davis, L.H., Sullivan, A.B., Coran, A.Y., 1986. New
curing system components. In Proc.: International
Rubber Conference IRC 86 – Goeteborg, Sweden ,
vol.2 , p.387-392.
Ding, R., Leonov, I., 1986. A kinetic model for sulfur
accelerated vulcanization of a natural rubber
compound. J. Appl. Polym. Sci., 61, 455.
Han, I.S., Chung, C.B., Kang, S.J., Kim, S.J., Chung,
H.C., 1998. A kinetic model of reversion type cure for
rubber compounds. Polymer (Korea), 22, 223.
Leroy, E., Souid, A., Deterre, R., 2013. A continuous
kinetic model of rubber vulcanization predicting
induction and reversion. Polym. Test., 32 (3), 575.
Milani, G., Milani, F., 2010. A new simple numerical
model based on experimental scorch curve data fitting
for the interpretation of sulphur vulcanization. J. Math.
Chem., 48, 530.
Milani, G., Milani, F., 2012. Comprehensive numerical
model for the interpretation of cross-linking with
peroxides and sulfur: Chemical mechanisms and
optimalvulcanization of real items. Rubber Chem.
Technol., 85 (4), 590.
Milani, G., Leroy, E., Milani, F., Deterre, R., 2013.
Mechanistic modeling of reversion phenomenon in
1 2 3 4 5 6 7 8 9 10 11
0
1
2
# numerical simulation
K
0
[1/min]
Ave rage
Aver age
Average
1 2 3 4 5 6 7 8 9 10 11
0
2
4
# numerical simulation
K
1
[1/min]
Aver age
Aver age
Aver age
1 2 3 4 5 6 7 8 9 10 11
0
2
4
# numerical simulation
K
2
[1/min]
Aver age
Aver age
Aver age
1 2 3 4 5 6 7 8 9 10 11
0
0.1
0.2
# numerical simulation
K
3
[1/min]
Average
Average
Average
1 2 3 4 5 6 7 8 9 10 11
0
0.005
0.01
# numerical simulation
K
4
[1/min]
Average
Aver age
Average
0 50 100 150
0
2
4
6
8
10
12
14
16
18
20
Reversion %
10
3
(K
3
+K
4
) [1/min]
10 20 30 40 50
1
2
3
4
5
6
7
(K
1
+K
2
) [1/min]
cure time [min]
SIMULTECH2014-4thInternationalConferenceonSimulationandModelingMethodologies,Technologiesand
Applications
146

sulphur cured natural rubber vulcanization kinetics.
Polym. Test., 32, 1052.
Milani, G., Milani F., 2014a. Fast and reliable meta-data
model for the mechanistic analysis of NR vulcanized
with sulphur. Polymer Testing, 33(1), 1.
Milani, G., Milani F., 2014b. Effective closed form
starting point determination for kinetic model
interpreting NR vulcanized with sulphur. Journal of
Mathematical Chemistry, 52(2), 464.
Sun, X., Isayev, A., 2009. Cure kinetics study of unfilled
and carbon black filled synthetic isoprene rubber.
Rubber Chem. Technol., 82(2), 149.
Westlinning, H., 1970. Vulcanization of Rubber with
Aminomercaptotriazines. Rubber Chem. Tech., 43,
1194.
SimplifiedClosedFormNumericalApproachestoPredictNaturalRubberBehaviorunderSulfurCuringinStandard
RheometerTests
147
