
Robust Multispectral Palmprint Identification System by Jointly Using
Contourlet Decomposition & Gabor Filter Response
Abdallah Meraoumia
1
, Salim Chitroub
2
and Ahmed Bouridane
3
1
Univ Ouargla, Fac. des nouvelles technologies de l’information et de la communication,
Lab. de G´enie
´
Electrique, Ouargla 30 000, Algeria
2
Signal and Image Processing Laboratory, Electronics and Computer Science Faculty, USTHB,
P.O. box 32, El Alia, Bab Ezzouar, 16111, Algiers, Algeria
3
Department of Computer Science and Digital Technologies, Northumbria University Newcastle,
Pandon Building, Newcastle upon Tyne NE2 1XE, U.K.
Keywords:
Biometrics, Identification, Multispectral Palmprint, Contourlet,
HMM
, Gabor Filter, Data Fusion.
Abstract:
In current society, reliable identification and verification of individuals are becoming more and more necessary
tasks for many fields, not only in police environment, but also in civilian applications, such as access control
or financial transactions. Biometric systems are used nowadays in these fields, offering greater convenience
and several advantages over traditional security methods based on something that you know (password) or
something that you have (keys). In this paper, we propose an efficient online personal identification system
based on Multi-Spectral Palmprint (
MSP
) images using Contourlet Transform (
CT
) and Gabor Filter (
GF
)
response. In this study, the spectrum image is characterized by the contourlet coefficients sub-bands. Then, we
use the Hidden Markov Model (
HMM
) for modeling the observation vector. In addition, the same spectrum
is filtered by the Gabor filter. The real and imaginary responses of the filtering image are used to create
another observation vector. Subsequently, the two sub-systems are integrated in order to construct an efficient
multi-modal identification system based on matching score level fusion. Our experimental results show the
effectiveness and reliability of the proposed method, which brings both high identification and accuracy rate.
1 INTRODUCTION
The automatic personal identification is becoming an
increasingly important requirement in a variety of ap-
plications like access control, surveillance systems
and physical buildings. In recent years, the use of
biometrics has been increasingly researched as an al-
ternative to traditional methods in the initial identifi-
cation procedure. Biometrics is an emerging field of
informationtechnologythat is crucial for humaniden-
tification and verification. Biometric technologies
measure and recognize human physical and behav-
ioral characteristics for identification purposes (Jin-
rong Cui, 2011). Some of the most common physical
characteristics include features extracted from hand
pattern. Furthermore, the palms of the human hands
contain a wide variety of features (e.g., shape, tex-
ture, and principal palm lines) that can be used by
biometric systems. These features of the human hand
are relatively stable and the hand image from which
feature are extracted can be acquired relatively eas-
ily (D. Zhang and Kumar, 2010). Therefore, in the
past few years, palmprint has attracted an increasing
amount of attention. In other hand, several studies for
palmprint-based personal identification systems have
focused on improving the performance of palmprint
images captured under visible light. However, dur-
ing the past few years, some researchers have con-
sidered multispectral images to improve the effect of
these systems. This technique can be give different
information from the same palmprint modality using
an acquisition device to capture the palmprint images
under visible and infrared light resulting into several
spectrum images (Cui, 2012).
In addition, several studies has demonstrated that
unimodal biometric identification (that is, identifica-
tion based on a single biometric characteristic) makes
it difficult for an impostor to impersonate a legitimate
user. More recent research is finding that multimodal
biometric identification (that is, identification based
on the combination of multiple algorithms) can make
it even more difficult for an impostor to impersonate
a legitimate user (A. Noore and Vatsa, 2007). Thus
multimodal biometrics claims improved accuracy and
190
Meraoumia A., Chitroub S. and Bouridane A..
Robust Multispectral Palmprint Identification System by Jointly Using Contourlet Decomposition & Gabor Filter Response.
DOI: 10.5220/0005016101900197
In Proceedings of the 11th International Conference on Security and Cryptography (SECRYPT-2014), pages 190-197
ISBN: 978-989-758-045-1
Copyright
c
2014 SCITEPRESS (Science and Technology Publications, Lda.)
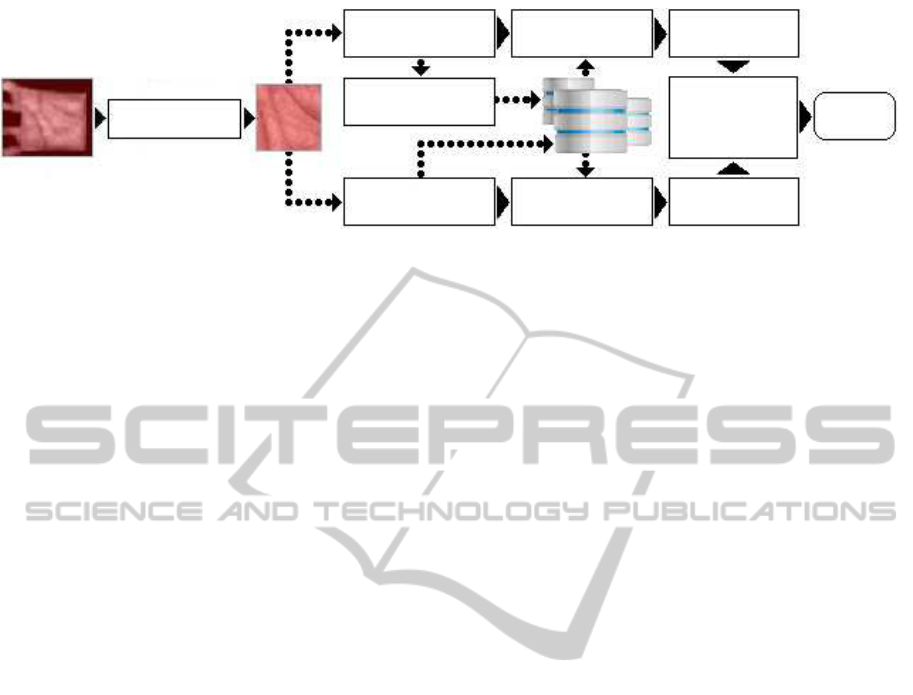
Figure 1: Multi-algorithmic palmprint identification system based on contourlet decomposition & gabor filter response.
Enrollment
Contourlet Log-likelihood Normalization
Preprocessing
HMM-Modeling
Fusion at
Database
Matching
Decision
Score level
Gabor Filter Hamming Normalization
robustness. In this paper, two palmprint identifica-
tion algorithms are proposed. Thus, we first propose
a multispectral palmprint identification based on sin-
gle spectrum. Further, the paper presents a method
for fusing information from the different spectrums
and algorithms. However, multimodal biometric sys-
tems can be designed to operate in one of the follow-
ing two scenarios, multiple units (Single biometric,
multiple units) and multiple algorithms (Single bio-
metric, multiple algorithms). The rest of the paper
is organized as follows. The proposed scheme of the
multimodal biometric system is presented in section
2. The two proposed systems framework (contourlet
based identification system and Gabor filter response
based identification system) are given in section 3.
The normalization and fusion process used for fus-
ing the information is detailed in section 4. In section
5, the experimental results, prior to fusion and after
fusion, are given and commented. Finally, the con-
clusions and further works are presented in sections
6.
2 PROPOSED IDENTIFICATION
SYSTEM
Fig. 1 illustrates the various modules of the proposed
multimodal biometric identification system based on
RED
spectrum (multi-algorithmic based multimodal
biometric identification system). The proposed sys-
tem is composed of two different unimodal sub-
systems exchanging information in matching score
level. Each sub-system exploits different algorithms
(
CT
and
GF
). The proposed multi-algorithmic based
multimodal identification system consists of pre-
processing process, matching process (log-likelihood
scores given each model for the first sub-system and
Hamming distance in the case of second sub-system),
normalization and decision process.
To enroll into the first sub-system database, the
user has to provide a set of training spectrums. Typ-
ically, an observation vector is extracted from each
spectrum which describes certain characteristics us-
ing
CT
technique and modeling using
HMM
. Finally,
the models parameters are stored as references mod-
els. For identification, the same observation vectors
are extracted from the test spectrum images and the
log-likelihood is computed using all of models refer-
ences in the database.
In the case of the second sub-system, a feature
vector is extracted from each spectrum image by us-
ing the 2D Gabor filter response and encoding step.
Then, the extracted feature vectors are stored as ref-
erence templates. For identification phase, the same
feature vectors are extracted from the test spectrum
images, then, the Hamming distance (matching mod-
ule,) is computed using all of reference templates in
the system database. For both sub-systems, and based
on the resulting fusion of the obtained normalized
matching scores, a decision of accepting or rejecting
the user is then made.
3 SYSTEMS FRAMEWORK
After the image is captured, it is pre-processed to ob-
tain only the area informationof each spectrum. In the
palmprint preprocessing, a Region Of Interest (
ROI
)
has to be located from the original spectrum image
before further feature extraction, using the method
described in (David Zhang and Zuo, 2010). In our
method, the features are generated by the
CT
and
GF
techniques.
3.1 Contourlet Based Identification
System
The spectrum image is typically analyzed using the
CT
method. Thus, to create an observation vector,
the spectrum image is transformed into a sub-bands
form (using
CT
into one level). Fig. 2 shows the
feature vector extraction methods using a contourlet
decomposition with one levels. The palmprint fea-
ture vectors (each spectrum) are created by combining
RobustMultispectralPalmprintIdentificationSystembyJointlyUsingContourletDecomposition&GaborFilterResponse
191

Figure 2: Observation vector generation using one level
contourlet decomposition. (left)
RED
spectrum image,
(middle) Input of
ROI
sub-image and (right) Feature vec-
tor extraction.
some bands extracted using contourlet decomposition
(Singh and Mishra, 2011). After that, this vector
is compressed using Principal Components Analysis
(
PCA
) method and some of principal components are
selected for representing the final observation vectors.
Finally, an
HMM
model of each observation vector is
constructed. Note that, in order to find the best pa-
rameters of the ergodic
HMM
model (Harun Uguz,
2007), we choose empirically the number of gaussian
in the Gaussian Mixture Model (
GMM
) equal to 1
and the number of states of the
HMM
equal to 6.
In the matchingprocess, after extracting the obser-
vation vectors corresponding to the test spectrum im-
age, the probability of the observation sequence given
a
HMM
model is computed via a viterbi recognizer.
The model with the highest log-likelihood is selected
and this model reveals the identity of the unknown
palmprint (person). Thus, during the identification
process, the characteristics of the test spectrum im-
age are extraction. Then the log-likelihood score of
the observation vectors, O
i
, given each model, λ
j
, is
computed. Therefore, the resulting score is given by:
d
L
ij
= P(O
i
|λ
j
) = ℓ(O
i
,λ
j
) (1)
where j =1··· N and N represents the size of model
database.
3.2 Gabor Based Identification System
In this system, the features are generated from the
ROI
sub-images by filtering the spectrum image with
2D Gabor filter (Angel Serrano, 2010). This feature
extraction technique has been widely used for pattern
recognition. Thus, the response of a Gabor filter to
an image is obtained by a 2D convolution operation.
Fig. 3 shows the feature vector extraction methods us-
ing a Gabor filter response at an orientation θ =
π
4
.
The M×M Gabor filter, M =16, at an orientation,
θ =
π
4
, will convolute with the
ROI
sub-images. The
results of a pair of a real and an imaginary filter are
combined in the Gabor phase response ϕ as follows:
ϕ
θ,µ,σ
= tan
−1
(
Im(S
θ,µ,σ
)
Re(S
θ,µ,σ
)
) (2)
The Gabor phase response is qualitatively en-
coded as “0” or “1” based on the sign. therefore, the
Figure 3: Observation vector generation using Gabor fil-
ter response. (left)
RED
spectrum image, (middle) Input of
ROI
sub-image and (right) Binary observation vector.
binary template, ψ(i, j), is represented by the follow-
ing inequalities :
ψ(i, j) =
0 if ϕ
θ,µ,σ
(i, j) < 0
1 if ϕ
θ,µ,σ
(i, j) ≥ 0
(3)
Note that, in the experiments, M, µ and σ are set
as 16, 0.0916 and 5.6179, respectively, are used in all
calculation.
The criterion for similarity/disimilarity is to min-
imize the distance between the input binary template
ψ
i
and the stored binary templates ψ
j
. The differ-
ence between the templates is labeled “Hamming Dis-
tance” (Xian-Qian Wu, 2003). A simple
XOR
op-
eration between the corresponding pair of templates
provides this Hamming distance. Hamming distance
does not measure the difference between the compo-
nents of the feature vectors, but the number of compo-
nents that differ in value. We can define the hamming
distance, d
H
, by the following formula:
d
H
ij
=
1
H
s
·W
s
n=H
s
∑
n=1
m=W
s
∑
m=1
ψ
i
(n,m) ⊕ ψ
j
(n,m) (4)
where j =1··· N and N represents the size of tem-
plate database. The ⊕ is the exclusive OR opera-
tor (
XOR
) and H
s
×W
s
is the size of the templates.
The value d
H
ij
lies between 0 and 1, inclusive, with 1
meaning that the two templates are independent and 0
meaning they are identical.
4 NORMALIZATION & FUSION
PROCESS
4.1 Normalization Process
During the identification process, two sub-systems are
used, a fusion sub-system will have to take into con-
sideration the fact that the scores to be combined are
of different types, e.g., a
CT
based sub-system which
outputs scores in the range [0, 10
4
], a
GF
based sub-
system which outputs scores in the range [0, 1]. In
this respect, the system outputs are mapped into a
common score representation (score normalization)
before they are combined. Thus, the matching score,
SECRYPT2014-InternationalConferenceonSecurityandCryptography
192

d, between the test spectrum image, and all of refer-
ence templates (models) in the system database are
computed, therefore the vector scores, V , given all
these distance is given as:
V = [d
1
d
2
d
3
d
4
·· · d
N
] (5)
where d
j
= d
L
j
or d
H
j
. An important aspect that has
to be addressed in identification process is the nor-
malization of the scores obtained. Thus, a Min-Max
normalization scheme was employed to transform the
scores computed into similarity scores in the same
range (Jinrong Cui, 2011).
e
V =
V −min(V )
max(V )− min(V )
(6)
where
e
V denotes the normalized scores. However,
these scores are compared, and the lowest/highest
score is selected. Therefore, the best score is D
o
and
its equal to:
D
o
=
(
max(
e
V ) for the first sub-system
min(
e
V ) for the second sub-system
(7)
Finally, this score is used for decision making. Not
that, for fusing the two sub-systems, it must convert-
ing the log-likelihood scores, d
L
j
, to another scores
(similar to the Hamming distance) by,
b
d
L
ij
= 1− d
L
ij
(8)
4.2 Fusion Process
There are several methods to combine multimodal in-
formation. These methods are known as fusion tech-
niques. Fusing information at the score level is in-
teresting because it reduces the problem complexity
by allowing different sub-systems to be used indepen-
dently of each other. However, in the multimodal sys-
tem design, these modalities operate independently
and their results are combined using an appropriate
fusion scheme. Thus, the fusion of the two sub-
systems is realized using five simple rules (Anil Jain,
2005). These rules consist of the sum (
SUM
) and
weighted-sum(
WHT
) of the two similarity measures,
their minimum (
MIN
) and maximum (
MAX
) of both
and finally their multiplication (
MUL
). The final de-
cision of the multimodal system is then given by
choosing the person, which minimizes the fused simi-
larity measures between the sample and the matching
base.
5 EXPERIMENTAL RESULTS
AND DISCUSSION
5.1 Experimental Database
The proposed methods are validated on multispectral
palmprint database from the Hong Kong polytech-
nic university (PolyU) (PolyU, ). The database con-
tains images captured with visible and infrared light.
Four spectrum images for each person, including Red,
Green, Blue and near-infrared spectrum (Fig. 4), are
collected. 6000 multispectral palmprint images were
collected from 500 persons. These images were col-
lected in two separate sessions. In each session, the
person provide 6 images for each palm, so thereare 12
images for each person. Therefore, 48 spectrum im-
ages of all illumination from 2 palms were collected
from each person. The average time interval between
the first and the second sessions was about 9 days.
Figure 4: Samples of multispectral palmprint.
5.2 Simulation Results
In the system-design phase (all experiments), three
images are randomly selected of twelve images of
each class (person) were used in the enrolment stage
to create the system database. In the following tests,
we setup a database with size of 400 classes, which
are similar to the number of employees in small to
medium sized companies. Thus, the client experi-
ments were performed by comparing nine test images
with the corresponding class in the database. A total
of 3600 comparisonsweremade. The impostor exper-
iments were performed by comparing the nine images
with each class in the database. A total of 718200 im-
postor experiments were made
5.2.1 Unimodal Identification Systems
GF Based Identification System The goal of this
experiment was to evaluate the system performance
when we using information from each spectrum with
GF
algorithm. For the open set identification, we
found the performance under different spectrums
(Red, Green, Blue, Near-infrared). By adjusting the
matching threshold, a Receiver Operating Character-
istic (
ROC
) curve, whichis a plot of False Reject Rate
RobustMultispectralPalmprintIdentificationSystembyJointlyUsingContourletDecomposition&GaborFilterResponse
193
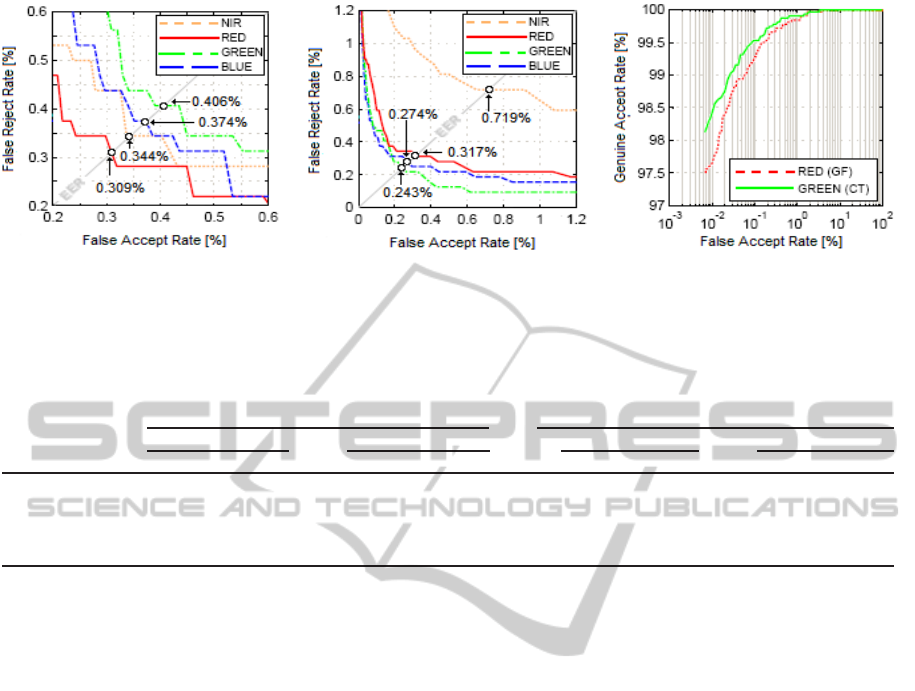
(a) (b) (c)
Figure 5: Unimodal identification system performance. (a) The
ROC
curves with respect to the different spectrums, using
Gabor filter response, (b) The
ROC
curves with respect to the different spectrums, using contourlet decomposition and (c)
Comparison between the best systems.
Table 1: Unimodal Identification Systems Test Results.
RULE
OPEN SET IDENTIFICATION PERFORMANCES CLOSED SET IDENTIFICATION PERFORMANCES
GF CT GF CT
T
o
EER T
o
EER ROR RPR ROR RPR
RED 0.2583 0.309 0.9154 0.317 98.000 107 97.656 341
GREEN 0.2642 0.406 0.9173 0.243 96.500 118 98.219 240
BLUE 0.2490 0.374 0.9173 0.274 96.469 94 98.063 78
NIR 0.2896 0.344 0.8905 0.719 97.438 137 96.813 271
(
FRR
) against False Accept Rate (
FAR
) for all pos-
sible thresholds, can be created. Fig. 5.(a) compares
the performance of the system for varying spectrum
types. FromFig. 5.(a) it can be seen that theRed spec-
trum perform better than the other spectrums in terms
of Equal Error Rate (
EER
). Thus, the
GF
based uni-
modal open set identification system can be work with
a minimum error,
EER
, equal to 0.3091% at a thresh-
old T
o
= 0.2583. Finally, Table 1 (first line) illustrates
the experimental results for all spectrum images.
For the evaluation of the closed set identification
system performance, Table 1 (first line) presents the
average identification results for all spectrums. From
this Table, it can be seen that always the Red spectrum
offers the best identification rate with a Rank-One
Recognition (
ROR
) equal to 98.000 % and a Rank
of Perfect Recognition (
RPR
) of 107.
CT Based Identification System In this section,
we performed a simulation using the experimental
settings as before but this time, we varied the feature
extraction technique (by using
CT
). Therefore, as
mentioned above, the observation vector is composed
of
PCA
features extracted from the transformed spec-
trum image columns. Thus, as know, the principal
component vectors reflect the compact information of
different column vectors. Most of these vectors they
become negligible, as result; the vector derived from
the initial vectors computation is limited to an array
of summed vectors within all components. The test
was repeated for various numbers of components,
only 64 component (99.956 % of the total informa-
tion) are enough to achieve good identification rate.
So, we conducted several experiments to investigate
the effectiveness of the spectrum types (choose the
spectrum type yield the best performance). For this,
we found the performance under different spectrums
and the results are illustrated in Fig. 5.(b). The
obtained experimental results show that this open
set identification sub-system works best using Green
spectrum with an
EER
equal to 0.2430 % at T
o
=
0.9173. The results for all spectrum images are
shown in Table 1.
The closed set identification sub-system are
shown in Table 1. As can be observed, Green
spectrum give the best identification rate (
ROR
=
98.2188 and
RPR
= 240). Finally, to find the better
open set identification systems, graphs showing the
ROC
curves for the open set identification using
GF
and
CT
based unimodal systems, were generated
(see Fig. 5.(c)). By the analysis of this plot, it can be
observed that the performance of the unimodal open
set identification system is significantly improved by
using the
CT
method.
SECRYPT2014-InternationalConferenceonSecurityandCryptography
194
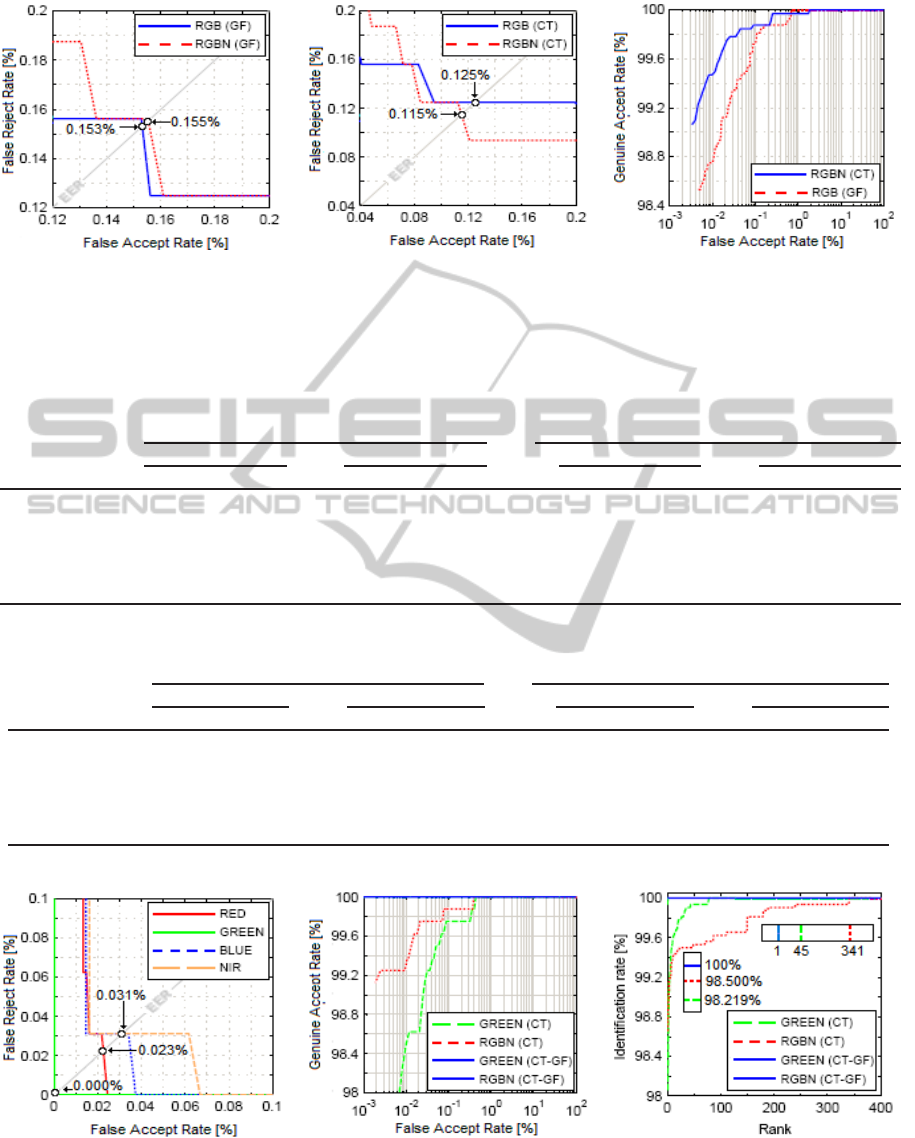
(a) (b) (c)
Figure 6: Multiple-units based multiimodal identification system performance. (a) The
ROC
curves with respect to the two
combinations (
RGB
and
RGBN
), using Gabor filter response, (b) The
ROC
curves with respect to the two combinations
(
RGB
and
RGBN
), using contourlet decomposition and (c) Comparison between the best systems.
Table 2: Mult-units Based Multimodal Identification Systems Test Results (Open Set Identification).
RULE
RGB RGBN
GF CT GF CT
T
o
EER T
o
EER T
o
EER T
o
EER
SUM 0.2583 0.153 0.9151 0.125 0.2521 0.155 0.8990 0.115
WHT 0.2573 0.156 0.9164 0.125 0.2503 0.156 0.9060 0.125
MUL 0.0180 0.156 0.7942 0.125 0.0042 0.162 0.7087 0.125
MAX 0.3224 0.189 0.9455 0.125 0.3367 0.219 0.9483 0.125
MIN 0.1988 0.250 0.8981 0.168 0.1950 0.281 0.8727 0.219
Table 3: Mult-units Based Multimodal Identification Systems Test Results (Closed Set Identification).
RULE
RGB RGBN
GF CT GF CT
ROR RPR ROR RPR ROR RPR ROR RPR
SUM 98.500 35 98.875 341 98.500 45 99.031 192
WHT 98.438 35 98.688 341 98.500 45 98.625 341
MUL 97.125 37 98.656 341 96.844 43 98.656 341
MAX 98.281 89 98.188 130 98.438 83 97.531 145
MIN 97.125 85 98.656 341 96.844 68 98.656 191
(a) (b) (c)
Figure 7: Multiple-algorithms based multiimodal identification system performance. (a) The
ROC
curves with respect to the
different spectrums, (b) The
ROC
curves, which is a plot of
GAR
against
FAR
, for all best systems and (c) The
CMC
curves
for all best systems.
RobustMultispectralPalmprintIdentificationSystembyJointlyUsingContourletDecomposition&GaborFilterResponse
195

Table 4: Mult-algorithms Based Multimodal Identification Systems Test Results (Open Set Identification).
RULE
RED GREEN BLUE NIR
T
o
EER T
o
EER T
o
EER T
o
EER
SUM 0.6930 0.344 0.8863 0.014 0.8262 0.044 0.7205 0.188
WHT 0.6919 0.344
0.9930 0.000 0.8300 0.031 0.7164 0.188
MUL 0.5332 0.344 0.7677 0.029 0.7076 0.059 0.5771 0.188
MAX 0.9832 0.023 0.9751 0.031 0.9749 0.031 0.9789 0.031
MIN 0.7876 0.079 0.7989 0.103 0.8115 0.094 0.8011 0.095
Table 5: Mult-algorithms Based Multimodal Identification Systems Test Results (Close Set Identification).
RULE
RED GREEN BLUE NIR
ROR RPR ROR RPR ROR RPR ROR RPR
SUM 99.250 341 99.625 8 99.625 240 98.969 180
WHT 99.250 341
99.938 2 99.906 240 99.563 180
MUL 99.250 341 99.594 3 99.594 240 99.500 180
MAX 98.156 5 97.375 4 97.531 6 98.125 6
MIN 99.469 9 99.156 81 99.438 3 99.313 68
Table 6: Multimodal Identification Systems Using Jointly Mult-units and Mult-algorithms Methods.
RULE
OPEN SET IDENTIFICATION PERFORMANCES CLOSED SET IDENTIFICATION PERFORMANCES
RGB RGBN RGB RGBN
T
o
EER T
o
EER ROR RPR ROR RPR
SUM 0.000 0.9796 0.000 0.9607 100.00 1 100.00 1
WHT 0.000 0.9960 0.000 0.9990 99.938 2 100.00 1
MUL 0.000 0.9558 0.000 0.8000 100.00 1 100.00 1
MAX 0.027 0.9990 0.042 0.9990 96.688 4 95.781 4
MIN 0.000 0.9614 0.000 0.9245 100.00 1 100.00 1
5.2.2 Multimodal Identification Systems
These experiments can be divided into three cate-
gories: (i) multiple-units (Single biometric, multi-
ple units), (ii) multiple-algorithms (Single biomet-
ric, multiple algorithms) and (iii) multiple-units-
algorithms (Single biometric, multiple units and mul-
tiple algorithms).
In order to see the performance of the open/closed
set multimodal identification system, case of (i)
multiple-units, we present, in table 2 and 3, the re-
sults for all combinations (
RGB
and
RGBN
) and fu-
sion rules for the two feature extraction methods (
GF
and
CT
). These two tables shows that the
SUM
rule
with
CT
method and
RGBN
combination offers bet-
ter results in terms of the
EER
and
ROR
, for the
both identification modes (open/closed set). Fig. 6.(a)
and Fig. 6.(b) compares the performance of
RGB
and
RGBN
combinationsin the case of
GF
and
CT
meth-
ods, respectively. While, Fig. 6.(c) compares the two
best open set identification systems, from this fig-
ure, it is clear that the system can works efficiency
with the fusion of all spectrums (
RGBN
combina-
tion) with
SUM
rule in the case of
CT
method with
EER
= 0.1151 % at T
o
= 0.8990. In the case of (ii)
multiple-algorithms, the individual scores for
GF
and
CT
based systems are combined to generate a single
scalar score, which is then used to make the final deci-
sion. Fig. 7.(a) provides the performance of the open
set identification system for all spectrum types and fu-
sion rules. From this figure, it is clear that our open
set identification system achieves a best performance
when using the Green spectrum and
WHT
fusion rule
of the two sub-systems (
EER
= 0.0000 % and T
o
=
0.9930). These setting (Green spectrum and
WHT
fusion rule) always give the best performance in the
closed set identification mode (
ROR
= 99.9375% and
RPR
= 2). Finally, Table 4 and 5 done all the experi-
mental results for all spectrum types and fusion rules.
To validate our idea we have run other tests for
the case of (iii) multiple-units-algorithms. Thus, to
determine the best combination and fusion rule, a ta-
ble contains the results can be established (see Ta-
ble 6). The experiments described in table 6 sug-
gest that generally all fusion rules, except the
MAX
rule, give a better open set identification performance
(zeroEER) for both combinations (
RGB
and
RGBN
).
For the closed set identification system, the best re-
SECRYPT2014-InternationalConferenceonSecurityandCryptography
196

sult of
ROR
is given as 100.000 % with lowest
RPR
of 1. Not that, the average increase in performance
between the unimodal open/closed set identification
system and the multimodal open/closed set identifica-
tion system is 100 %.
5.2.3 Comparison Study
This section is dedicated to compare the performance
of the best open/closed set identification systems de-
scribed above, this can be done by showing the
ROC
curves for the open set identification using unimodal
and multimodal systems (see Fig. 7.(b)). As can be
seen by comparing these results, the accuracy of the
system using Green spectrum and the system based
on the fusion of all spectrum types (both based on the
fusion of the
GF
based sub-system and
CT
based sub-
system) is very much increased and can achieve ze-
roEER. Also, the Cumulative Match Curves (
CMC
)
comparing all best closed set identification systems
are plotted in Fig. 7.(c). From this figure, always,
Green spectrum and the system based on the fusion
of all spectrum types (both based on the fusion of the
GF
based sub-system and
CT
based sub-system) give
the best accuracy (
ROR
= 100 %). Through an anal-
ysis of the previous results, it can be observed that
in general the performance of the unimodal system is
significantly improved by using the fusion of several
spectrum types. In addition, experimentsalso demon-
strate that fusion of the two algorithms performs bet-
ter results.
6 CONCLUSION AND FURTHER
WORK
The objective of this work is to contribute to the
multimodal identification by the use of data fusion
technique. Two different sub-systems derived from
each spectrum were used in this study. Fusion of the
two proposed unimodal sub-systems is performed at
the matching score level to generate a fused match-
ing score which is used for recognizing a palm-
print image. Feature extraction process use both
GF
and
CT
methods. The experimental results, ob-
tained on a database of 400 persons, show a very
high open/closed set identification accuracy. They
also demonstrate that combining different spectrum
types or different algorithms does significantly re-
duce the accuracy of the system. In addition, our
tests show that the multimodal system provides better
open/closed set identification accuracy than the best
unimodal systems. For further improvement, our fu-
ture work will project to use other biometric modali-
ties (Face and Iris) as well as the use of other fusion
level like feature and decision levels. Also we will
focus on the performance evaluation in both phases
(verification and identification) by using a large size
database.
REFERENCES
A. Noore, R. S. and Vatsa, M. (2007). Robust memory-
efficient data level information fusion of multi-modal
biometric images. In Information Fusion. Vol. 8, No.
4, pp. 337-346.
Angel Serrano, Isaac Martyn de Diego, C. C. E. C.
(2010). Recent advances in face biometrics with gabor
wavelets: A review. In Pattern Recognition Letters.
Vol 31, pp. 372-381.
Anil Jain, Karthik Nandakumar, A. R. (2005). Score nor-
malization in multimodal biometric systems. In Pat-
tern Recognition. Vol. 38, pp. 2270-2285.
Cui, J.-R. (2012). Multispectral palmprint recognition us-
ing image based linear discriminant analysis. In In-
ternational Journal of Biometrics. Vol. 4, No. 2, pp.
106-115.
D. Zhang, V. Kanhangad, N. L. and Kumar, A. (2010). Ro-
bust palmprint verification using 2d and 3d features.
In Pattern Recognition. Vol 43, No. 1, pp. 358-368.
DavidZhang, Zhenhua Guo, G. L. L. Z. and Zuo, W. (2010).
An online system of multispectral palmprint verifica-
tion. In IEEE Transactions on Instrumentation and
Measurement. Vol. 59, No. 2,pp. 480-490.
Harun Uguz, Ahmet Arslan, I. T. (2007). A biomedical
system based on hidden markov model for diagnosis
of the heart valve diseases. In Pattern Recognition
Letters. Vol 28, pp. 395-404.
Jinrong Cui, Y. X. (2011). Three dimensional palmprint
recognition using linear discriminant analysis method.
In International Conference on Innovations in Bio-
inspired Computing and Applications. pp.107-111.
PolyU. The hong kong polytechnic university multispectral
palmprint database. www.comp.polyu.edu.hk/ bio-
metrics/MultispectralPalmprint/MSP.htm.
Singh, A. P. and Mishra, A. (2011). Image de-noising using
contoulets (a comparative study with wavelets). In Int.
J. Advanced Networking and Applications. Vol. 03, Is-
sue 03, pp. 1210-1214.
Xian-Qian Wu, Kuan-Quan Wang, D. Z. (2003). Palmprint
recognition using fishers linear discruminant. In Inter-
national Conference on Machine Learning and Cybe-
medcs.
RobustMultispectralPalmprintIdentificationSystembyJointlyUsingContourletDecomposition&GaborFilterResponse
197
