
Research of Cable Identification Method
Based on Single Fiber
Qiang Sun and Qifu Wu
School of Electronics and Information Engineering , Beijing Jiaotong University, Beijing, China
Keywords: Interference, Redundant Fiber, Phase Difference.
Abstract: Optical cable identification plays a very important role in cable maintenance and fault detection. In this paper,
a new cable identification method based on optical fiber end reflection is proposed. Based on the theory of
optical fiber sensor and phase modulation technology, single fiber optical cable identification is effectively
achieved. System composition of this method is introduced in this paper. According to light interference
principle, the expression of phase change when signal acts on fiber sensor is deduced; the relationship
between redundant optical fiber and the system output signal is analyzed. The reasonable redundant fiber
length is obtained by Matlab simulation, and the feasibility of the method is verified by experiment.
Compared with other cable identification method, experimental results show that the single fiber optical cable
identification has greatly improved in detection sensitivity and low maintenance time and costs.
1 INTRODUCTION
With the rapid development of optical fiber
communication technology, it has become an
important platform of much information, such as
voice, data and images (Tan et al., 2006). As a basic
transmission carrier of optical communication
network, the optical cable has almost covered the
major national backbone network. The portion of the
cable label begins to blur, even to drop off with the
time going on (Huang et al., 2007). So when optical
cable has fault, it is a difficult work to identify the
target cable quickly and easily (Yao and Zhang,
2008; Leonowicz et al., 2006). Based on optical
fiber end face reflection, this paper proposed a new
cable single fiber identification method according to
the characteristics of the optical signal interference.
This method achieves cable single fiber
identification with fast response and has the same
accuracy in the entire measuring range.
There are mainly three kinds of cable
identification methods at present, including artificial
pulling, optical power test, and dual fiber optic cable
identification. Artificial pulling method is pulling
the cable directly to identify the fiber optical cable
along the damage locations by the maintenance
workers. This method is very clumsy and consumes
long time. Optical power test method is receiving
end of the fiber optical power changes by real-time
monitoring to achieve the object of identifying
cable. This method is not accurate positioning and
low accuracy. Dual fiber optic cable identification
method (Sun and Chen, 2011) has high detection
accuracy, but this method requires the double fiber
loop, which cannot identify the only one dark fiber
of the cable.
In this paper, a new cable identification method
is proposed based on single fiber. This method will
not damage to the cables, and high detection
sensitivity, greatly reduce the fiber optic network
management, repair and maintenance time and costs.
Users can easily find the object cable by knocking
the optical cable.
2 SYSTEM COMPONENTS OF
CABLE SINGLE FIBER
IDENTIFICATION
As is shown in Figure 1, the principle of single fiber
identification system is light emitting from the light
source via the coupler 1 divided into two paths. The
first light reaches to coupler 2 directly, and then
reaches reflection face via the sensor fiber, after
reflection, reaches coupler 1 all the way through
sensor fiber, coupler 2, and redundant fiber. The
45
Sun Q. and Wu Q..
Research of Cable Identification Method Based on Single Fiber.
DOI: 10.5220/0005022500450050
In Proceedings of the 5th International Conference on Optical Communication Systems (OPTICS-2014), pages 45-50
ISBN: 978-989-758-044-4
Copyright
c
2014 SCITEPRESS (Science and Technology Publications, Lda.)

other light reaches coupler 1 directly without passing
through redundant fiber. The second light reaches
coupler 2 by passing through redundant fiber, and
after being reflected by end face, is also divided into
two paths of light, so the system has four optical
paths:
Path 1: (a—b—c—b—d);
Path 2:(d—b—c—b—a);
Path 3:(a—b—c—b—a);
Path 4:(d—b—c—b—d);
The optical path difference between paths 1 and
2 is zero. These two lights will intervene after
encounter in coupler1. Path 3 and path 4 does not
satisfy the condition of zero optical path difference,
so the interference does not occur.
Figure 1: Single fiber cable identification system.
Therefore, when the external signal is acting on
the fiber sensor, it will lead to changes of the phase
shift of paths 1 and 2, produce a phase difference.
The output expressions are,
110 1 1
exp{ [ ( ) ]}
c
EE jt t
(1)
220 2 2
exp{ [ ( ) ]}
c
EE jt t
(2)
Where,
10 20
EE is the electric field amplitudes,
c
is optical carrier frequency,
1
and
2
are the initial
phase, (the initial phase of 2×2 coupler’s output)
[6-7]
,
1
()t
and
2
()t
are phase changes after two lights
being modulated by knocking signal. The output
expression of the total light intensity reaching the
photoelectric detector is,
** *
1212 3344
()()++
I
EEEE EEEE
(3)
Where
3
E ,
4
E are electric field amplitudes of path 3
and path 4.
According to equation (1)-(3), it can be deduced
as,
2*
10 1 2
22
10 10 1 2
42Re()
4 2 cos[ () ()]
IE EE
E
Ett
(4)
Therefore, when the external signal is acting on
the fiber sensor, the optical phase difference change
causes the interference fringes change. The external
signal can be demodulated through the signal
processing module, and enable to identify the target
cable.
3 OPTICAL CABLE
IDENTIFICATION PRESSURE
AND PHASE ANALYSIS
COPYRIGHT FORM
Figure 2 shows a fiber sensor expand schematic.
Assuming that the optical fiber length is L ,
knocking signal is acting on the fiber sensor, its
length is
s
L . The expression of external signal for
the fiber sensor is
0
sin( )
s
pp t
.
0
p
is external
signal amplitude,
s
is external signal angular
frequency.
Figure 2: Fiber sensor expand schematic.
When knocking signal is acting on the fiber
sensor, the phase change on any length
l
optical
fiber is,
0
s
l
llnla
ln a
(5)
Where
0
is light waves in optical fiber transmission
constant,
n
is fiber refractive coefficient,
l
is light
waves that spread of optical fiber length,
0
l
l
l
is
the phase influence of tiny changes caused by strain.
According to the theory of elastic mechanic (Wang
et al., 2007), it can be deduced as,
00
z
ll
(6)
OPTICS2014-InternationalConferenceonOpticalCommunicationSystems
46

Where,
ln
n
is the influence on phase of
0
changes, which is caused by optical fiber refractive
coefficient changes through photo elastic effect,
la
a
is waveguide effect, phase change caused
by the change of the fiber core , which can be
negligible.
According to the theory of elastic mechanic
[9-10]
,
it can be obtained,
0
** * sin( )*
ss
p
dl p t dl
(7)
3
11 12
1
(1 2 )( 2 ) /
2
kn p p E
(8)
Where,
k
is the number of waves of light in a
vacuum,
is the Poisson constant of the fiber,
11
p
and
12
p
are elastic tensor component, E is the
elastic modulus of the optical fiber.
According to equation (5) – (8) it can be
deduced as,
00
*sin()*
zs
lptdl
(9)
Figure 3 plotted the light path of the single fiber
cable identification system. The spread of the light
will be modulated and cause phase change when
knocking signal is acting on the coherence light of
path 1 and 2.
Figure 3: The light path of the single fiber cable
identification system.
According to equation (9) it can be deduced as,
(t)=
10 0
00
01 2
0
**{sin( )sin( )}
s
s
LL
z
L
ss
dl dl
p
ttdl
(10)
Where
1
()
ab
nl l
c
is the transition time when
light transits from a point to knocking point p by
point d and point b.
2
(2)
ab c
nl l l
c
is the transition time when light
transits from a point to end face and then reflected to
the knocking point p through point d and point b.
(t)=
20 0
00
03 4
0
**{sin( )sin( )}
s
s
LL
z
L
ss
dl dl
pt tdl
(11
)
3
()
bad
nl l l
c
is the transition time when light
transits from point a to knocking point p by point e
and point b.
4
(2)
ba cd
nl l l l
c
is the transition time when
light transits from point a to end face and then
reflected to the knocking point p through point e and
point b.
According to equation (10) and (11), after two
beams of coherent light modulate, the phase
difference can be obtained,
t)=
012
0
34
({**{[sin()sin()]
[sin ( ) sin ( )]}}
s
L
ss
ss
pt t
ttdl
(12)
According to equation (12), the following
equation can be obtained,
4sin()cos( )cos( )
22
dx
aaaa
t
(t )
(13)
3
11 12 0
1
(1 2 )( 2 ) /
2
s
kn p p p L E
(14)
Combined equation (4) and (13), photoelectric
detector output signal can be deduced as,
22
11
4 2 cos[4 sin( ) cos( ) cos ( )]
22
dx
aaaa
IE E t
(15)
Where
34 12
[( ) ( )] / 2
d
is the transition
time, when light goes through the redundant optical
fiber;
43 21
[( ) ( )]/ 4
a
is the transition time
when light is reflected from knocking point p to
reflection end face;
23x
is the transition
time when light goes from path 1 to path 4.
According to equation (15), it can be found that
sin( )
2
d
a
will affect the sensor's optical signal-
ResearchofCableIdentificationMethodBasedonSingleFiber
47
to-noise ratio. The system output signal is weak
when it is small. Therefore, it is critical to choose
the appropriate redundant optical fiber length to
improve the optical signal-to-noise ratio of the
system.
4 ANALYSIS LENGTH OF
REDUNDANT FIBER
According to (15), the output light intensity of the
system
I
changes with
(t)
periodically. When
k
(t )=( 2 +1)
0,1....kN
, the output light
intensity reaches to maximum value. As we all
known that the frequency of knocking signal ranges
from 1.4KHz to 2.6KHz and the length of the tested
cable is in the kilometer magnitude, so
cos( ) cos ( ) 1
2
x
aa a
t
where
(t )
is
determined by
sin( )
2
d
a
. In real knocking
process, phase shift caused by knocking signal
equals to approximately
8
(Liu et al., 2004), so it
can be known that the relationship between the
length of redundant fiber and the system output by
simulation.
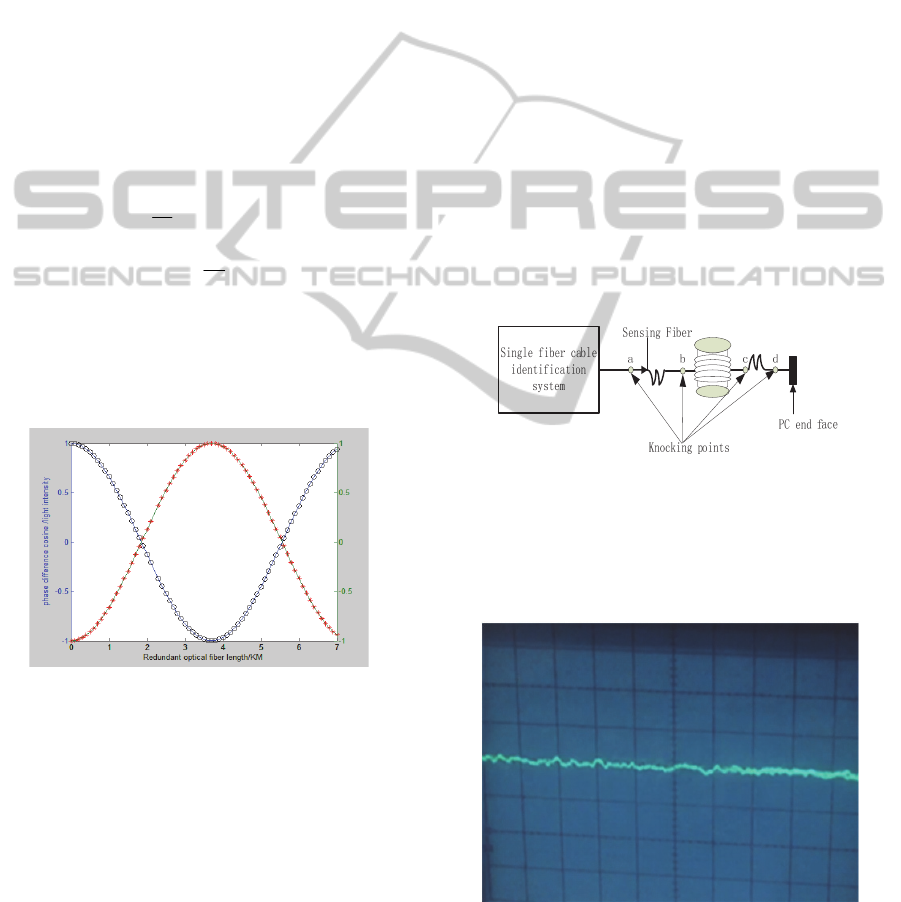
Figure 4: Phase difference cosine /light intensity values of
different redundant fiber.
In Figure 4, it can be seen
cos[ ( )]t
(black
curve) and light intensity
I
(red curve) changes
periodically with the length variation of redundant
fiber (Equation (4) shows an inverse relationship
between these two variables). It can be found that
the system output signal amplitude of different
redundant fibers.
Based on the analysis results, the system light
intensity output will reach to the maximum when the
length of redundant fiber is in the range from 3.7 to
4.3km. Therefore, redundant fiber length can be
selected within this range.
5 EXPERIMENTAL ANALYSIS
5.1 Simulation Test
Due to PC connectors reflection loss is the largest, it
can be selected as the reflection end face. PC
reflection loss is 18
dB
, two coupler loss are 6
dB
,
4km redundant fiber loss is measured as 0.8
dB
, and
optical fiber connection loss is 1.5
dB
. So the loss of
whole light path is,
18 2*3 0.8 0.3*5 26.3dB
loss
p
(16)
In the experiment of cable single fiber
identification, the maximum laser luminous power is
1
dBm
, detector sensitivity is -46
dBm
, and the fiber
loss in the engineering is 0.25
dB/km
. So the cable
length can be identified in this system,
[ 1 ( 46) 24.8] / (2 *0.25) 40kml
(17)
Figure 5 shows the simulated test platform.
Figure 5: Simulated test platform.
In the experiment, select a, b, c, d four knocking
points, and observe the output light intensity signal
waves. Signal waveforms are plotted in figure 6 and
figure 7.
Figure 6: Background noise signal waveform.
OPTICS2014-InternationalConferenceonOpticalCommunicationSystems
48
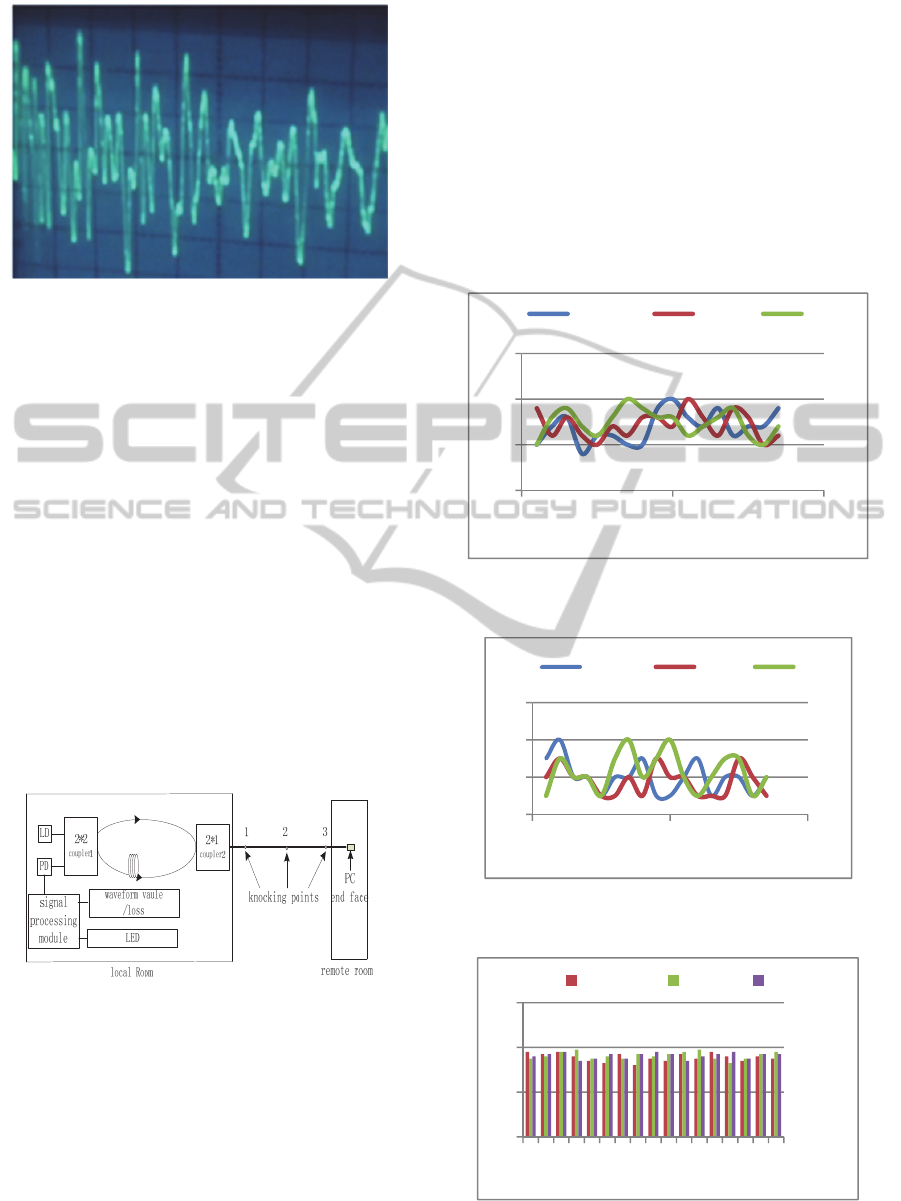
Figure 7: Knocking signal waveform.
As can be seen from figure 6 and figure 7, when
knocking on one of a, b, c, d points, the signal
amplitude is larger than the background noise signal
obviously. Therefore the object cable can be
identified through the detected knocking signals.
The identified distance can reach to 40km, which
can satisfy the practical requirements.
5.2 Field Test
The experiment was carried on the transmission
cable of the China Unicom in Shandong; put the
single fiber cable identification system on the local
working room, and connect the dark fiber of the
object cable. Disconnect the other end dark fiber of
object cable with connector of equipment in remote
working room so as to be convenient for the sensing
signal reflection. The optical cable field test
platform is shown in figure 8:
Figure 8: Field test platform.
We knock the near end 1, middle 2 and far end 3
in the transmission cable. Waveform value
represents the voltage of PD detection. LED counts
represent the receiving
audio signal strength of system.
The test results are shown in figure 9-12.
It can be measured that the length of the cable is
29 km by using OTDR. The cable loss is 0.25
km/dB according to the requirement of engineering,
so the cable loss is 7.25 dB, the cable loss of the
single fiber optic cable identification system is 7 dB,
which is close to the theoretical value 7.25 dB,
When knocking the near end, middle and far end of
the object optical cable, waveform value is close to a
maximum of PD detection 5V, and we can clearly
hear hammering at the same time. When knocking
on the neighbouring cable, we can't hear the
hammering, because of the disturbance of the noise,
so there is a small waveform value.
From test results, we can find that the single fiber
optical cable identification system can effectively
identify the object optical cable.
Figure 9: Waveform value when knocking the object
optical cable.
Figure 10: Waveform value when knocking the
neighbouring optical cable.
Figure 11: Audio signal strength when knocking the object
optical cable.
4
4,5
5
5,5
01020
waveform
value/V
sampling point
nearend middle farend
0
0,2
0,4
0,6
01020
waveform
value/V
sampling point
nearend middle farend
0
20
40
60
1357911131517
LED count
sampling point
nearend middle farend
ResearchofCableIdentificationMethodBasedonSingleFiber
49

Figure 12: Audio signal strength when knocking the
neighbouring optical cable.
6 CONCLUSION
This paper proposed the single fiber optical cable
identification method. It has greatly improved
compared with other methods in high detection
sensitivity and low maintenance time and costs.
Users can easily find the target cable by knocking
the optical cable.
Based on the theory of light interference, this
paper analyzed the system structure and basic
principle of the method, derived the external signal
and the phase change caused by the sensing optical
fiber, got the proper redundant optical fiber length
through Matlab simulation analysis, solved the key
issues of single cable identification. Simulated test
platform is set up in the laboratory; The loss of
reflection face is measured; The maximum length of
cable identification is calculated. Finally it versified
the feasibility of this method by field test and data
analysis.
REFERENCES
Jing Tan, Weiming Chen, Yong Zhu and Ding Wang,
2006. Single Distributed Optical Fiber Sensor pipeline
leak detection methods and positioning theoretical
analysis, ACTA PHOTONICA SINICA, 35(2):228-
231.
Shi Chu Huang, Wu Wen Lin, Meng Tsan Tsai and Mao
Hsiung Chen, 2007. Fiber optic in-line distributed
sensor for detection and localization of the pipeline
leaks,. Sensors and Actuators A, vol. 135, lop. 570-
579.
Jianyong Yao and Sen Zhang, 2008. Fiber Mach-Zehnder
Interferometer system, University Physics.
Lobos T., Leonowicz Z, Rezmer J. and Schegner P., 2006.
High-resolution spectrum-estimation methods for
signal analysis in power system, IEEE Trans. On
Instrumentation and Measurement.
Jing-hua Sun and Cong Chen, 2011. Lossless Cable
Identification Method Based on White
‐
light
Interference, Chinese Journal of Lumine-scence,
32(5), 493-498.
Huang Junhua, Zhang Zhong, Xu Jun, et a1., 2009.
Recognition of land based communication optical
cable based on radio-frequency. In CHN,CN2012-
33462.
Dongming Xia, Shuqin Lou, Xiaodong Wen and Muqun
Li, 2011. Research on fiber optic interferometric
phase carrier demodulation techniques, Electro-Optic
Technology Application, (5).
Zhefeng Wang, Hong Luo, Shuidong Xiong, Ming Ni and
Yongming Hu, 2007. A J0-J1 method for
interferometric fiber sensor dynamic phase shift
measure, Chinese Journal of Lasers, (1).
K. N. Joo and S. W. Kim, 2007. Refractive index
measurement by spectrally resolved interferometry
using a femtosecond pulse laser, Optics Letters,
32(6):1532-1537.
Sandeep Vohra, et al., 2000. Distributed Strain Monitoring
with Arrays of Fiber Bragg Grating Sensors on an In-
Construction Steel Box-Girder Bridge. In IEICE
Trans. Electron., E83-C(3).
Bo Liu, Yifei Yang, Wencheng Niu, Guiyun Kai, Weigang
Zhang, 2004. Fiber fence technical characteristics and
research status, Photon Technology, (4).
0
0,5
1
1,5
2
2,5
3
3,5
4
1 3 5 7 9 11131517
LED count
sampling point
nearend middle farend
OPTICS2014-InternationalConferenceonOpticalCommunicationSystems
50
