
Methods and Algorithms of Cluster Analysis in the Mining Industry
Solution of Tasks for Mineral Rocks Recognition
Olga E. Baklanova
1
and Olga Ya Shvets
2
1
Department of Mathematical and Computer Modelling, D.Serikbayev East-Kazakhstan State Technical University,
19, Serikbaeva Street, Ust-Kamenogorsk, The Republic Kazakhstan
2
Department of Instrument Engineering and Technology Automation, D.Serikbayev East-Kazakhstan State Technical
University, 19, Serikbaeva Street, Ust-Kamenogorsk, The Republic Kazakhstan
Keywords: Cluster Analysis, Mineral Rocks, Pattern Recognition, Segmentation of Colour Images, Colour Space HSV,
Mining Industry.
Abstract: It is described the algorithm for automatic segmentation of colour images of ores, using the methods of
cluster analysis. There are some examples illustrated using of the algorithm in the solving of mineral rock
recognition problems. Results of studies are demonstrated different colour spaces by k-means clustering. It
was supposed the technique of pre- computing the values of the centroids. There is formulas translation
metrics colour space HSV. The effectiveness of the proposed method lies in the automatic identification of
interest objects on the total image, tuning parameters of the algorithm is a number that indicates the amount
allocated to the segments. This paper contains short description of cluster analysis algorithm for the mineral
rock recognition in the mining industry.
1 INTRODUCTION
Petrography is the science studies the material
composition of the rocks. Unlike minerals, rocks are
aggregates composed of different minerals (Harvey
and Tracy, 1995).
Knowledge of the modal composition of the rock
or ore is very important for solving the
mineralogical and technological issues (Baklanova,
2013).
Today, in the analysis of rocks are widely used
both traditional and modern mineralogical and
analytical techniques: optical and electron
microscopy, X-ray diffraction, electron microprobe,
and elemental analyses, and the methods are widely
involved studying the physical properties of
minerals (Clarke and Eberhardt, 2002).
Minerals called homogeneous in composition
and structure of the rocks and ores. They are natural
chemical compounds resulting from various
geological processes. Historically, the minerals
initially determined by color and shape (Chris,
2002).
Reliability of research depends on several factors
(Farndon, 2006):
- Natural mineral color variations;
- Structure errors in measurement technology of
color parameters of the mineral;
- Errors in measurement and control standards
and control techniques for measuring color
diagnostic indicators;
- Uncertainty normative values in the system of
quantifying color diagnostic indicators.
Accuracy of control, diagnosis and decision-
making system in the petrography analysis can be
enhanced by the presence of a database with
information on the location of the test sample rocks,
geological landscapes and related rocks. For
example, gold often occurs with milk quartz.
Minerals occur together, called associating minerals
(Shaffer, Herbert and Raymond, 2001).
Using cluster analysis techniques can
significantly improve the accuracy of not only the
process of monitoring and diagnosing, but also to
quantify the mineral content of the sample rock
(Isayenko, Borishanskaya and Afanasyev, 1986).
165
Baklanova O. and Shvets O..
Methods and Algorithms of Cluster Analysis in the Mining Industry - Solution of Tasks for Mineral Rocks Recognition.
DOI: 10.5220/0005022901650171
In Proceedings of the 11th International Conference on Signal Processing and Multimedia Applications (SIGMAP-2014), pages 165-171
ISBN: 978-989-758-046-8
Copyright
c
2014 SCITEPRESS (Science and Technology Publications, Lda.)

2 MATERIALS AND METHODS
2.1 Theoretical Background
Clustering - is the automatic partitioning of a set of
elements into groups according to their similarity.
Elements of the set can be anything, for example,
data or characteristics vectors. Themselves groups
are also called clusters (Tryon, 1939).
In our case, using algorithms of cluster analysis
will be the identification of ore minerals by color
and texture characteristics of color-coded minerals
identified in images taken in reflected light using a
microscope (Panteleev, Egorova and Klykova,
2005).
The proposed method consists in measuring the
intensity of the three spectral components of the
reflected light (red, green, blue) in each pixel of the
investigated surface (frame) of a rock sample. Rock
sample is subjected to a pre-treatment and
preparation of the surface to be scanned, for example
in the form of ore.
In most cases preparation of the samples
represented by the following general form:
- Cutting of the sample;
- Grinding;
- Polishing.
After the sample has been prepared, it is
analysed with a microscope. A laboratory
microscopic picture reflects the structural features of
objects (color, texture, space and so on), determines
the results of mineralogical analysis.
Theoretically possibility to determine the mineral
ore targets on the microscopic image substantiated
by author M.P. Isayenko ((Isayenko, Borishanskaya
and Afanasyev, 1986).
In this paper it describes the algorithm for
automatic segmentation of color images of rocks,
using the methods of cluster analysis. There are
results of studies different color spaces for clustering
k-means (Huang, 1998).
In general, the K-means method segments the
image on K different clusters (areas) located far
away from each other based on certain criteria
(Odell and Duran, 1974).
As such a characteristic can be selected color
(the values of all three components simultaneously
RGB) color and geometric distance at the same time,
etc. By default, the implementation of this method is
applied to states Euclidean metric (Mandel, 1988).
Segmentation method "K- means" is
implemented through a two-step algorithm that
minimizes the sum of distances "point-to- centroid"
obtained by summing over all K clusters. Another
words, the purpose of the algorithm is to minimize
variability within clusters and maximize variability
between clusters (Ryzin, 1977).
Algorithm starts with a randomly selected cluster
centroid position, and then changes the ownership of
points (objects) to clusters, i.e. point moves from
one cluster to another in order to get the most
significant result.
During the first phase on each iteration all points
are rearranged so that they are positioned as close as
possible to their centroids, and then converted
coordinates centroids of each cluster. This part of the
algorithm allows to find quickly, but only an
approximately a solution to the problem of
segmentation, which is the starting point for the
second phase.
During the second stage of the algorithm points
are individually subjected to rearrangement in case it
reduces the sum of the distances, and the coordinates
of the centroids clusters after rearrangement
recalculated for each point. Each iteration during the
second stage consists of only a single pass through
all the points.
After completion of the segmentation algorithm
described program may provide additional
information such as:
- Sum of distances "point-to-centroid";
- Coordinates of centroid as well as some other
data.
Algorithm K-method can converge to a local
optimum, when the separation points move any
point to another cluster increases the resultant sum
of the distances. This problem can be solved only by
a reasonable (successful) choice of initial points
(Odell and Duran, 1974).
2.2 Color Image Segmentation
Algorithms
Segmentation is the process of dividing an image
into regions. Color segmentation in the vector space
RGB is as follows. Suppose that our goal is to
allocate objects in the image RGB, the color of
which lies within a certain range. Having some
representative sample vectors, we are interested in
having the color; we obtain an estimate of the
"average" of color you want to select. Let this
average color RGB denotes a column vector of T.
The problem of segmentation is to classify each
pixel RGB image and determine it belongs selected
"average" color-class or not. It is necessary to have
some measure of similarity of colors to implement
such a comparison (Martin, Fowlkes and Malik,
2004).
SIGMAP2014-InternationalConferenceonSignalProcessingandMultimediaApplications
166

The simplest such measure can serve as the
Euclidean distance. Let z - an arbitrary point in
RGB. We say that a point z is similar in color to m,
if the distance between these points does not exceed
a certain threshold T. The Euclidean distance
between z and m is calculated by the formula:
2
1
222
2
1
)()()(
)()(),(
BBGGRR
T
mzmzmz
mzmzmzmzD
,
(1)
where || • || denotes the norm of the argument, and
subscripts R, G and B are used to indicate the RGB
components of the vectors z and m. The locus of
points for which
TmzD
),(
is a sphere of radius
T. By definition, a point lying inside the ball or on
the spherical surface, the color matches a specified
criteria, and points lying outside of the ball and its
boundary sphere - not satisfy.
If you assign the two respective sets of image
values, for example, 1 (white) and 0 (black), you get
a binary image, which is the result of image
segmentation. Useful generalization of the Euclidean
distance is the distance defined by the expression:
2
1
)()(),( mzmzmzD
T
,
(2)
where С is the covariance matrix representative
sample vectors with the color to be segmented . This
distance is called the Mahalanobis distance. The
locus of points for which
TmzD ),(
is a three-
dimensional ellipsoid has the following important
property: the direction of its principal axes coincide
with the directions of the largest variance of the data
sample. If the covariance matrix C is the identity, the
Mahalanobis distance is the usual Euclidean
distance. Segmentation procedure is the same as
described in the preceding paragraph, only the data
is now surrounded not ball but ellipsoid.
2.3 Implementation of Cluster Analysis
Algorithm for Pattern Recognition
Tasks of Mineral Ore
It is considered the problem of cluster analysis to
segment micro-images in mineralogy. In this case,
the cluster is uniform in color-luminance
characteristics region (segment) if digital image.
And according to the specifics of digital images
mineral rocks might be in the same cluster multiple
segments, and research method determines
homogeneity of individual clusters.
Due to two factors it was reasonable to use
cluster analysis for the problem of segmentation:
there is only one tuning parameter k – a number of
clusters that you want to highlight, and the sets of
color-brightness characteristics associated with
different types of segments analysed image are
compact (Privalov and Butenko, 2007).
Any digital image has finite limits of size.
Because of this image can be considered as the
matrix I, which has the dimension [ΜxΝ], where M
- the number of pixels horizontally and Ν - is the
number of vertical pixels.
Each pixel with coordinates (x, y) corresponds to
a feature vector
yx
P
,
.in form (3)
n
yxyxyxyx
PPPP
,
2
,
1
,,
,,,
,
(3)
where:
nnn
PPP
maxmin
,
– limits of characteristics
changes.
For color model RGB, n=3, and
yxyxyx
BGRP
,,,
,,
, where
yxyxyx
BGR
,,,
,,
-
brightness of the red component of the pixel, the
green, and blue at point (х,у),
255,0
n
P
. This
allows to say that the image is the set of vectors
(observations)
yx
P
,
in n- dimensional space Ρ,
uniquely describes the color - luminance pattern
(
1,,0
Mx
,
1,,0
Ny
) shown in digital
image. As components of
yx
P
,
can also act
describing the neighbourhood of a given size
parameters for the pixel (x, y). These parameters
include the variance, average, maximum or
minimum brightness, calculated from the
neighbourhood, etc. Based on the characteristics of
the particular image heuristically determined the
number of components and composition, as well as
the radius of the neighbourhood (Tremeau and
Borel, 1997).
The purpose of cluster analysis - to implement
such a partition of the n-dimensional feature space
for k-clusters, in which the length between centroids
of the resulting clusters would be greatest, it is
shown in the expression (4).
max,
,
ji
d
(4)
where
ji
d
,
- distance between centroids for i-th and
j-th cluster,
ki ,,0
,
kj ,,0
.
In this case, the most appropriate method of
solving the problem of clustering is classic algorithm
of unsupervised learning - a method of k-means (k-
means method). Clustering incrementally in this case
is as follows:
Step 1. Specifies the number of clusters K, you
want to find.
MethodsandAlgorithmsofClusterAnalysisintheMiningIndustry-SolutionofTasksforMineralRocksRecognition
167

Step 2. It is randomly selected K vectors Ρ’ from
the set of vectors in selected space Ρ. These К
vectors are centroids of the clusters on the initial
calculation stage.
Step 3. Calculate the distance from each vector
space used to each of the obtained centroids in step
2. It can be used metric (5)-(6) to determine the
distance.
n
p
p
k
p
yxkyx
PPD
1
2
,),(
)(
,
(5)
n
p
p
k
p
yxkyx
PPD
1
,),(
,
(6)
where: (х,у)- coordinates of the observation,
],1[ Kk
– cluster index,
n - dimensionality of the used feature space,
],1[ np
- index of the feature observations.
Step 4. Determine the centroid of the cluster to
which the distance from the observation is smallest.
This cluster matched the observation.
Step 5. Goes through all available vectors and
then recalculate centroids for each resulting cluster
according (7).
)(
1
),(),(
)(
1
'
kS
s
n
syx
n
kyx
P
kS
P
(7)
where: k – cluster index,
S(k) - number of observations related to the
cluster index k,
s – indexes of the observations,
n
k
P
'
– new value n-th feature of centroid cluster
k.
Step 6. Steps 3-5 iterative process stops when the
process centroids’ changes stops or centroids will be
fluctuate around some stable values. If the step of
centroids change reached a predetermined value also
possible to stop iterations.
The disadvantage of the method of random
selection of the centroids is that the segmentation
result does not possess an important property of
repeatability.
This fact makes it unusable k-means algorithm in
its classical form for subsequent classification of the
selected objects, and therefore requires increasing its
stability in solving the problem of image
segmentation of mineral rocks samples.
Solutions to problems of inadequate
segmentation include the following - the
development of methods for obtaining initial values
of the centroids and selecting a set of parameters,
forming a vector of observations, most fully
satisfying description of the characteristics shared
segments.
2.4 Selection of the Feature Space
Feature vector for image segmentation by clustering
method is chosen heuristically. Texture in images of
samples mineral rock is not critical and noted that a
significant difference is observed for color-
brightness characteristics. Consequently, as the
feature space for solving the problem of image
segmentation is one of the existing color spaces is
quite suitable (Gonsales and Woods, 2011).
It is important to choose a color space with
minimal correlation between describing its
components. It was selected HSV color space based
on the study of the logical and mathematical
representation of color models, defined by (8-10).
,max(,
),,min(),,max(
)(60
240
,max(,
),,min(),,max(
)(60
120
,,max(,
),,min(),,max(
)(60
G
RBif
BGRBGR
GR
G
RGif
BGRBGR
RB
B
GRRif
BGRBGR
BG
H
(8)
),,max(
),,min(),,max(
BGR
BGRBGR
S
(9)
),,max( BGRV
(10)
where: R,G,B – the brightness of red, green and blue
component, respectively, for the RGB color space,
H - color, represented by the angle between the
vector of pure red and current, the range of values
from 0 to 2 π,
S – saturation, the range of values from 0 to 1,
V – brightness, takes a value from 0 to 1.
HSV space is visually represented in the form of
a cylindrical coordinate system. It is showed in
Fig.1.
Figure 1: HSV space visually representation.
Figure 2 shows classically cylindrical coordinate
system representation.
SIGMAP2014-InternationalConferenceonSignalProcessingandMultimediaApplications
168
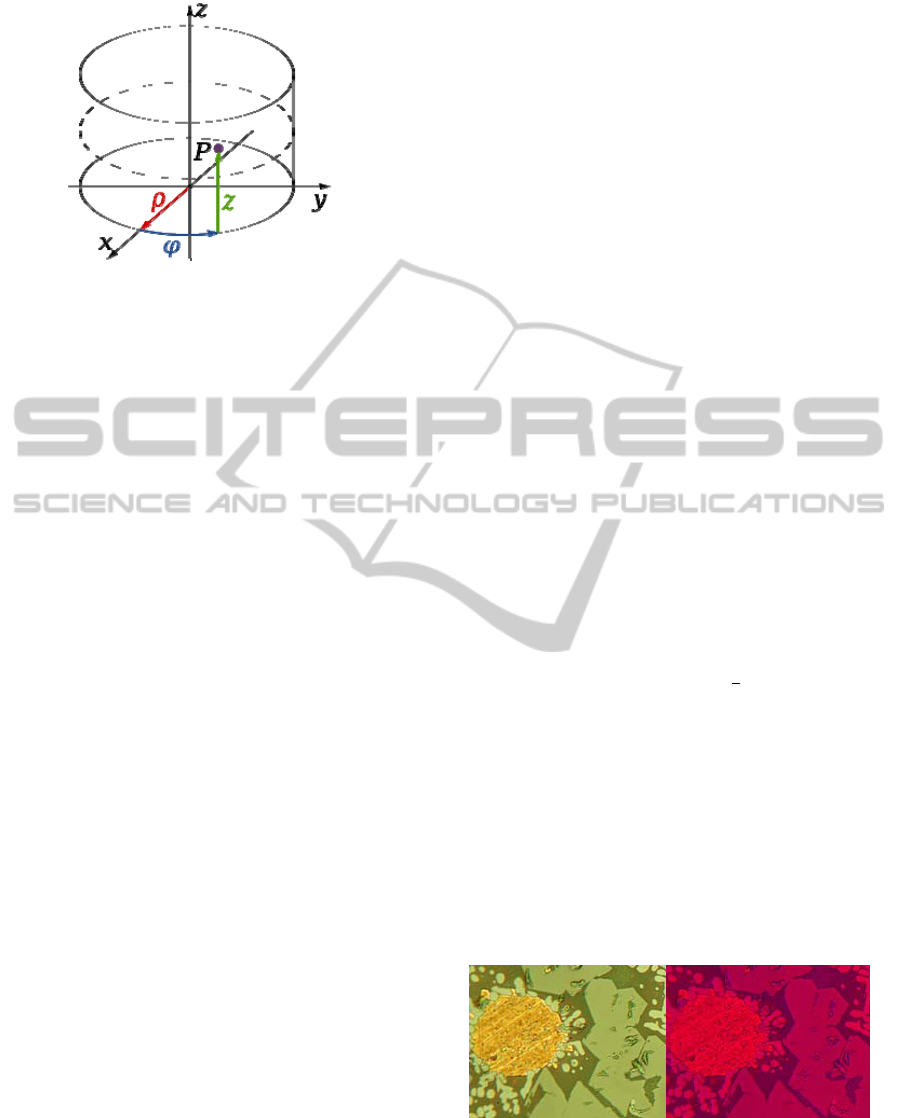
Figure 2: Classic cylindrical coordinate system
representation.
On Figure 2, ρ - the distance from the point to
the origin of rotation, φ - angular coordinate, z - the
distance from the plane of the base to the point.
Thus, these are the coordinates of point P(ρ,φ,z).
Coordinates of this same point at the transition to
the Cartesian coordinate system can be written as the
following expressions (11).
zz
py
px
sin
cos
(11)
Direct calculations in the cylindrical coordinate
system are more complicated than those in the
Cartesian coordinate system. It is therefore proposed
to move to a Cartesian coordinate system. H is
coordinate similar φ, coordinate S - similar to ρ, and
the coordinate V - is z. Translation HSV space
coordinates to a Cartesian coordinate system can be
configured according to the formulas (12).
VZ
SHY
SHX
v
hs
hs
,)sin(
)cos(
(12)
where:
hs
X
,
hs
Y
,
v
Z
- the new values of the feature
vector,
H, S, V – components of vector characteristics in
HSV color space.
Methods for obtaining initial values of the
clusters’ centroids.
Algorithm for obtaining the initial values of
cluster consists of the following stages:
Step 1. Arrange color space P
HSV
on one-
dimensional vectors P
H
, P
S
, P
V
;
Step 2. Implement clustering in the resulting
vectors. Vector is divided into intervals. For the
initial value of the centroids of clusters are taken
middle of intervals.
Step 3. Obtained cluster centroids are the
coordinates of the centroids of the clusters in three-
dimensional space of attributes HSV.
3 RESULTS AND DISCUSSION
3.1 An Example of a Cluster Analysis
Algorithm with Self- Study
It was selected cluster analysis with self-study for
digital image segmentation algorithm. Problem of
cluster analysis is ensuring the reduction of a set of
data in a more compact object classification
(Baklanova and Uzdenbaev, 2013).
It is proposed method preliminary analysis
brightness image zones in order to identify the initial
value centroid of each cluster to ensure the quality of
clustering and avoid possible location pseudo center.
It is used standard error deviation of the initial
set of values from the cluster centers and rating
(expressed as a percentage reflecting the relative
quality of detail) to assess the quality of
segmentation.
As a quantitative metric accessories cluster was
chosen Euclidean distance:
2
1
2
1
))((
N
j
jkijik
xxD
(13)
where: i – index of the observation,
k – cluster index,
N – number of color space characteristics, (N=3),
x={x1,x2,x3} – vector in chosen color space.
Better results have been obtained after translation
metrics color space HSV, to a Cartesian coordinate
system XhsYhsZv (12).
Examples of clustering results are presented on
Figures 4, 5, 6.
a) b)
Figure 3: Example of translation HSV-space algorithm:
a) RGB-image, b) HSV-image.
MethodsandAlgorithmsofClusterAnalysisintheMiningIndustry-SolutionofTasksforMineralRocksRecognition
169
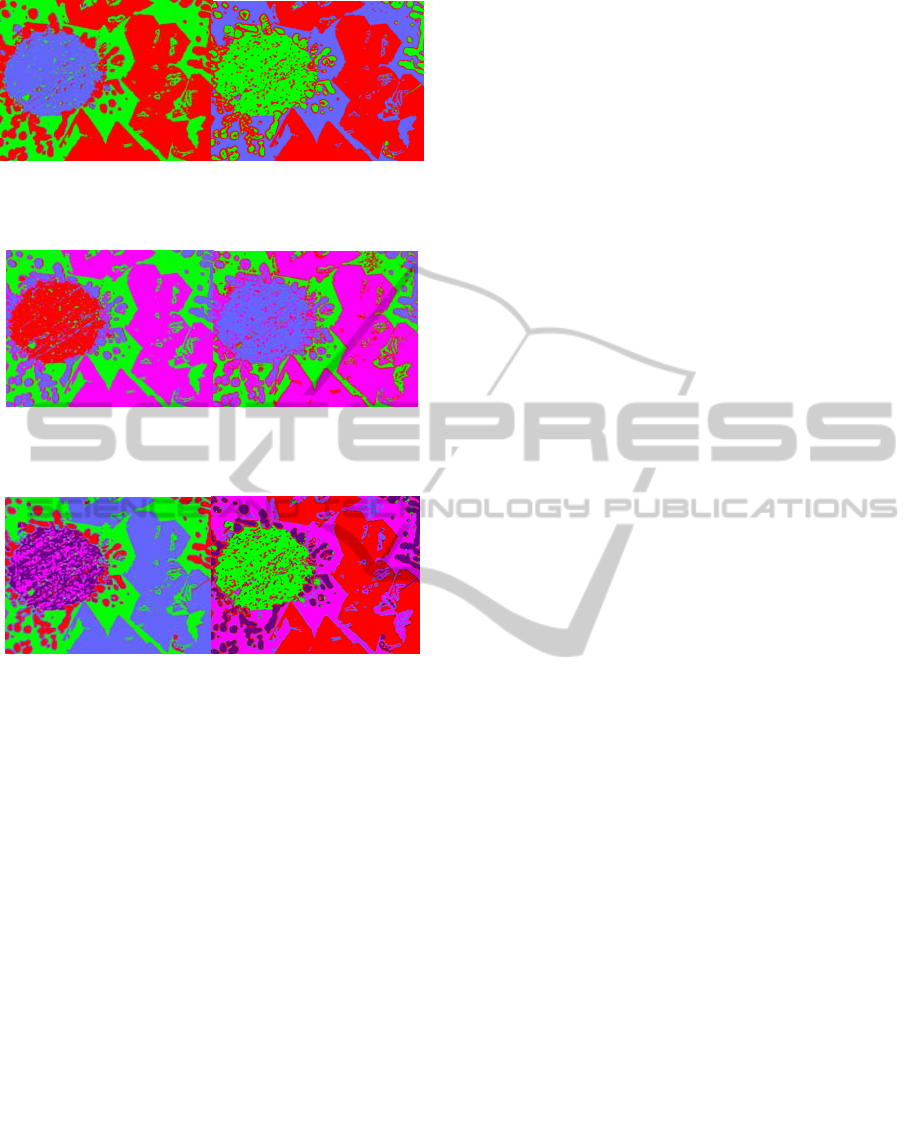
a) b)
Figure 4: Example of clustering analysis for 3 clusters:
a) RGB-image, b) HSV-image.
a) b)
Figure 5: Example of clustering analysis for 4 clusters:
a) RGB-image, b) HSV-image
a) b)
Figure 6: Example of clustering analysis for 5 clusters:
a) RGB-image, b) HSV-image
3.2 Implementation of Cluster Analysis
Algorithm for Computing
Granulometries
Study of granulometric composition of rocks is
produced by separating the constituent grain on size
classes and to determine the weight of each class
(Krasilnikov, 2011).
Weight of individual classes is expressed in
percent. Size analysis is the most important type of
research clastic rocks as their particle size
distribution is the most important signs of defining
all the other features: physical properties,
geotechnical characteristics, mineral composition
and other characteristics.
Tasks of granulometric analysis can be divided
into 4 groups:
1) a precise definition of the structure and name
of ore;
2) evaluation of ore as the mineral (soil,
reservoirs of oil, gas, etc.);
3) reconstruction of the conditions for deposition
(genesis) terrigenous sediment;
4) preparation for the study of other signs or
other methods - chemical or mineralogical
composition, grain shape and other features that are
always different beans certain dimension.
Methods for determining the size of scattered
objects on the image are important part of grit. It is
possible to use the methods of cluster analysis to
find the size of the objects, for example, k-means,
i.e., without measuring the size of each individual
object.
4 CONCLUSIONS
As a result it was determined color space provided
sufficient quality rocks segmentation by the method
of cluster analysis.
It was supposed the technique of pre- computing
the values of the centroids. There is formulas
translation metrics color space HSV. The
effectiveness of the proposed method lies in the
automatic identification of objects of interest on the
total image, tuning parameters of the algorithm is a
number that indicates the amount allocated to the
segments. It has been developed practice software to
investigate the methods.
REFERENCES
Harvey, B., Tracy, R.J., 1995. Petrology: Igneous,
Sedimentary, and Metamorphic, 2nd ed. New York:
W.H. Freeman.
Baklanova, O.E., 2013. Development of algorithms for
image recognition needed to assess the quality of the
mineral species in the mining industry. Abstracts of
International Conference «Mathematical and
Informational Technologies, MIT
2013»,VrnjackaBanja and Budva.
Clarke, A. R., Eberhardt, C. N., 2002. Microscopy
Techniques for Materials. Science Woodhead
Publishing, CRC Press.
Chris, P., 2002. Rocks and Minerals. Smithsonian
Handbooks. New York: Dorling Kindersley, 2002.
Farndon, J., 2006. The practical encyclopedia of rocks and
minerals. How to Find, Identify, Collect and Maintain
the World's best Specimens, with over 1000
Photographs and Artworks. London: Lorenz Books.
Shaffer, P. R., Herbert, S. Z., Raymond P., 2001. Rocks,
Gems and Minerals. Rev. ed. New York: St. Martin's
Press.
Isayenko, M. P., Borishanskaya, S. S., Afanasyev, E L.,
1986. Keys to the main ore minerals in the reflected
light. Moscow: Nedra.
SIGMAP2014-InternationalConferenceonSignalProcessingandMultimediaApplications
170

Tryon, R.C., 1939. Cluster analysis. London: Ann Arbor
Edwards Bros.
Panteleev, C., Egorova, O., Klykova, E., 2005. Computer
microscopy. Moscow:Technosphere.
Huang, Z., 1998. Extensions to the k-means algorithm for
clustering large data sets with categorical values. Data
Mining and Knowledge Discovery, 2:283–304.
Odell, P. L., Duran, B. S., 1974. Cluster Analysis: A
Survey, Springer-Verlag.
Mandel, J.,1988. Cluster analysis. Moscow: Finance and
statistics, 176 p.
Ryzin, J. V., 1977. Classification and clustering.
Proceeding of an advanced seminar: Academic press,
Inc., New York, San Francisco, London, 390 p.
Martin, D. R., Fowlkes, C.C., Malik, J., 2004. Learning to
detect natural image boundaries using local brightness,
color, and texture cues. IEEE Trans Pattern Anal
Mach Intell 26, 2004, pp.530-549.
Privalov, O. O., Butenko, L. N., 2007. Automatic
segmentation of digital images medical-biological
drugs method of cluster analysis. Modern science
intensive technologies: nauch, 10, 2007, pp. 79-80.
Tremeau, A., Borel, N. A., 1997. Region growing and
Merging Algorithm to Color Segmentation. Pattern
Recognition, PR(30), No. 7, July 1997. - pp. 1191-
1203.
Gonsales, R. C., Woods, R. E., 2011. Digital image
processing, 3rd edition, Pearson Education, 976 p.
Baklanova, O. E., Uzdenbaev, Z.S., 2013. Development of
methodology for analysis of mineral rocks in the
mining industry. Joint issue of the Bulletin of the East
Kazakhstan state technical University and Computer
technology of Institute of computational technologies,
Siberian branch of the Russian Academy of Sciences,
Part 1, September, 2013. - P.60-66.
Krasilnikov, N. N., 2011. Digital processing of 2D and 3D
images. Saint-Petersburg, BHV-Petersburg, 608 p.
MethodsandAlgorithmsofClusterAnalysisintheMiningIndustry-SolutionofTasksforMineralRocksRecognition
171
