
An Automated Work Cycle Classification and Disturbance
Detection Tool for Assembly Line Work Stations
Karel Bauters
1
, Hendrik Van Landeghem
1
, Maarten Slembrouck
2
, Dimitri Van Cauwelaert
2
and Dirk Van Haerenborgh
2
1
Department of Industrial Management, Ghent University, Technologiepark, Zwijnaarde (Ghent), Belgium
2
IMINDS/UGENT-IPI-VISIONSYSTEMS, Ghent University, Ghent, Belgium
Keywords: Manufacturing, Production Engineering, Complexity, Image Processing, Time Series Analysis, Dynamic
Time Warping, Visual Hull.
Abstract: The trend towards mass customization has led to a significant increase of the complexity of manufacturing
systems. Models to evaluate the complexity have been developed, but the complexity analysis of work
stations is still done manually. This paper describes an automated analysis tool that makes us of multi-
camera video images to support the complexity analysis of assembly line work stations.
1 INTRODUCTION
In recent years, the market for manufacturing
companies is shifting from mass production to mass
customization. The increasing number of product
variants leads to a significant increase of the
complexity of manufacturing systems, both for the
operator as well as for the manufacturing support
systems. This problem has drawn the attention of a
number of researchers in the last three decades.
Some models to quantify the complexity in
manufacturing environments have been developed,
but most of the analysis is done manually.
One of the drivers of complexity in an assembly
line work station, is the number of different work
patterns in the work content. In this paper an
automated method to evaluate and classify different
work patterns is presented. Data is gathered by
making a 3D reconstruction of the operator based on
the images provided by multiple cameras.
2 LITERATURE REVIEW
As already mentioned, the trend towards more
customized products induces a lot of challenges for
manufacturing companies. Fisher et al. (1995),
MacDuffie et al. (1996) and Fisher and Ittner (1999)
investigated the effect of the increasing variety of
products on the performance of producton systems
in the automotive industry. Macduffie et al. (1996)
stated that the part complexity is the only element
that has a negative effect on the systems
performance. Later on, it appeared that complexity is
also driven by the way information is presented to
the human in the system and the amount of
information that person needs to process
(ElMaraghy et al., 2003). They also proposed a
methodology to evaluate product and process
complexity and their interrelations. Most of the
research concerning manufacturing complexity is
trying to associate this complexity to product and
process structures. Zeltzer et al. (2012) were the first
to quantify the relationship between complexity and
its drivers as perceived by the operator.
For years, industrial engineers have been using
video images to facilitate and improve their work.
Video sequences contain a lot of information and are
a good way to document work methods (Karger and
Hancock, 1982, Konz, 2011). Video analysis is also
a well-used tool for method and time study.
However, to perform detailed time studies, exact
distances and measurements in the work place are
needed. Elnekave and Gilad (2006) developed a
rapid video-based analysis system that is able to
translate distances accurately from the picture frame
into real distance values of the workstation.
Furthermore, video images can be used in training
tools for operators, ergonomics analysis and the
analysis of health and safety issues (Dencker et al.,
685
Bauters K., Van Landeghem H., Slembrouck M., Van Cauwelaert D. and Van Haerenborgh D..
An Automated Work Cycle Classification and Disturbance Detection Tool for Assembly Line Work Stations.
DOI: 10.5220/0005024406850691
In Proceedings of the 11th International Conference on Informatics in Control, Automation and Robotics (ICINCO-2014), pages 685-691
ISBN: 978-989-758-040-6
Copyright
c
2014 SCITEPRESS (Science and Technology Publications, Lda.)
1999). Nexteer, a supplier of automotive parts, uses
a video analysis tool to facilitate the continuous
improvement of their processes by comparing work
methods of different operators in the same work
station (Taylor, 2011).
A lot of work has already been done in the area
of human behavior recognition using video images.
Bodor et al. (2003) described a method to track
pedestrians and classify their behavior in order to
detect situations where people might be in danger.
Computer vision and pattern recognition techniques
are also widely used in video surveillance (Cristani
et al., 2013). And although industrial engineers have
been using video images for a long time, there is, to
the best of our knowledge, no system to date that
captures the behavior and activities of assembly line
workers automatically.
3 IMAGE PROCESSING
To determine the position of the operator in the work
station, the visual hull of his body is created for
every frame in the video sequence. This visual hull
is created by first constructing for each camera, a
generalized infinity cone in the 3D space with the
camera position being the apex and the silhouette in
the camera view as the base. The 3D space is
divided in voxels and only voxels that are within the
infinity cones of all viewpoints, will be used to build
up the 3D model of the operator (Laurentini, 1994).
The objects center of mass is then projected onto the
ground plane. This way we know the operators’
position in every frame of the video image (50ms).
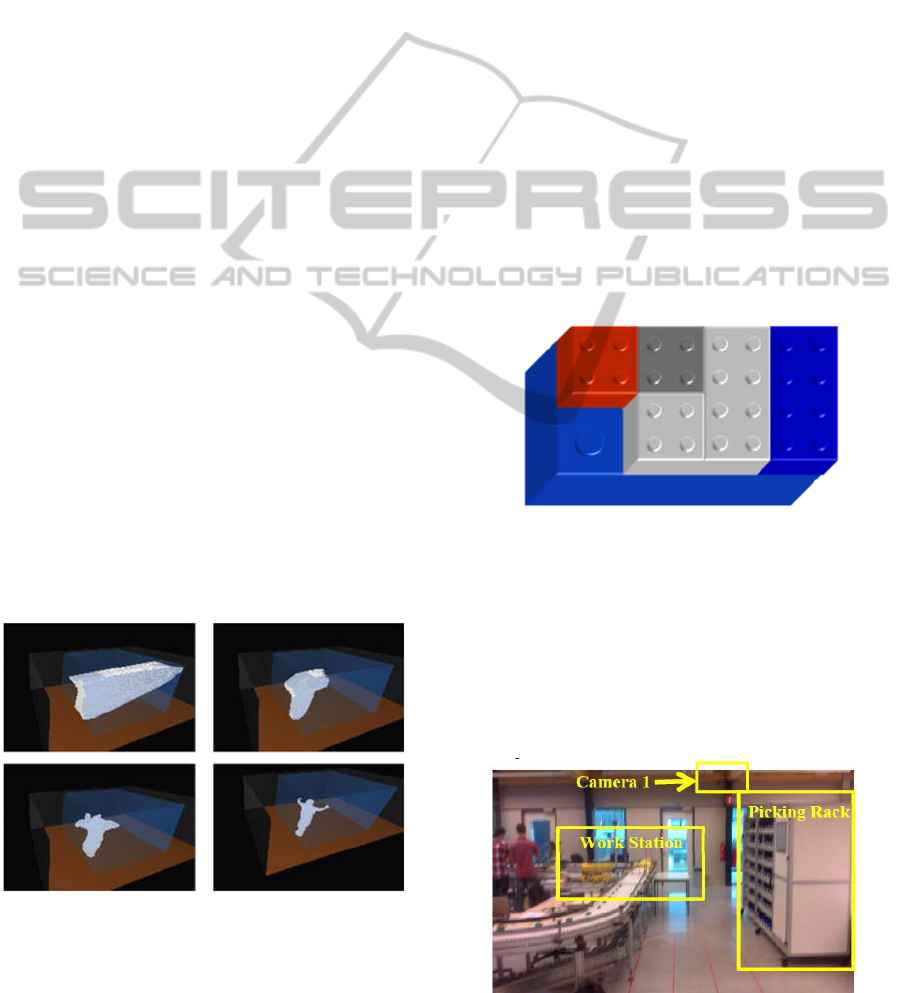
The principle of voxel carving is visualized in
Figure 1.
Figure 1: Voxel carving example.
One of the problems we face in industrial
environments is occlusion. Static objects such as
conveyers and racks make reconstruction very
difficult. Therefore, a self-learning algorithm that is
able to build an occlusion map for each camera from
a voxel perspective, is developed. This information
is then used to determine which camera viewpoints
need to be taken into account when reconstructing
the 3D model in every voxel in the scene.
(Slembrouck et al., 2014)
4 TEST SET-UP
The experiments in this paper are done in a
laboratory setup. In the experiments, the operator is
asked to make some products out of Lego and Duplo
blocks. The Duplo blocks, which serve as base for
the assembly, are brought to the work station by a
conveyer belt. This conveyer belt simulates a
production line. On this base block, a pattern of
smaller Lego blocks needs to be stacked.
Using Lego and Duplo has the advantage that we
can easily create new scenario’s with variable
complexity (number of parts, variants, …). An
example of a finished product is shown in Figure 2.
Figure 2: Finished part.
Parts (Lego) are stored at the border of line in a rack.
The rack is equipped with a pick-to-light system.
The work station is permanently equipped with 5
cameras, four of which are positioned in the top
corners of the work station. The fifth camera has a
fisheye lens and is positioned centrally above the
workstation. A picture of the laboratory is shown in
Figure 3.
Figure 3: Picture of the laboratory setting.
ICINCO2014-11thInternationalConferenceonInformaticsinControl,AutomationandRobotics
686
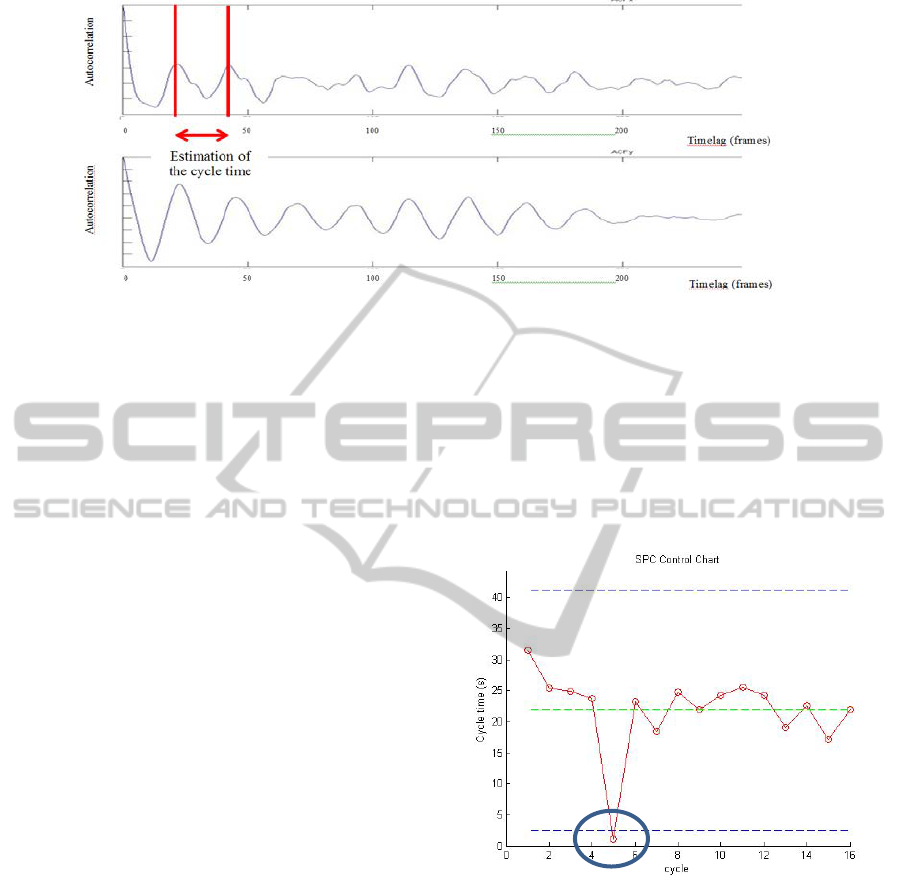
Figure 4: Autocorrelation functions.
5 WORK CYCLE
CLASSIFICATION
5.1 Cycle Time Analysis
High complexity in the work content induces
variation in the cycle time. To determine the cycle
time in a work station and the variation of this cycle
time, we need to divide the data into work cycles. A
first estimation of the cycle time can be made using
the autocorrelation function of the operators’ path.
5.1.1 Autocorrelation
The autocorrelation shows the similarity between
observations as a function of the time lag between
them. In this case, the distance between two peaks in
the autocorrelation function gives an indication of
the time the operator needs to return to a previously
visited location. The x- and y component of the
autocorrelation function for one scenario are shown
in Figure 4.
Sometimes there are several ‘local’ peaks in the
autocorrelation function. To eliminate this noise,
we only keep the maximum value of the
autocorrelation function within a certain time frame.
This time frame is increased until the cycle time
based on the x-component matches the one
calculated using the y-component.
5.1.2 Segmentation
The autocorrelation function gives an indication of
the cycle time. However, to know the real cycle
time, we need to segment the data in separate work
cycles. To do this, we assume that the operator starts
his work by picking parts at the
border of line. Afterwards he goes back and
performs all assembly actions needed to finish the
assembly. To determine the start of a work cycle, the
work place is divided in several zones. A work cycle
starts when the operator leaves the assembly zone.
After segmentation, the duration of every work
cycle is determined. The results of this analysis are
displayed as a SPC-chart in Figure 5.
Figure 5: Segmentation based on location only.
Segmentation purely based on the location of the
operator however, appears to be flawed. The
operator sometimes leaves to assembly zone for a
short amount of time, for instance to set right a
picking mistake he made. To avoid that these short
events are considered to be a separate cycle, we
assume that the shortest real cycle in a work place
will take at least half of the time of the average work
cycle. We compare the cycle time of every segment
to the previously calculated average cycle time and
add short cycles to the previous segment. This way,
short disturbances are not treated as a separate
segment. The segmentation process is shown in
Figure 6.
AnAutomatedWorkCycleClassificationandDisturbanceDetectionToolforAssemblyLineWorkStations
687
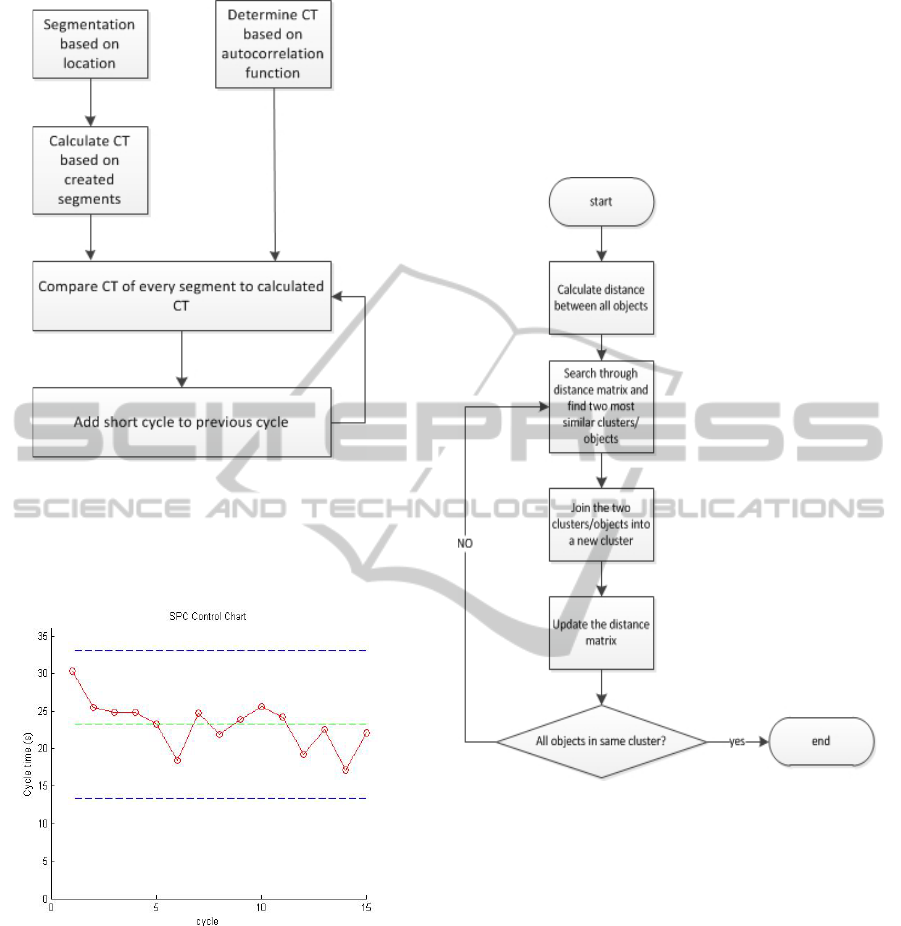
Figure 6: Segmentation procedure.
Figure 7 shows the control chart for the same
scenario as Figure 5 after using the new
segmentation procedure.
Figure 7: Segmentation using new segmentation
procedure.
5.2 Work Patterns
The complexity of the work content increases with
an increasing number of work patterns the operator
has to remember. Therefore, a procedure to cluster
the segmented data into groups of similar work
patterns was developed.
5.2.1 Work Cycle Clustering
A very simple and fast way of clustering data is k-
means clustering. There is however one big
disadvantage to this method: the number of clusters
needs to be known in advance. Since we don’t know
how many work patterns (clusters) there are, we
choose to classify the segments using hierarchical
clustering. The outline of the hierarchical clustering
algorithm is given in Figure 8.
Figure 8: Hierarchical clustering.
To calculate the distance matrix, we cannot simply
use the Euclidean distance between all points of two
cycles. The first reason for this is that the cycles
have different lengths. And even if all cycles would
have the same length, using Euclidean distance
would not give us any useful information because it
cannot cope with the fact that the operator can do the
same work cycle at different speeds. To overcome
this hurdle, we use a technique called dynamic time
warping (DTW) to calculate the similarity between
segments of data.
5.2.2 Dynamic Time Warping
Dynamic time warping is a technique that is used a
lot in the analysis of time series, such as temporal
sequences of video and audio. It is a technique that
measures the similarity between two time series
ICINCO2014-11thInternationalConferenceonInformaticsinControl,AutomationandRobotics
688
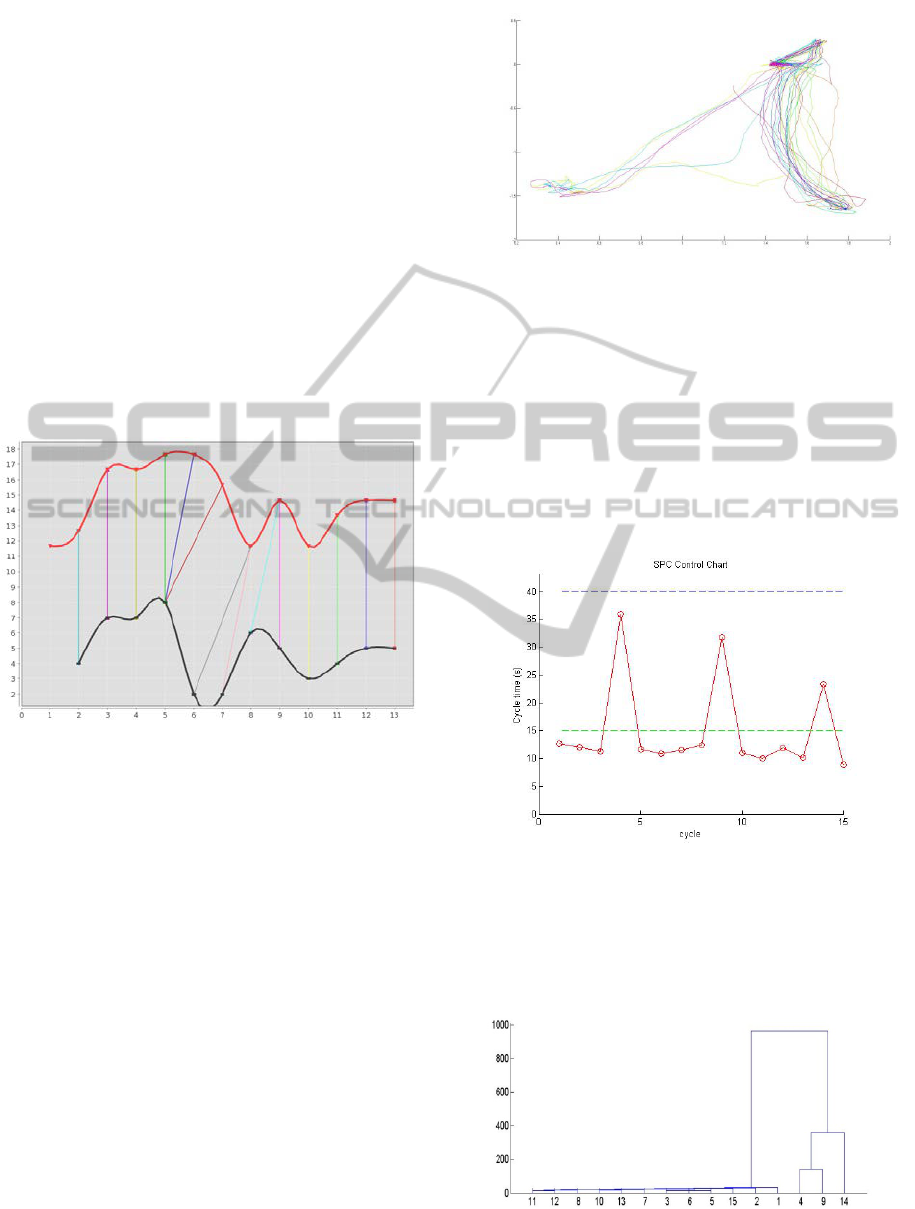
which may vary in speed. DTW is capable of
recognizing similar work patterns, even if the
operator is performing the same task at different
speeds.
DTW calculates the best match between two
time series with three important restrictions: (Müller,
2007)
• Monocity: The alignment path does not go
back in time
• Continuity: The alignment path does not jump
in time
• Boundary conditions: Makes sure the
alignment doesn’t consider one of the
sequences partially
Figure 9 visualizes the alignment between to two-
dimensional time series using the dynamic time
warping algorithm.
Figure 9: Visualization of DTW procedure (from:
http://math.ut.ee).
5.3 Cycle Time Analysis
5.3.1 Scenario 1
In this scenario, the operator was given the task to
produce 15 end products of 2 variants. The first
variant was a low complexity assembly using only 2
different parts. All parts for this variant were stored
at the right side of the border of line and 12 of these
products were produced. The second variant consists
of 5 different parts which were stored at the left side
of the rack. Only 3 products of this variant were
made. The 15 work cycles are shown in Figure 10.
Figure 10: Path of the operator in scenario 1.
5.3.2 Results
As we could expect, there is a significant difference
in cycle time between the cycles where variant 1 was
produced and those where variant 2 was made. This
is shown in the SPC-chart in Figure 11. It appears
that variant 2 was produced in work cycles 4, 9 and
14, which corresponds to the task sequence the
operator was given.
Figure 11: SPC scenario 1.
Clustering this data using the techniques mentioned
earlier, results in following dendrogram, which
clearly shows that there are 2 main clusters and that
cycles 4, 9 and 14 are classified in the same cluster.
Figure 12: Dendrogram scenario 1.
x
y
AnAutomatedWorkCycleClassificationandDisturbanceDetectionToolforAssemblyLineWorkStations
689
5.3.3 Scenario 2
The two work patterns in the scenario above are
significantly different. In a new scenario the
operator was asked to make the same product 9
times. Some of the parts in the bins were taped so
they could not be assembled. In that case, the
operator had to go back and pick that one part again.
The results of the clustering analysis are shown in
Figure 13. We can see clearly that the analysis tool
is capable of detecting irregularities in the work
pattern.
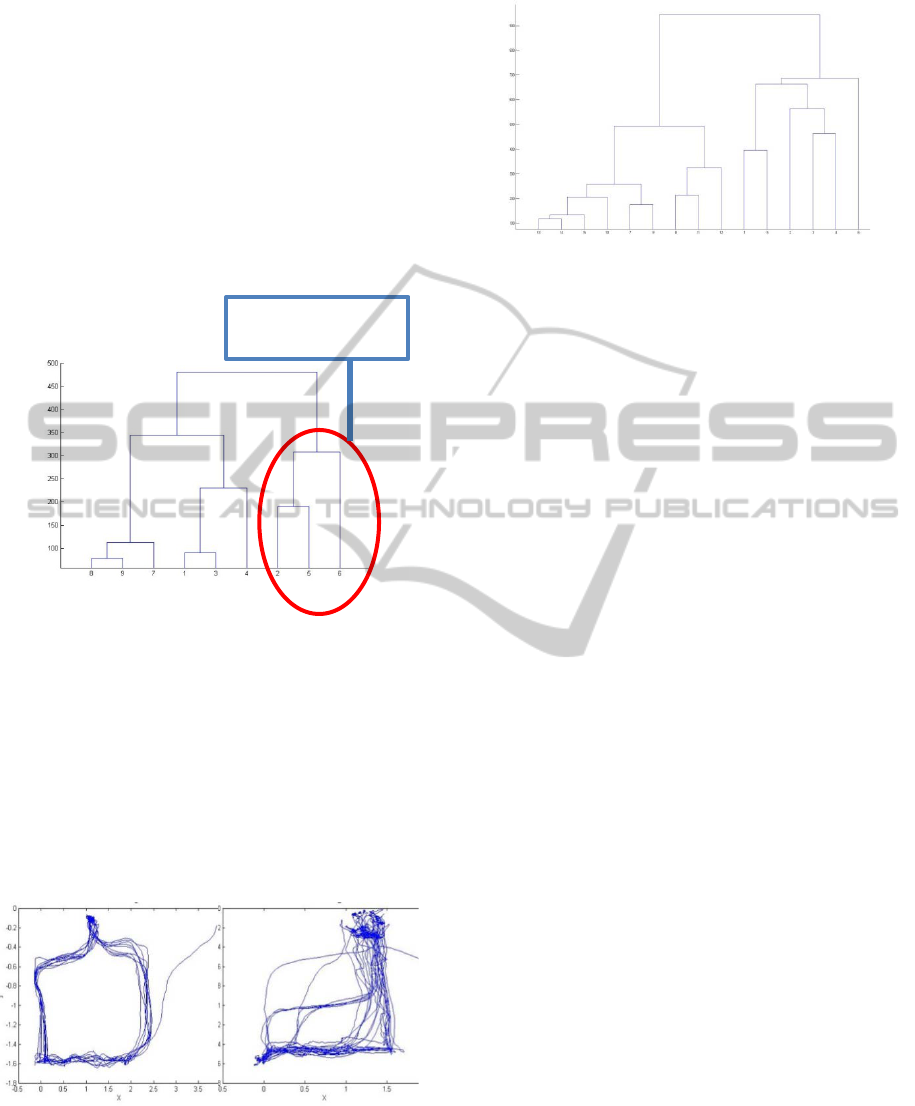
Figure 13: Dendrogram scenario 2.
5.3.4 Scenario 3
In a third and last scenario, two operators were
asked to perform the same task sequence. One of the
operators was asked to follow the borders of a grid
that was taped to the ground. This results in a very
structured walking pattern. The second operator did
not get any extra instructions. Both patterns are
shown in Figure 14 below.
Figure 14: different work patterns scenario 3.
Figure 15: Dendrogram scenario 3.
Figure 15 shows the dendrogram for this
scenario. Again we can see a clear division into two
clusters. Also the disturbances in the second pattern
can be detected in the plot.
6 CONCLUSIONS
In this paper we presented an automated tool that
supports the complexity analysis of assembly line
work stations based on the images from multiple
cameras. The research shows that the current image
processing technology can help us to automate the
analysis of assembly line workstations.
A method to segment data into work cycles and
classifying these cycles using hierarchical clustering
was proposed. This technique is capable of
differentiating between different work patterns and
detecting disturbances.
All results in this paper are based on experiments
done in a laboratory setting. In the future, we will do
a field test in a real production scene. The use of the
image processing technology in manufacturing
environments should not be limited to the analysis of
complexity in work stations. In the future, an
efficiency and ergonomics analysis module could be
added to the analysis tool in order to provide
industrial engineers with a lot of useful information.
REFERENCES
MacDuffie, J. P. , Sethuraman, L., Fisher, M. L. (1996)
‘Product Variety and Manufacturing Performance:
Evidence from the International Automotive Assembly
Plant Study’, Management Science , vol. 42, no. 3, pp.
350-369.
EIMaraghy, W. H , Urbanic, R.J. (2003) ‘Modelling of
Manufacturing Systems Complexity’, CIRP Annals,
vol. 52, issue 1, pp.363-366.
ICINCO2014-11thInternationalConferenceonInformaticsinControl,AutomationandRobotics
690

EIMaraghy, W. H , Urbanic, R.J. (2004) ‘Assessment of
Manufacturing Operational Complexity’, CIRP
Annals, vol. 53, issue 1, pp. 401–406.
Zeltzer, L., Limère,V., Aghezzaf, E. H., Van Landeghem,
H. (2012) ’Measuring the Objective Complexity of
Assembly Workstations’, Conference Proceedings,
Seventh International Conference on Computing in the
Global Information Technology
Karger, D. W., Hancock, W. M. (1982) Advanced work
measurement, New York, Industrial Press
Konz, S. (2001) Methods engineering. In Handbook of
Industrial Engineering, 3rd edition., pp. 1353–1390,
New York, Wiley
Elnekave, M., Gilad, I. (2006) ‘Rapid video-based analysis
system for advanced work measurement’,
International Journal of Production Research, vol. 44,
issue 2, pp. 271-290
Dencker, B., Balzer, H-J.,Theuerkauf, W. E., Schweres,
M. (1999) ‘Using a production-integrated video
learning system (PVL) in the assembly sector of the
car manufacturing industry’, International Journal of
Production Ergonomics, Vol. 23, Issues 5-6, pp. 525-
537
Taylor, P. (2011) ‘From figure skaters to the factory floor’
[online], Available: http://www.ft.com/intl/cms/s/
0/fc571624-ce98-11e0-a22c-00144feabdc0.html [24
Jun 2014]
Fisher, M. L. and Ittner, C. D. (1999), ‘The impact of
product variety on automobile assembly operations:
empirical evidence and simulation analysis’,
Management Science, Vol. 45, pp. 771-786
Fisher, M. L., Jain, A. and MacDuffie, J.P. (1995)
‘Strategies for product variety: lessons from the auto
industry’, B. Kogut & E.Bowman, Eds. Redesigning
the Firm., pp. 116-154, Oxford U. Press
Ouvriach, K., Dailey, M. N. (2010) ‘Clustering human
behaviours with dynamic time warping and hidden
Markov models for a video surveillance system’,
Conference Proceedings, International Conference on
electrical engineering/electronics computer
telecommunications and information technology
(ECTICON), pp. 884-888
Slembrouck, M., Van Cauwelaert, D., Van Hamme, D.,
Van Haerenborgh, D., Van Hese, P., Veelaert, P., &
Philips, W. (2014). Self-learning voxel-based multi-
camera occlusion maps for 3D reconstruction.
Conference Proceedings, 9th International Joint
Conference on Computer Vision, Imaging and
Computer Graphics Theory and Applications
(VISAPP - 2014), SCITEPRESS.
Müller, M. (2007) Information Retrieval for Music and
Motion, Springer
Laurentini, A. (1994) The Visual Hull Concept for
Silhouette-Based Image Understanding. IEEE Trans.
Pattern Anal. Mach. Intell., Vol. 16, no. 2, pp. 150-
162.
Bodor, R., Jackson, B., Papanikolopoulos, N., (2003)
‘Vision-Based Human Tracking and Activity
Recognition’, Conference Proceedings, 11
th
Mediterranean Conference on Control and
Automation, Rodos
Cristani, M., Raghavendra, R., Del Bue, A., Murino, V.
(2013)Human behavior analysis in video surveillance:
A Social Signal Processing perspective,
Neurocomputing, Vol. 100, January, pp.86-97.
AnAutomatedWorkCycleClassificationandDisturbanceDetectionToolforAssemblyLineWorkStations
691
