
A Visualization System of Discussion Structure in Case Method Learning
Daichi Hisakane and Masaki Samejima
Graduate School of Information Science and Technology, Osaka University, 2-1, Yamadaoka, Suita, Osaka, Japan
Keywords:
Case Method Learning, Discussion Structure, Visualization, Graph Representation.
Abstract:
In the case method learning to develop learners’ problem-solving skills, an instructor plays a role on the
facilitation of the discussion. As one of facilitators’ techniques to support learners’ discussion, visualization
of discussion structure based on graph representation is often used. Automatic visualization of the discussion
structure without the facilitator will contribute to expanding the learning opportunities for learners. So we
propose a visualization system of the discussion structure by a graph representation with nodes and links
through speech recognition of learners’ voice. The proposed method improves the conventional method to
visualize discussion structure by considering the relation in the sequence of learners’ opinions.
1 INTRODUCTION
It is necessary to obtain problem-solving skills to an-
alyze problems and to propose solutions to the prob-
lems (Schwarz, 2002). Case method learning is one of
the ways of developing problem-solving skills (Ham-
mond, 1980). In the case method learning, an instruc-
tor makes a documented case that describes what hap-
pens in the past. The sentences in the documented
case imply some problems in the case. The learners
exchanges their opinions regarding what are problems
and how to solve the problems in the documented
case. This enables the learners to share the knowl-
edge about how to deal with the problem.
In the discussion, it sometimes happens that the
learners get off the arguing point or become too inac-
tive to express their opinions. In this case, the learners
can not share the knowledge sufficiently. Therefore,
the instructor facilitates the discussion neutrally by
asking some questions or showing summary of dis-
cussion in order to make the learners aware of what
point to be argued (Brooke, 2006).
As one of facilitator’s techniques to support learn-
ers’ discussion, visualizing the structure of the dis-
cussion by a graph representation is often used (Ya-
mashita, 2000). Learners can intuitively understand
and share the arguing point of the discussion and its
structure by the visualization. The graph representa-
tion of the discussion consists of ‘node’ and ‘link’.
The nodes represent learners’ opinions and the links
between nodes represent relations between the opin-
ions. Every time the learners speak their opinions,
the facilitator adds the opinions as the nodes to the
graph of the discussion structure. Watching the graph
made by the facilitator, the learners can recognize the
arguing point and find when they miss the arguing
point. This enables to lead the learners to the effective
discussion (Gragg, 1951). However, facilitators are
lacking for learners. Learners can not always receive
the facilitator’s support of visualizing the discussion
structure.
So we propose a visualization system of the dis-
cussion structure as a graph representation in the
case method learning. In using the proposed system,
the learners speak their opinions to a microphone.
The proposed system captures the learners’ opinions
by speech recognition. Analyzing the opinions, the
proposed method makes the graph of the discussion
structure and displays to the learners.
The rest of the paper is organized as follows. Sec-
tion 2 describes the literature review of visualizing
discussion structure. Section 3 outlines our proposed
system of visualizing discussion structure. Section 4
shows the experimental results in applying the pro-
posed method to the real data from learners. Section
5 deals with the conclusion derived from the experi-
mental results.
126
Hisakane D. and Samejima M..
A Visualization System of Discussion Structure in Case Method Learning.
DOI: 10.5220/0005025101260132
In Proceedings of the International Conference on Knowledge Management and Information Sharing (KMIS-2014), pages 126-132
ISBN: 978-989-758-050-5
Copyright
c
2014 SCITEPRESS (Science and Technology Publications, Lda.)
2 LITERATURE REVIEW
2.1 Visualization of Discussion
Structure by Graph Representation
In order to improve the discussion, there are some re-
searches on argument diagramming method for facil-
itators (Conklin and Begeman, 1988; Rienks et al.,
2005; Werner and Rittel, 1970). The discussion struc-
ture is visualized by using nodes as opinions and links
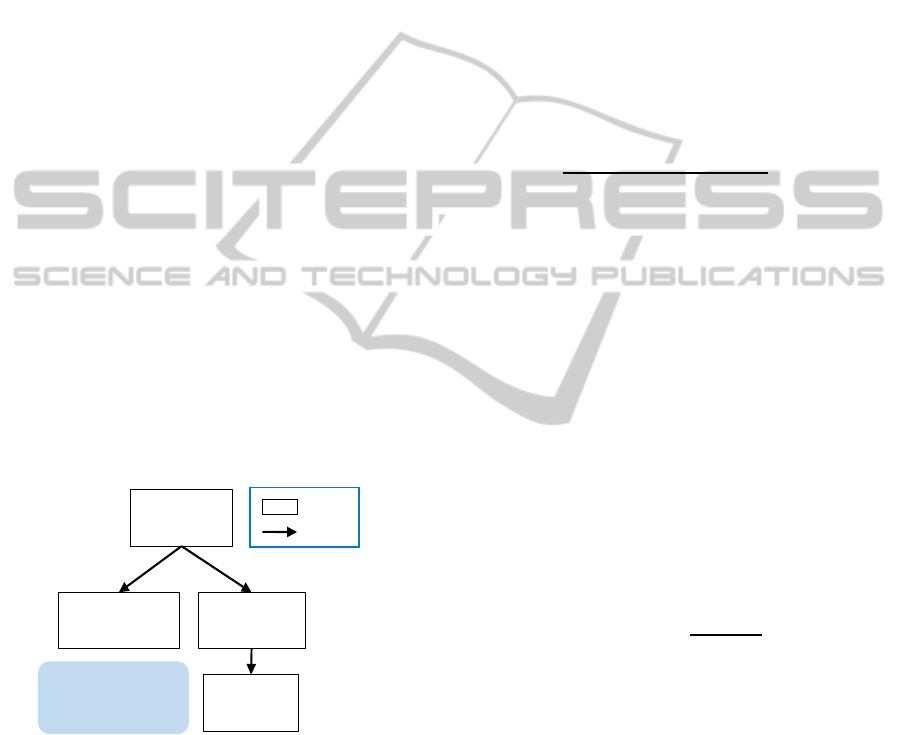
as relations between opinions. Figure 1 shows a graph
representation of an example of discussion structure
by argumentdiagramming. In the graph, an opinion at
the top is related to 2 nodes in parallel. The relations
to the other opinions in the discussion are positive or
negative response, proposal, additional explanation,
and so on (Hobbs, 1990). The facilitator creates links
between two opinions which have such relations. In
the graph of Figure 1, opinions of ‘I think a dolphin
is the most intelligent animal.’ and ‘A monkey is the
most intelligent I think.’ are answers to the opinion of
‘Which animal is the most intelligent?’. And an opin-
ion of ‘A monkey can identify itself in the mirror.’
complements the opinion of ‘A monkey is the most
intelligent I think.’ Watching this graph makes it easy
to understand the progress of the discussion. For the
purpose of supporting discussion without facilitators,
we propose an automatic graph visualization system
of the discussion structure as the previously described
graph.
The node indicates
the answer of the
top node.
Which animal is
the most
intelligent ?!
I think a dolphin is
the most intelligent
animal.!
A monkey is the
most intelligent I
think.!
A monkey can
identify itself in
the mirror.!
!Node"
!Link"
Figure 1: Graph representation of discussion structure.
2.2 Conventional Method of Automatic
Discussion Graph Generation
Zhao et al. proposed a visualization method of the
relation between keywords extracted from the min-
utes of the meeting (Zhao et al., 2006). However,
learners have to comprehend not only the relation be-
tween the keywords but also the relations between
the opinions. So, this conventional method is insuf-
ficient for the learners to understand the discussion
structure. On the other hand, based on the change
of the word frequency in a minute of the discussion,
Matsumura et al. addressed visualizing the relations
of opinions after the discussion (Matsumura et al.,
2003). For n opinions recorded in the minute, let
S
t
(t = 1, 2, ··· , n) denote the tth opinion by a learner.
A set of the series from the 1st opinion to the nth opin-
ion is represented as a window of opinions W(1, n) =
{S
1
, S
2
, S
3
, ··· , S
n
}. Subsequently, a feature vector of
the each opinion V
t
= {I
1t
, I
2t
, I
3t
, · ·· , I
nt
} is calcu-
lated to clarify what the opinion means (Gerard and
McGill, 1983). I
it
(i = 1, 2, 3, ··· , n) represents the
weight of the each ith word w
i
(i = 1, 2, 3, ·· · , n) in
the opinion S
t
by the following formula:
I
it
= tf(w
i
, S
t
)
×
log
t f(w
i
, W(1, n))
tf(w
i
.W(1, n))−tf(w
i
, S
t
)
+1
(1)
where tf (w
i
, S
t
) is the frequency of the word w
i
in
the opinion S
t
and tf(w
i
, W(1, n)) is the frequency
of the word w
i
in the window W(1, n). The conven-
tional method extracts the words from each opinion
by morphological analysis and calculates tf(w
i
, S
t
)
and t f(w
i
, W(1, n)) automatically. Top 20 weights of
words as the significant words are used for the feature
vector words V
t
.
In the discussion, learners often rephrase the past
opinions for summarizing or clarifying past opinions
(Okumura and Takeo, 1994). Because there are sim-
ilar words between an opinion and its rephrased one,
this conventional method identifies the similar words
with thesaurus, unifies the similar words to one word,
and creates links between similar opinions (Hearst,
1997). The similarity is calculated as the following
cosine similarity between V
1
and V
2
:
sim(V
1
, V
2
) =
V
1
·V
2
|V
1
| ·|V
2
|
(2)
If a learner speaks an opinion B long after an opin-
ion A from a learner, the opinions A and B rarely have
a relation each other. So, links should be created to
the recent opinions by calculating similarity between
the opinions. When an opinion is inputted, feature
vectors of all opinions V
t
(t = 1, 2, ·· · , n) are decided
by the formula (1). Then similarities between V
t
and
V
t+1
, V
t+2
, · ·· , V
t+a
(t + a ≤ n) are calculated by the
formula (2) where a is a parameter that indicates how
many recent opinions influence the current opinion. If
the similarity is more than or equal to a certain thresh-
old, the link is created between these opinions.
AVisualizationSystemofDiscussionStructureinCaseMethodLearning
127
2.3 Research Issue
Matsumura’s method visualizes the discussion struc-
ture from a minute after the discussion. The minute is
well written by a secretary with adding some informa-
tion. However, the learners often speak their opinions
with referring the past opinions in discussion. Most
of the opinions include less words than the minutes
include (Fillmore, 2011). So the links are not created
between opinions by the conventional method even if
the opinions have a relation. In order to create the
link, it is necessary to find the related opinions by
not only the similar words but also the other words
such as demonstratives. In addition, the sequence of
opinions would be useful to understand the discus-
sion as people can understand the context from the
sequence of the opinions. We also need to consider
the sequence of opinions to create the link.
3 VISUALIZATION SYSTEM OF
DISCUSSION STRUCTURE
3.1 Outline of the Visualization System
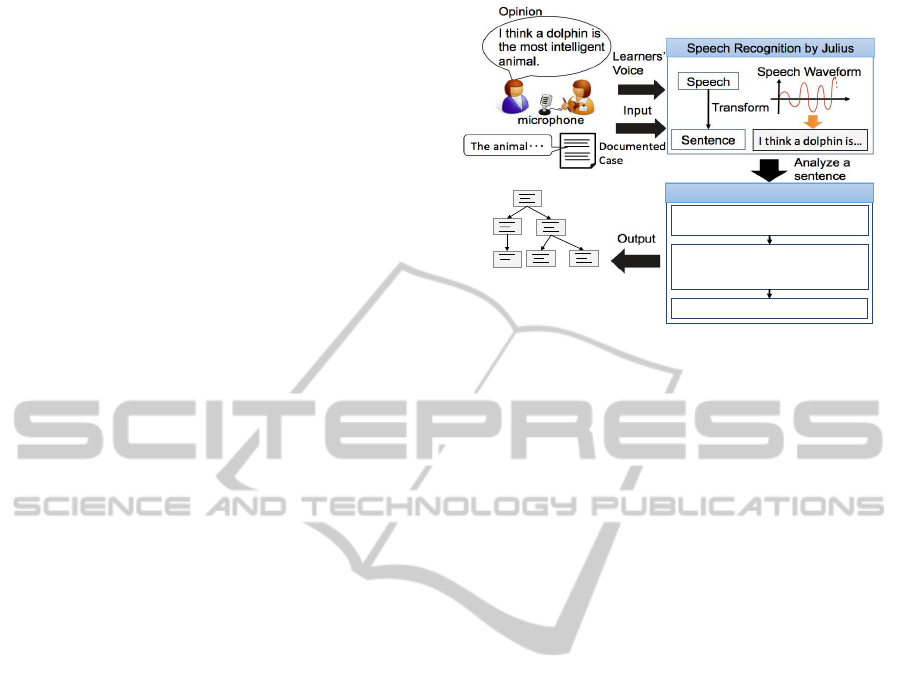
Figure 2 is the outline of our proposed system. The
input of this system is a sequential opinion from learn-
ers through a microphone mounted on the system.
The proposed system converts learners’ voice to a
sentence by speech recognition. We adopted a speech
recognition software ‘Julius’ that is based on large-
scale speech corpus (Lee and Kawahara, 2009). How-
ever, it is known that precision of speech recogni-
tion is not enough to support discussion (Zhao et al.,
2006). So, in order to improve the accuracy, we pre-
liminary input the documented case to the Julius, and
emphasize on the words in the document for speech
recognition by maximum likelihood estimation. This
means that the learners tend to use the words that ap-
pear in the documented case. In this way, accuracy
of recognizing the speech related to the documented
case can be improved.
After extracting nodes as the sentences converted
from learners’ voice, the system identifies the rela-
tion between nodes and visualizes the structure of the
discussion. First, the proposed method identifies the
relation by the dictionary of demonstratives and con-
nectives that indicate the relation between opinions.
Then we apply Matsumura’s method using the simi-
larity between recent opinions. Finally, based on the
sequence of opinions that have been already linked
each other, the proposed system complements links
to the nodes that still have no links.
Analyze a
sentence
!
Learners’
Voice
Output
!
microphone!
Opinion!
I think a dolphin is
the most intelligent
animal.
!
Speech Recognition by Julius!
Speech
Sentence!
Transform!
!"#$%&'"(")*+,$%&"%-.!
Speech Waveform!
Input
/*0123)""
4(-3
!
5$3"(&%2(+"""!
Identify Relation between Nodes!
Use the dictionary of
demonstratives and connectives.
!
Use similarity
between recent opinions
(conventional method).
!
Complement links.!
#!
#!
#!
Graph representation of the
discussion structure
!
Figure 2: Configuration of discussion support system.
In the following sections, we describe the step of
only identifying the relations between nodes because
we have already confirmed that the speech recogni-
tion is well done by the existing tool.
3.2 Graph Visualization by
Demonstratives and Connective
Opinions in the discussion sometimes include demon-
stratives, such as “this”, “that”, “as you said” etc.,
that refer a past opinion. The learners need to under-
stand the past opinion referred by the demonstrative
in order to understand the opinion including demon-
stratives. So the opinions including the demonstra-
tives tend to have a relation to other opinions referred
by the demonstratives. Therefore when the opinions
include the demonstratives, the system identifies the
opinion including a word or a sentence referred by
the demonstrative, and creates a link between them.
In this system, when the opinion has the demon-
stratives, the opinion links with the previous opinion
with assuming that a demonstrative may point to the
previous opinion. In addition, connectives are the
words which represent the relation between the sen-
tences. So the opinions including the connective can
have a relation to the recent opinions.
The proposed system identifies the opinions that
include demonstratives or connectives by keyword
matching to the words in the dictionary that the facili-
tators preliminary define the demonstratives and con-
nectives on. This enables to find the relation between
opinions more accurately.
3.3 Graph Visualization by Similarity
between Recent Opinions
The Matsumura’s method of the visualization of dis-
KMIS2014-InternationalConferenceonKnowledgeManagementandInformationSharing
128
!
t
!
St+1!
St+2! St+3! St+4!
St+5!
Create links
sim(Vt,Vt+1)=0.040
sim(Vt,Vt+2)=0.218 "#θ
sim(Vt,Vt+3)=0.045
sim(Vt,Vt+4)=0.131 "#θ
sim(Vt,Vt+5)=0.065
Threshold θ = 0.1
Calculate similarity!
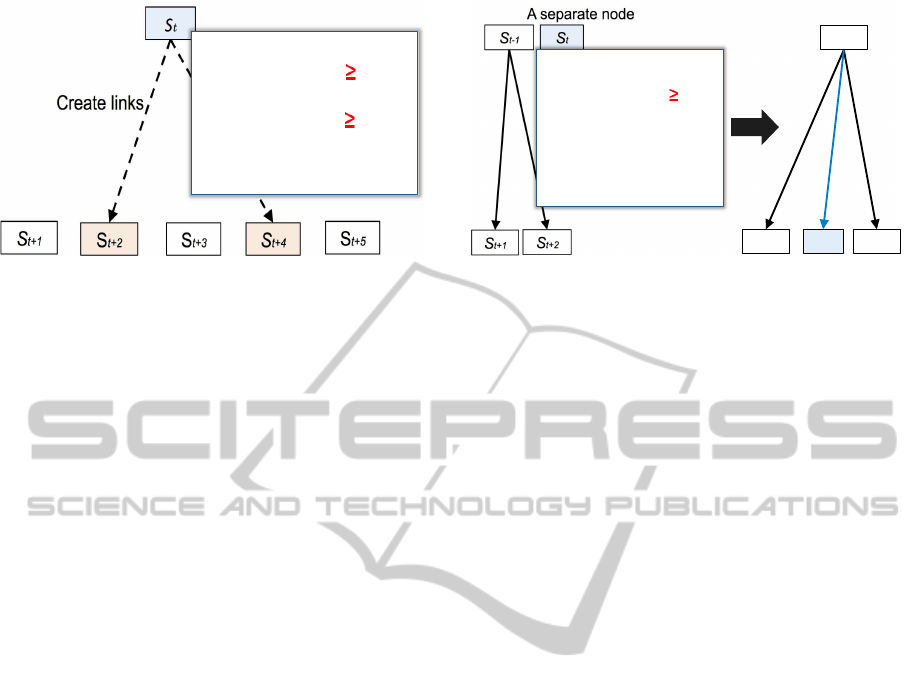
Figure 3: Create links based on the similarity between re-
cent opinions.
cussion structure, introduced in section 2.2, is also
effective to identify the relation between opinions.
So, we apply the conventional method to the opin-
ions. When an opinion is inputted, the system cal-
culates similarity between opinions and creates links
as shown in Figure 3. In the Figure 3, in case of
a = 5 as the number of recent opinions where a opin-
ion has an influence, the similarities between S
t
and
S
t+1
, S
t+2
, · ·· , S
t+5
are calculated. Then links are cre-
ated from S
t
to S
t+2
and S
t+4
because sim(V
t
, V
t+2
)
and sim(V
t
, V
t+4
) are over the threshold θ.
3.4 Link Complement Considering the
Relation in Sequence of Opinions
In discussion, learners often speak their opinions with
referring the past opinions. Even if we visualize the
structure of discussion only by the method of using
demonstratives, connectives, and similarity between
recent opinions, some of links are not created between
opinions because the learners do not always use the
same words for the same meaning. So, the opinions
that have different words from other opinions tend to
be separate nodes. However, as the discussion goes
on, the different similar words are gradually used by
the learners, which increases the similarity and en-
ables to create links with the separate nodes without
any links to other nodes.
So we link the separate nodes to other nodes be-
fore and after the separate node. An opinion of the
separate node may be connected to earlier or later
opinions than the opinion on the separate node by
considering the relation in the sequence of learners’
opinion. Figure 4 shows the process of link comple-
ment. First, the similarity of the separate node to the
other opinions before and after the separate node are
calculated by the formula (2). The number of opin-
ions whose similarities are calculated is the same as
the number of recent opinions a in section 3.2. Be-
cause the separate node has not been linked by the
St-1
!
St+1
!
St
!
St+2
!
A separate node!
sim(Vt,Vt-a)=0.003
!!!
sim(Vt,Vt-1)=0.064 "#θ
"
sim(Vt,Vt+1)=0.014
!!!
sim(Vt,Vt+1)=0.008
Complement threshold
θ’ = 0.05
St-1
!
St+1
!
St+2
!
St
!
Complement
a link!
Calculate similarity!
Figure 4: Complement links into separate nodes.
method described in section 3.2, the similarity of each
separate node must be below the threshold θ. So we
introduce another threshold θ
′
that is smaller than θ
in order to create links with the separate nodes. When
the similarity is more than or equal to threshold θ
′
, a
link is complemented between the nodes. In Figure
4, S
t
is a separate node, and earlier or later opinions
S
t−1
, S
t+1
, S
t+2
have links. Then a new link is created
between S
t−1
and S
t
because the similarity of them is
more than or equal to complement threshold θ
′
.
4 EXPERIMENT
4.1 Outline of the Experiment
In this experiment, we use a documented case that
is really used in an educational institute for project
managers. The documented case describes prob-
lems about delay in information system development
project because of lack of communication in the
project, difficult process of agreement, and so on. We
ask 2 groups of 3 students, Group A and Group B,
to discuss the case for 20 minutes. The numbers of
learners’ opinions in Group A and in Group B are 50
and 65, respectively. During their discussion, a facil-
itator updated the graph of discussion structure auto-
matically using two methods shown in the followings:
• Conventional method : Visualize discussion struc-
ture based on conventional method described in
section 2.2 (Matsumura et al., 2003).
• Proposed method : Visualize discussion struc-
ture using demonstratives and connectives, simi-
larity between recent opinions and link comple-
ment considering the relation in the sequence of
opinions.
In order to evaluate these graphs , we compare the
graphs by both methods to the graph made by a facil-
itator. Total number of the links in the graph made by
a facilitator was 45 for Group A and 57 for Group B.
AVisualizationSystemofDiscussionStructureinCaseMethodLearning
129
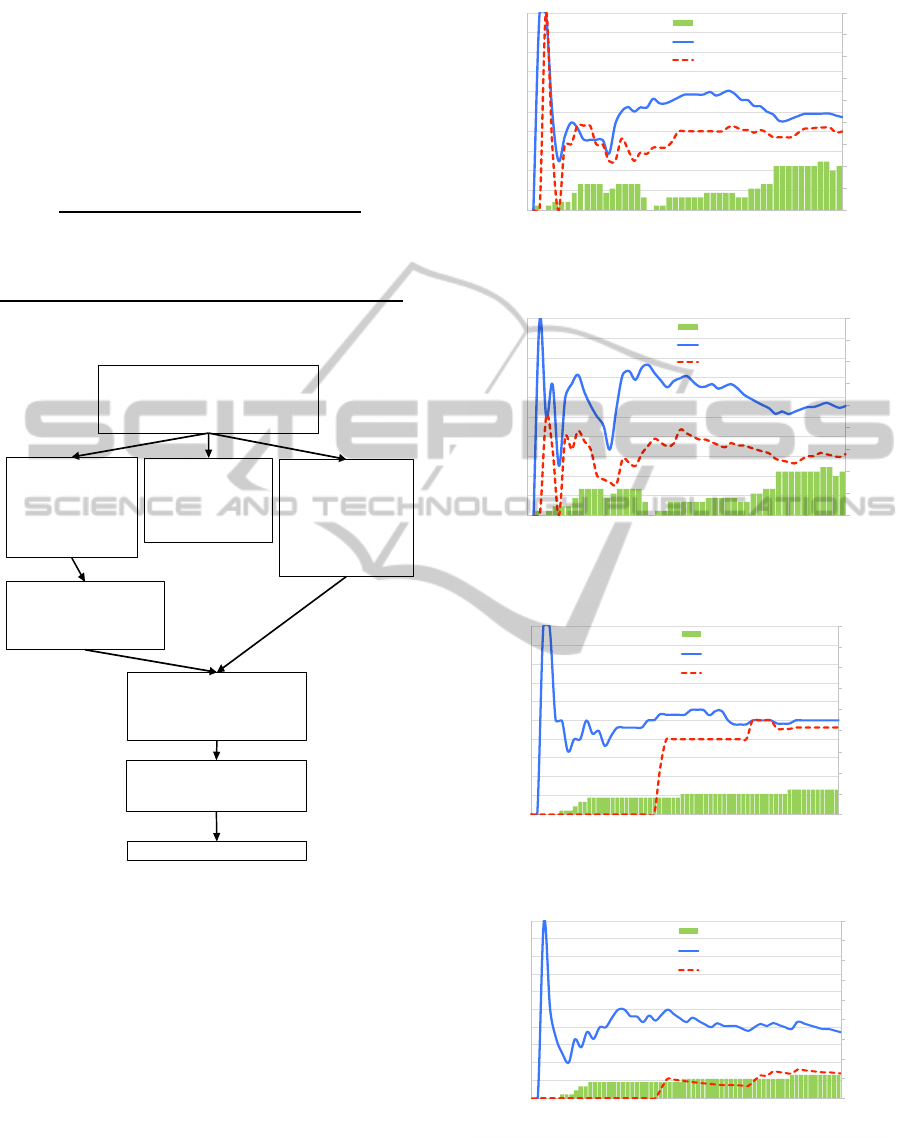
Figure 5 shows the part of the graph made by the facil-
itator for Group A. The nodes are numbered in serial
order. We evaluate these methods by precision rate
and recall rate calculated by the formulas (3) and (4).
We determined a = 5 as the number of recent opinions
where a opinion has an influence, and set thresholds
as θ = 0.1, θ
′
= 0.05.
Precision rate =
The number of links created correctly
Total amount of links
(3)
Recall rate =
The number of links created correctly
The number of correct links judged by a facilitator
(4)
18) The problem is that he result of the
business 2 team is extremely separate
from the plan of the team in the progress
graph of development process.
!
19) This is because the
reader of business 2
team didn’t make a plan
considering the ability of
the team members and
the development scale.
!
20) 2 months have passed, so
changing the leader is one of
the good measure because
the leader is not suitable.
!
21) I think one of the
factor of this problem is
that the development
scale of the business 2
team is the most large.
!
22) The other factor of
this problem is the
members are not told
about detail of this plan
due to the quantity of the
members because new
members increase highly.
!
23) So it is good to change the
leader of this team, and it is also
good to add the members who
assist the new members.
!
24) These members should have
experienced the first plan, who are
in the other team now.
!
25) I have the same opinion as B. !
Figure 5: Graph representation of discussion structure made
by a facilitator for Group A.
4.2 Experimental Result
Figure 6 and 7 show the transition of precision rate
and recall rate by both methods during discussion by
Group A. Figure 8 and 9 show the transition of preci-
sion rate and recall rate by both methods during dis-
cussion by Group B. The number of complemented
links is also shown in both graphs. And the final preci-
sion rate and recall rate after the discussion are shown
in Table 1. According to Figure 6, 7, 8 and 9, the pro-
posed method improves both precision rate and recall
rate during the discussion compared to the conven-
tion method. On average, the proposed method im-
proves both precision rate and recall rate by 5.6% and
0
5
10
15
20
25
30
35
40
45
0%
10%
20%
30%
40%
50%
60%
70%
80%
90%
100%
0 5 10 15 20 25 30 35 40 45 50
# of complemented links!
Precision rate!
Number of speech!
# of complemented links
Proposed method
Conventional method
Figure 6: Transition of precision rate for Group A.
0
5
10
15
20
25
30
35
40
45
0%
10%
20%
30%
40%
50%
60%
70%
80%
90%
100%
0 5 10 15 20 25 30 35 40 45 50
# of complemented links
Recall rate
Number of speech
# of complemented links
Proposed method
Conventional method
Figure 7: Transition of recall rate for Group A.
0
5
10
15
20
25
30
35
40
45
0%
10%
20%
30%
40%
50%
60%
70%
80%
90%
100%
0 5 10 15 20 25 30 35 40 45 50
# of complemented links!
Precision rate!
Number of speech!
# of complemented links
Proposed method
Conventional method
Figure 8: Transition of precision rate for Group B.
0
5
10
15
20
25
30
35
40
45
0%
10%
20%
30%
40%
50%
60%
70%
80%
90%
100%
0 5 10 15 20 25 30 35 40 45 50
# of complemented links!
Recall rate!
Number of speech!
# of complemented links
Proposed method
Conventional method
Figure 9: Transition of recall rate for Group B.
23.8% respectively after the discussion. So precision
rate and recall rate can be improvedby identifying the
relation with demonstrativesand connectives, similar-
KMIS2014-InternationalConferenceonKnowledgeManagementandInformationSharing
130
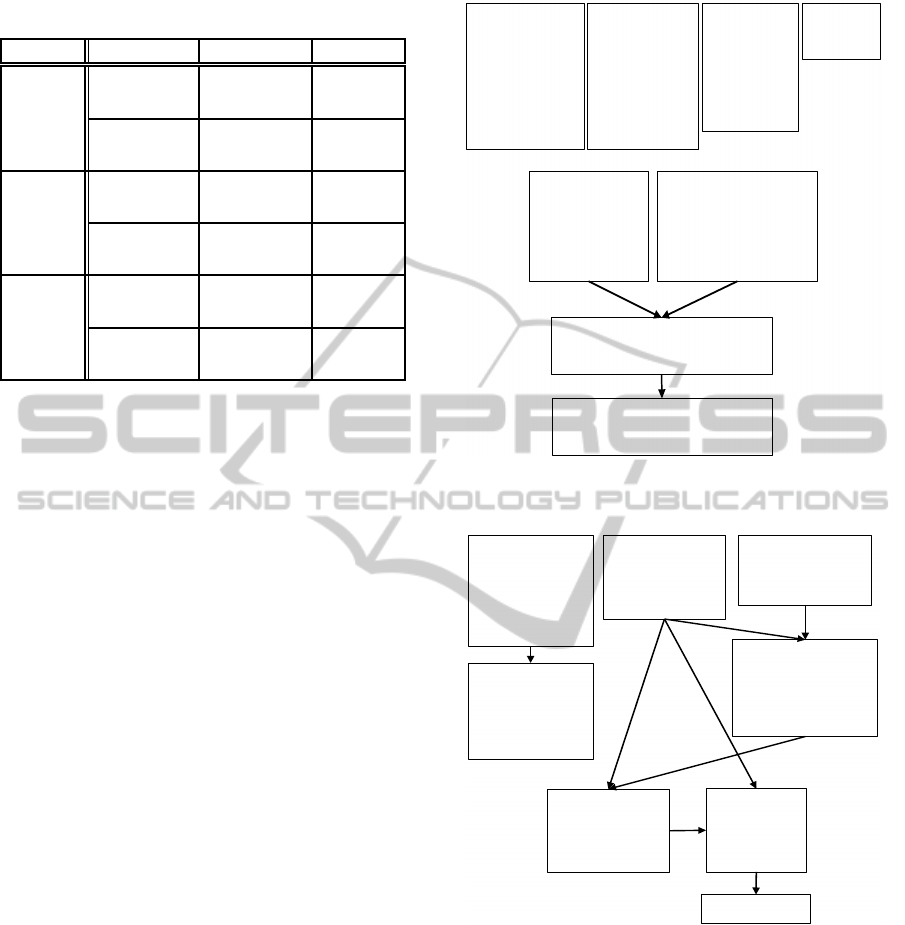
Table 1: Precision rate and recall rate after the discussion.
(B method Precision rate Recall rate
Group A
Conventional
method
14/35
(40.0%)
14/45
(31.1%)
Proposed
method
26/53
(49.1%)
25/45
(57.8%)
Group B
Conventional
method
9/18
(50.0%)
9/57
(15.8%)
Proposed
method
21/41
(51.2%)
21/57
(36.8%)
Average
Conventional
method
44.6% 23.5%
Proposed
method
50.2% 47.3%
ity between recent opinions, and link complement.
The graph of visualized discussion structure by
the conventional method and the proposed method for
Group A are shown in Figure 10 and 11, respectively.
The graph by the proposed method has less separate
nodes than the graph by the conventional method. As
these graphs show, the separate nodes can be reduced
by complementing links considering the relation in
the sequence of learners’ opinions, even if the opin-
ions do not include the same words.
We discuss the effectiveness of additional steps in
the proposed method: creating links by demonstra-
tives and connectives and complementing links by the
sequence of opinions. Focusing on the separate nodes
in Figure 10, we find that opinions of (19) and (21)
include the demonstrative words of “That”, “This”,
and “the same as”. So, these opinions and an opin-
ion of (18) that is linked to (19) can have links to the
other opinions. As shown in Figure 6, Figure7, Fig-
ure 8 and Figure 9, the proposed method can improve
the recall rate and the precision rate during the dis-
cussion compared to the conventional method. This
is because links are complemented by the sequence
of opinions every time a learner speeches a new opin-
ion. At the 8th and 9th opinions in Group A, the pre-
cision rate by the conventional method is a little bit
better than one by the proposed method. But, at the
same opinions, the proposed can improve the recall
rate drastically. Because it is important to visualize
the discussion structure during the discussion, it can
be expected that the proposed system contributes to
supporting the discussion.
Finally, we evaluate the understandability of those
graphs. The graph made by the conventional method
has many nodes that are not connected to any other
nodes. For learners, to see this graph is almost the
same as to see the history of opinions, which makes
18) The problem is
that he result of the
business 2 team is
extremely separate
from the plan of the
team in the progress
graph of development
process.
!
19) This is because
the reader of
business 2 team
didn’t make a plan
considering the
ability of the team
members and the
development scale.
!
20) 2 months have
passed, so changing
the leader is one of
the good measure
because the leader is
not suitable.
!
21) I think one of
the factor of this
problem is that
the development
scale of the
business 2 team
is the most large.
!
22) The other factor of this
problem is the members are
not told about detail of this
plan due to the quantity of the
members because new
members increase highly.
!
24) These members should have
experienced the first plan, who are in the
other team now.
!
25) I have the
same opinion
as B.
!!
23) So it is good to change the leader of
this team, and it is also good to add the
members who assist the new members.
!
Figure 10: Graph representation of discussion structure by
conventional method for Group A.
18) The problem is
that he result of the
business 2 team is
extremely separate
from the plan of the
team in the progress
graph of development
process.
!
19) This is because
the reader of business
2 team didn’t make a
plan considering the
ability of the team
members and the
development scale.
!
20) 2 months have
passed, so changing
the leader is one of
the good measure
because the leader is
not suitable.
!
21) I think one of the
factor of this problem is
that the development
scale of the business 2
team is the most large.!
22) The other factor of
this problem is the
members are not told
about detail of this plan
due to the quantity of the
members because new
members increase highly.
!
24) These
members should
have experienced
the first plan, who
are in the other
team now.
!
23) So it is good to
change the leader of
this team, and it is
also good to add the
members who assist
the new members.
!
25) I have the
same opinion as B.
!!
Figure 11: Graph representation of discussion structure by
proposed method for Group A.
little sense. On the other hand, the graph made by the
proposed method has more node that are connected to
other nodes. It gets easier for learners to understand
the relation.
4.3 Future Issues
As Figure 6, Figure7, Figure 8 and Figure 9 show,
the recall rate and the precision rate are still not so
good even if we apply the proposed method. In the
case method learning, the learners often uses domain-
AVisualizationSystemofDiscussionStructureinCaseMethodLearning
131

specific words such as “parent company”, “sub sys-
tem”, and so on. The proposed system has not found
the relations based on the domain-specific words. As
our future work, we will try to obtain the knowledge
including the domain-specific words from the other
resources, i.e. the documented case, the other lecture
book, wikipedia and so on. In addition, the size of
the graph gets larger than we expects. Some learn-
ers indicate difficulty in finding the past opinions and
their relations. So, contraction of the discussion struc-
ture is also necessary. Furthermore, coloring nodes of
important opinions will help the learners’ understand-
ings.
5 CONCLUSION
We proposed the method identifying opinions which
have relations by demonstrativesand connectives, and
complementing links with the separate nodes by con-
sidering the relation in the sequence of learners’ opin-
ions. In the experiment, on average, we confirmed
that the proposed method could improve both pre-
cision rate and recall rate by 5.6% and 23.8% re-
spectively compared with the conventional method.
Opinions including demonstratives and connectives
are linked with the previous opinion in this method.
However, it is necessary to create links by extracting
the content correctly, so we will improve the method
in the future. In addition, we will develop the method
in order to complement links more precisely.
ACKNOWLEDGEMENTS
This work was partially supported by KAK-
ENHI:JSPS (25730205).
REFERENCES
Brooke, S. L. (2006). Using the case method to teach on-
line classes: Promoting socratic dialogue and critical
thinking skills. International Journal of Teaching and
Learning in Higher Education, 18(2):142–149.
Conklin, J. and Begeman, M. L. (1988). gibis: A hypertext
tool for exploratory policy discussion. ACM Transac-
tions on Information Systems (TOIS), 6(4):303–331.
Fillmore, C. J. (2011). Pragmatically controlled zero
anaphora. In Proceedings of the annual meeting of
the Berkeley Linguistics Society, volume 12.
Gerard, S. and McGill, M. J. (1983). Introduction to Mod-
ern Information Retrieval. McGraw-Hill.
Gragg, C. I. (1951). Because wisdom can’t be told. Inter-
collegiate Case Clearing House.
Hammond, J. S. (1980). Learning by the case method. Har-
vard Business School.
Hearst, M. A. (1997). Texttiling: Segmenting text into
multi-paragraph subtopic passages. Computational
linguistics, 23(1):33–64.
Hobbs, J. R. (1990). Literature and Cognition. Center for
the Study of Language and Information Publication.
Lee, A. and Kawahara, T. (2009). Recent development of
open-source speech recognition engine julius. In Pro-
ceedings of APSIPA Annual Summit and Conference,
pages 131–137.
Matsumura, N., Kato, Y., Ohsawa, Y., and Ishizuka, M.
(2003). Visualization of discussion structure for dis-
covering and understanding discussion points. Japan
Society for Fuzzy Theory and Intelligent Informatics,
15(5):554–564.
Okumura, M. and Takeo, H. (1994). Word sense disam-
biguation and text segmentation based on lexical co-
hesion. In Proceedings of the 15th conference on
Computational linguistics-Volume 2, pages 755–761.
Rienks, R. J., Heylen, D., and van der Weijden. E. (2005).
Argument diagramming of meeting conversations. In
Proceedings of the 7th International Conference on
Multimodal Interfaces, pages 85–92.
Schwarz, R. (2002). The Skilled Facilitator: A Compre-
hensive Resource for Consultants, Facilitators, Man-
agers, Trainers, and Coaches. Jossey-Bass.
Werner, K. and Rittel, H. W. (1970). Issues as elements of
information systems. University of California.
Yamashita, M. (2000). An introduction of facilitation
graphic system for resident’s participation. Architec-
tural Institute of Japan, 73:395–396.
Zhao, Y., Matsumura, M., and Yoshida, M. (2006). Auto-
generation of discussion-map from speech-recognized
minute. In Proceedings of the 20th Annual Conference
of the Japanese Society for Artificial Intelligence.
KMIS2014-InternationalConferenceonKnowledgeManagementandInformationSharing
132
