
Price Responses of Grain Market under Climate Change in
Pre-industrial Western Europe by ARX Modelling
Qing Pei
1
, David Dian Zhang
1
and Jingjing Xu
2
1
Department of Geography, The University of Hong Kong, Hong Kong, China
2
PricewaterhouseCoopers, Hong Kong, China
Keywords: ARX Modelling, Climate Change, Grain Market, Pre-Industrial Era, Western Europe.
Abstract: In academia, there are few studies adopted ARX modelling on historical datasets. Recently, the studies on
notable effects of climatic changes upon past agrarian economy are paid by more attention. Here, this study
first time seriously explores the relationship between climatic change and the grain market at a macro-scale
in pre-industrial Western Europe by ARX modelling. The results show that a cold phase would raise grain
price through lowering the supply in the grain market. Furthermore, according to the simulations on short-
and long-term climate change, the long lasting climate change could be more disastrous to society than
short-term change. Last, the application in the study proves ARX modelling is also a feasible choice in the
field of historical research.
1 INTRODUCTION
ARX, an autoregressive model with exogenous
elements, can capture and reflect the variations in
the temporally changing systems (Qin et al, 2010).
This method is also useful in simulating the
influence of past conditions and external systems on
changing temporal factors (Hamilton, 1994).
Moreover, the ARX model is regarded as extremely
suitable for control theories with a simpler
estimation in the field of signal studies and
engineering (Huusom et al, 2010). However, there is
few studies of application so far to adopt this
statistical method to simulate the historical dataset
(Pei et al, 2013).
In recent years, the studies on the notable effects
of climatic changes upon past agrarian economy
have attracted lots of attention in academia. Among
different social-economic sectors, the grain market is
the most sensitive to climate change because
agricultural production is highly dependent on
climatic conditions (IPCC, 2013). This was
especially true in the past agrarian era (Beveridge,
1921). Surprisingly, these historical climatic impacts
in relation to human agrarian society at a large
spatial and long-term scale have been academically
neglected from a quantitative perspective (Zhang et
al, 2013), though important attempts recently have
been made to use high-resolution palaeo-climatic
records to explain several pre-historical social-
economic changes in certain time periods of past
society, which is studied at the level of cases (An et
al, 2005; deMenocal, 2001; Polyak, 2001).
Under this background, the proposed study will
focus on the impact of climate change on the grain
market in pre-industrial Western Europe from AD
1500 to 1800. This study first time seriously
explores the relationship between climatic change
and the grain market at a macro-scale in pre-
industrial Western Europe by ARX. In the
meantime, ARX could also be evaluated with its
application to historical research. Furthermore, ARX
is significantly useful to examine the temporal
patterns of changes at the both short- and long-term
scale. Through the check on short- and long-term of
climatic impact, the vulnerability of the grain market
under climate change could be further uncovered as
well.
The quantitative analyses justify that the
reduction of thermal energy input during a cold
phase would raise the grain price and lead to price
crisis through decreasing the agricultural supply in
the grain market. According to the examinations on
both long-term and short-term climate change, the
study finds that the long lasting climate change
could be more disastrous to society than short-term
variations, particularly at the large spatial scale.
811
Pei Q., Zhang D. and Xu J..
Price Responses of Grain Market under Climate Change in Pre-industrial Western Europe by ARX Modelling.
DOI: 10.5220/0005025208110817
In Proceedings of the 4th International Conference on Simulation and Modeling Methodologies, Technologies and Applications (MSCCEC-2014), pages
811-817
ISBN: 978-989-758-038-3
Copyright
c
2014 SCITEPRESS (Science and Technology Publications, Lda.)

2 DATA AND METHODOLOGY
2.1 Study Region
The Western Europe in the study includes Albania,
Belgium, Britain, Denmark, France, Germany,
Greece, Portugal, Ireland, Italy, Netherland,
Scotland, Spain, and Switzerland. This area is also
overlapping the Temperate Region based on Koppen
Climate Classification (Gerstengarbe and Werner,
2008).
2.2 Temperature
In pre-industrial society, agricultural production
closely depended on climate. A cooling and variable
climate can bring serious problems for food
production, especially in the high and middle
latitudes (Galloway, 1986). Temperature is a better
indicator at a large scale (Jones and Bradley, 1992)
and is most essential to plant growth (Mathias,
1990). Besides, cooler period is associated with
greater variability in the short-term weather (Bryson
and Murray, 1977; Gribbin and Lamb, 1978).
Therefore, based on historical survey, the price of
grain market has been pointed to highly correlate
with temperature (Lamb, 1995).
2.3 Population
Population is an interesting and crucial research
topic in academia, because population always is
assumed to play dual roles: labour and consumer.
The population changes relate with social ability and
contribute to the food productions (Robinson, 1959).
This discussion leads to two possible relations
between price and population. If the population acts
as the labour, then relation will be negative. Because
the more the available labour, the more supply will
be realized. The affluent supply in the market will
push the price decline. However, if the population
plays as consumer, the relation will be positive. The
price in the market certainly can be driven higher by
more demand.
2.4 Real Price
In economics, real price or sometime is also used as
the name of relative price, is a fundamental concept
for study of economics, especially in micro-
economics. The inflation in the business cycle could
keep raising the price level, which changes the
money value in the real world (Spencer and Orley,
1993). Hence, the real price must be adopted to
correct the inflation rate, particularly when studying
the prices over time in the long run (Pindyck and
Rubinfeld, 1995). The nominal price or so-called
money price could not reflect how costly it is in
reality (Browning and Zupan, 1996). Through
adopting the real price (relative price) into the
analysis, it could avoid the influences from other
commodities in the market and keep the consistently
to reflect the commodities value (Landsburg, 1999).
Therefore, in this study, the real price is adopted for
the analysis. In this study, the study period is from
AD 1500 to 1800.
2.5 Data Source
In recent years, scientists around the world have
carried out intensive research on past climate
change, increasingly using multi-proxy data
networks to reconstruct past climate variations in
terms of temperature anomaly. As suggested by
Zhang et al. (2007), Osborn’s (2006) temperature
anomaly series and Luterbacher’s palaeo-climate
reconstructions (Luterbacher et al, 2004) over the
AD 1500 to1800 were apt to be chosen together to
carry out the quantitative analysis.
In this study, population size of Europe was
extracted from McEvedy and Jones’ (1978) Atlas of
World Population History. This is a remarkably
accurate work, which have been repeatedly used by
other scholars.
The cited price data and CPI data in the study is
all from the International Institute of Social History
Database and Allen - Unger Database European
Commodity Prices AD 1260-1914. The price data
covers four types of grains (wheat, rye, barley, and
oats). The price and CPI data are from major
European regions: Amsterdam and Holland,
Antwerp and Belgium, Augsburg, Leipzig, London
and Southern England, Madrid and New Castile,
Munich, Naples, Northern Italy, Paris, and
Strasbourg. Figure 1 shows the curves of each data
series in the study.
3 RESULTS
In the study, the ARX modelling is adopted to
simulate the price responses under climate change in
pre-industrial Western Europe systematically. The
final modelling is selected based on whole
consideration of Residual Analysis, Parameter
Analysis and R
2
. Based on criteria of model
selections, the following model is chosen as the
SIMULTECH2014-4thInternationalConferenceonSimulationandModelingMethodologies,Technologiesand
Applications
812

fitted model for European grain market from AD
1500 to 1800. The results are shown in Table 1.
Based on the modelling results, a cold phase
would raise grain price through lowering the supply
in the grain market, while the mild climate would be
favourable to agrarian economy.
In the meantime, the population is acting as role
of farmer in the study period. The simulation results
do not imply that population in pre-industrial
Western Europe did not act as consumer at all in the
past. However, the role of producer exceeds the role
of consumer in the long term.
4 DISUCUSSION
4.1 Annual Impact of Climate Change
First, the impact of climate on the grain market
virtually exists. The statistical model results are
consistent with the literature survey. The hypothesis
of study is not only theoretically sound, but also
quantitatively verified.
Second, the fluctuation rate in temperature will
be enlarged when it impacts on the grain market,
based on the modelling. The larger the temperature
changed, the larger price change would be,
according to the pattern of ARX modelling results.
Besides, based on the modelling results, the
interaction between climate change and grain market
is not a linear process, though it is due to the
modelling design in the research. However, as
pointed out, the process of climate change can be
non-linear (Schneider, 2004), and its corresponding
effect on the socioeconomic system can also reflect
non-linear patterns (Adger et al, 2009). Therefore,
following the current research on climate change
issues, price and temperature can be considered
exponential functions according to our statistical
results as well as to our studies.
4.2 Long Term Impact of Climate
Change
In order to examine the long term impact of
temperature parameter, the time series theory should
be reviewed. Generally, the ARX model can also be
written by the formula transformation, which is
listed in the Section of “Equations”.
Based on the result, the impact of climate change
from year t will be lasting long in the following year.
Furthermore, attenuation speeds of obvious climatic
impact last 10 years according to Figure 2. After 10
year, the impact is almost equal to zero. The
attenuation speeds of temperature impact show the
buffering capacity of human society to relieve the
climatic impact gradually though still exists for 10
years. This result justified again that the pre-
industrial Western Europe could try to make the
adaptation and relief to the climate change, while
with limited effectiveness. However, compared to
whole Europe of 25 years lasting effect (Pei et al,
2013), the higher population density makes Western
Europe is more vulnerable to climate change.
Due to the low speed of attenuation, cooling
impact could pile up, especially during the long term
cooling period. In the short-term (several years),
those social buffers are effective in stabilizing grain
prices. However, institutional and social buffering
mechanisms would be ultimately exhausted by the
recurrent subsistence crises caused by long term-
cooling (Orlove, 2005). Worldwide empirical studies
also have revealed that in the face of persistent
agricultural shortages induced by long-term cooling,
social buffers ultimately became ineffective and
were unable to prevent social-economic crisis (Lee
et al, 2008; Pei et al, 2014; Zhang et al, 2007).
Therefore, the long lasting climate change could be
more disastrous to society than short-term climate
variations.
Lastly, in addition to above theoretical
implications of a specific field, the simulation in the
study proves that ARX modelling is a feasible
choice in the field of historical research.
5 CONCLUSIONS
Climate change has played a very important role in
Western European agrarian economy in the pre-
industrial era. The current study first time adopts
ARX modelling to scrutinize climate-economy
association in pre-industrial Western Europe AD
1500-1800. This study fills the gap in previous
quantitative analyses about the short- and long-term
effect of climate change on past agrarian economies.
Through the statistical analysis, temperature is
important to economy of pre-industrial Western
Europe at a large spatial scale. In the short term,
cooling climate could cause high prices because of
poor production and scarcity in the grain market.
The larger the changes in temperature, the larger the
price changes are, which shows the non-linear
interaction between climate and economy in the
past. In the long term, the impact from climate
change could last around 10 year, which reflects the
social buffering capacity. The long term climatic
impact, especially 10 year or even longer could pile
PriceResponsesofGrainMarketunderClimateChangeinPre-industrialWesternEuropebyARXModelling
813
up and finally destroy the economic equilibrium. In
consequence the long last climate change could be
more disastrous to society in the past era.
The findings of this study do not refute other
theories on climate change and economic
mechanism in history. This study is different from
its predecessors in terms of both temporal scale and
hierarchies of reasoning (levels of quantitative
association). The long-term economic mechanism is
embedded in a complex system that includes both
environmental and social components. Any complex
system is determined by different factors at different
spatial-temporal scales (O’Neill et al 1989; Norton,
and Ulanowicz, 1992). At a given spatial-temporal
scale, some processes are more fundamental than the
rest in the system (Tilly, 1984; Pei and Zhang,
2014). Other economic theories generated from case
and short-term studies have been limited by their
spatial-temporal scales. The explanation and
generalization to long term economic mechanism in
this study may, of course, not be appropriate in other
studies with different temporal scales.
We explored the long historical consequences of
climate change by examining the high-resolution
frequency and time domains of different time series.
The characteristics of this large unit are not simple
combinations of the attributes of small units but
demonstrate the climatic impacts on economic
fluctuations, which is a new theory of economic
change. Hence, this study is an innovative way of
identifying dominant causes in social and historical
processes across a broad range of temporal scales.
Research concerning scale in the social sciences has
been criticized as being insufficiently explicit and
precise due to its complexity (Gibson et al, 2000).
Nevertheless, our accurate and comprehensive
explanation of a complex system reveals that social
science research is capable of attaining the standards
applicable to physical scientific research by using
novel quantitative methods and scientific thought.
TABLE
Table 1: ARX Model in Western Europe at lag=2
(Significant level = 90%).
Estimate SE t Sig.
Constant
-1.012 0.469 -2.156 0.032
LnRP AR Lag 1
0.860 0.058 14.858 0.000
Lag 2
-0.143 0.058 -2.477 0.014
Tem Lag 0
-0.015 0.009 -1.712 0.088
LnPop Lag 0
-0.195 0.110 -1.769 0.078
Stationary R
2
=0.616
FIGURES
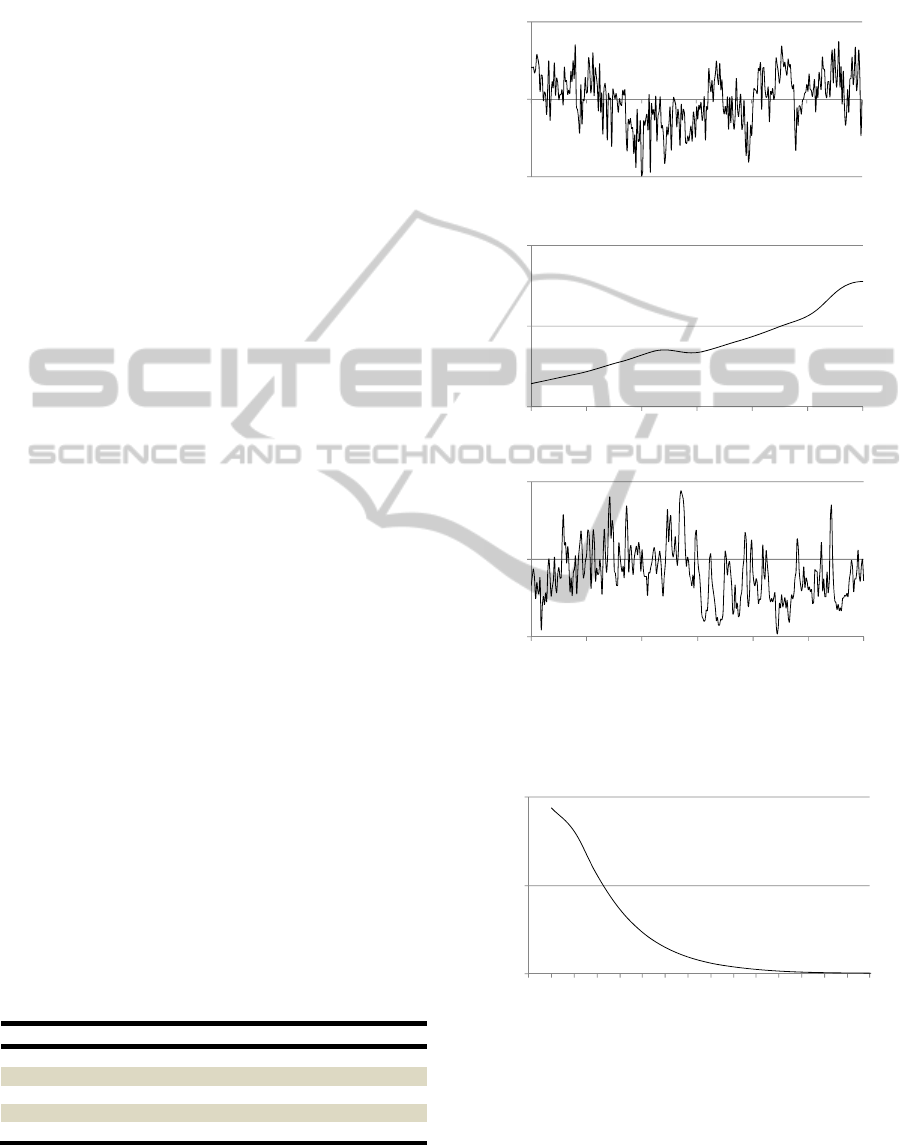
Figure 1: Climatic changes and parameters of grain market
in Europe, AD 1500-1800. (a) Normalized temperature
change records in Europe. (b) Western European
population size. (c) Real grain price of Western European.
Figure 2: Decline rate of temperature impact in the long
term.
-2.3
0
2.3
1500 1550 1600 1650 1700 1750 1800
(a)
0.1
0.175
0.25
1500 1550 1600 1650 1700 1750 1800
(c)
40
80
120
1500 1550 1600 1650 1700 1750 1800
(b)
0
0.008
0.016
0123456789101112131415
SIMULTECH2014-4thInternationalConferenceonSimulationandModelingMethodologies,Technologiesand
Applications
814

EQUATIONS
Then the base year is set as AD 1500. It is calculated
as follows:
BaseYear
t
t
t
CPI
R
PP
CPI
(1)
tt
XYB
)(
(2)
Where:
)(B
is the backward equation for {Y
t
}
t
X
is the regression part of ARX
tt
tt
XBY
X
B
Y
)(
)(
1
)0(
(3)
Where:
0
)0(
0
)0()0(
)(
1
)(
j
jtjt
j
j
j
XYB
B
B
(4)
Here the time point t-m is the time point when
abnormal phenomena happened, then the impact on
the following year Y
t
is calculated as below:
1)(
)(
1
0
)0(
0
)0(
j
j
j
j
j
j
BBB
B
(5)
The ARX in the article is an ARX (2) model.
Then,
2
...
0
0
1
1
1)]()(1[
)0(
22
)0(
11
)0(
)0(
02
)0(
11
)0(
2
)0(
01
)0(
1
)0(
0
0
2)0(
2
0
1)0(
1
0
)0(
0
)0(2
21
R
BBB
BBB
RRR
j
j
j
j
j
j
j
j
j
j
j
j
(6)
Where:
2143.0860.0
143.0
860.0
)0(
2
)0(
1
)0(
2
1
R
RRR
(7)
Based on the above calculation process, with the
consideration of ARX model fitted, the final
expression of temperature change impact in year t on
the following year is as below.
...3,2,1,2
)015.0(]143.0860.0[
ln
)0(
2
)0(
1
jR
Tem
RP
RR
t
jt
(8)
REFERENCES
An, C.-B., Tang, L., Barton, L., & Chen, F.-H. (2005).
Climate change and cultural response around 4000 cal
yr B.P. in the western part of Chinese Loess Plateau
Quaternary Sciences, 63(3), 347-352.
Adger W. N., Dessai S., Goulden M., Hulme Mand others
(2009) Are there social limits to adaptation to climate
change? Climate Change 93:335-354.
Beveridge, W. H. 1921. "Weather and Harvest Cycles."
The Economic Journal, 31(124), 429-52.
Browning, E. K., & Zupan, M. A. (1996). Microeconomic
theory and applications (5th ed.). New York:
HarperCollins College Publishers.
Bryson, R. A., & Murray, T. J. (1977). Climates of
hunger: mankind and the world's changing weather.
Madison, USA University of Wisconsin Press.
David D. Zhang, Harry F. Lee, Cong Wang, Baosheng Li,
Jane Zhang, Qing Pei, Jingan Chen. 2012. Climate
Change and Large Scale Human Population Collapses
in the Pre-industrial Era. Global Ecology and
Biogeography. DOI: 10.1111/j.1466-
8238.2010.00625.x.
deMenocal, P. B. (2001). Cultural responses to climate
change during the late Holocene. Science, 292, 667-
673.
Galloway, P. R. (1986). Long-term fluctuations in climate
and population in the preindustrial era. Population and
Development Review, 12(1), 1-24.
Gerstengarbe, F.-W. and Werner., P.C., 2008. A short
update on Koeppen climate shifts in Europe between
1901 and 2003. Climatic Change, 92: 99-107.
Gibson, C. C., Ostrom, E. & Ahn, T. K. (2000) The
concept of scale and the human dimensions of global
change: a survey. Ecological Economics 32, 217-239.
Gribbin, J., & Lamb, H. H. (1978). Climatic change in
historical times. In J. Gribbin (Ed.), Climatic Change
(pp. 68-82). Cambridge: Cambridge University Press.
Hamilton JD (1994) Time series analysis. Princeton
University Press, Princeton, NJ.
Huusom J. K., Poulsen N. K., Jørgensen S. B., Jørgensen
JB (2010) ARX-model based model predictive control
with offset-free tracking. In: Pierucci S, Ferraris GB
(eds) 20th European Symposium on Computer Aided
Process Engineering, Naples. Elsevier, Amsterdam, p
601–606.
IPCC (2013) Climate Change 2013: The Physical Science
Basis, Vol. IPCC Working Group I Contribution to
AR5, Stockholm.
Jones, P. D. and Bradley, R. S., 1992. Climatic variations
in the longest instrumental records. In: R.S. Bradley
and P. D. Jones (Editors), Climate since A. D. 1500.
Routledge, London.
Lamb, H. H., 1995. Climate, history and the modern
world. Routledge, London.
Landsburg, S. E. (1999). Price theory and applications (4th
ed.). Cincinnati, Ohio: South-Western College Pub.
Lee, H. F., Fok, L. and Zhang, D. D., 2008. Climatic
change and Chinese population growth dynamics over
the last millennium. Climatic Change, 88(2): 131-156.
PriceResponsesofGrainMarketunderClimateChangeinPre-industrialWesternEuropebyARXModelling
815

Luterbacher, J., Dietrich, D., Xoplaki, E., Grosjean, M., &
Wanner, H. (2004). European seasonal and annual
temperature variability, trends and extremes since
1500. Science, 303, 1499-1503.
Mathias, R. J., 1990. Factors Affecting the Establishment
of Callus Cultures in Wheat. In: Y.P.S. Bajaj (Editor),
Wheat. Springer, Heidelberg, Germany, pp. 35.
McEvedy, C., & Jones, R. (1978). Atlas of World
Population History. London, UK: Allen Lane.
Norton, B. G. & Ulanowicz, R. E. (1992) Scale and
biodiversity policy: a hierarchical approach. Ambio
21, 244-249.
O'Neill, R. V., Johnson, A. R. & King, A. W. (1989) A
hierarchical framework for the analysis of scale.
Landscape Ecology 3, 193-205.
Orlove, Ben. 2005. "Human Adaptation to Climate
Change: A Review of Three Historical Cases and
Some General Perspectives." Environmental Science
& Policy, 8(6), 589-600.
Osborn, T. J., & Briffa, K. R. (2006). The Spatial Extent
of 20th-century Warmth in the Context of the Past
1200 Years. Science 311, 841 - 844.
Pei Q., Zhang D. D. (2014) Long-term Relationship
between Climate Change and Nomadic Migration in
Historical China. Ecology and Society 19:68.
Pei Q., Zhang D. D., Lee H. F., Li G. (2014) Climate
Change and Macro-Economic Cycles in Pre-Industrial
Europe. PLoS ONE 9:e88155.
Pei Q, Zhang DD, Li G, Lee H. F. (2013) Short and long
term impacts of climate variations on the agrarian
economy in pre-industrial Europe. Climate Research
56:169-180.
Pindyck, R. S., & Rubinfeld, D. L. (1995)
Microeconomics (3rd ed.). Englewood Cliffs, N.J.:
Prentice Hall.
Polyak, V. J., & Asmerom, Y. (2001). Late Holocene
climate and cultural changes in Southwestern United
States. Science, 294, 148-151.
Qin P, Nishii R, Nakagawa T, Nakamoto T (2010) ARX
models for time-varying systems estimated by
recursive penalized weighted least squares method.
Journal of Mathematics in Industry 2: 109−114.
Robinson, W. C. (1959). Money, Population and
Economic Change in Late Medieval Europe. The
Economic History Review, 12(1), 63-76.
Schneider S. H. (2004) Abrupt non-linear climate change,
irreversibility and surprise. Global Environmental
Change 14:245-258.
Spencer, M. H., & Orley M. Amos, J. (1993).
Contemporary economics (8th ed.). New York: Worth
Publishers.
Tilly, C. (1984) Big Structures, Large Processes, Huge
Comparisons. Russell Sage Foundation.
Zhang, D. D., Brecke, P., Lee, H. F., He, Y. Q., & Zhang,
J. (2007). Global Climate Change, War, and
Population Decline in Recent Human History.
Proceedings of the National Academy of Sciences of
the United States of America, 104(49), 19214-19219.
APPENDIX
Abbreviations and Acronyms
RP represents real grain price.
CPI stands for Consumer Price Index.
P represents nominal grain price.
t is the time step and the base year is AD 1500.
LnRP stands for ln value of real grain price.
Tem stands for temperature.
LnPop stands for ln value of population size.
Units
Temperature: δ, it is anomaly of past temperature
reconstructions.
Real price: Ag Gram/liter.
Population size: million.
Expression of Regression Modelling
The Classic Linear Regression Model is expressed
as below:
nixxxy
iippiii
,...3,2,1...
22110
There are p+1 parameters will be estimated. In
matrix terms this becomes:
+XY
Where:
n
n
npnnn
p
p
p
i
n
xxxx
xxxx
xxxx
xxxx
X
y
y
y
y
Y
...
...
...1
..................
...1
...1
...1
...
3
2
1
3
2
1
0
321
3333231
2333221
1131211
3
2
1
The most commonly used criterion to estimate
the parameters in the regression model is the
principle of Least Squares, which involves
minimizing the sum of Residual Square.
The regression model will be worked out as
below:
pp
xxxy
ˆ
...
ˆˆˆ
ˆ
22110
SIMULTECH2014-4thInternationalConferenceonSimulationandModelingMethodologies,Technologiesand
Applications
816

Expression of AR Modelling
If the time series is autoregressive process, then
a general time series will be obtained.
ptpttt
YYYY
...
2211
{Y
t
} is a mixed autoregressive process of orders
p, that is AR (p) model. {Y
t
} is the observed value at
time t.
Expression of ARX Modelling
The ARX modelling is realized by above two
parts: regression and AR.
ni
YYYxxxY
tptpttippiit
,...3,2,1
......
221122110
Through model parameter estimation, the above
ARX model will be expressed as below:
ptpttppt
YYYxxxY
ˆ
...
ˆˆˆ
...
ˆˆˆ
221122110
PriceResponsesofGrainMarketunderClimateChangeinPre-industrialWesternEuropebyARXModelling
817
