
Quantitative Evaluation of Accuracy of Digital Microscope System
for Automated Petrographic Analysis
Olga E. Baklanova
1
, Vyacheslav A. Kornev
2
and Olga Ya. Shvets
2
1
Department of Mathematical and Computer Modelling, D.Serikbayev East-Kazakhstan State Technical University, 19,
Serikbaeva Street, Ust-Kamenogorsk, The Republic Kazakhstan
2
Department of Instrument Engineering and Technology Automation, D.Serikbayev East-Kazakhstan State Technical
University, 19, Serikbaeva Street, Ust-Kamenogorsk, The Republic Kazakhstan
Keywords: Petrographic Analysis, Digital Microscopy, Image Recognition, Evaluation of Reliability, Machine Vision,
a Rock Sample.
Abstract: The purpose of this paper is quantitative estimation of the reliability of digital microscopy systems for
automated petrographic analysis. The proposed method consists in measuring the intensity of the three
spectral components of the reflected light (red, green, blue) in each pixel of the investigated surface (frame)
and using of methods of pattern recognition of images in geological and mineralogical researches of a rock
sample. The proposed technology is offered for preparation of a rock sample in system to a quality and
quantitative standard of the maintenance minerals with use of technical sight and software for increase of
reliability of results. Statement of the problem is the following: it is necessary to develop a model for
assessing the reliability of the monitoring process, taking into account the statistical nature of standards for
petrographic analysis and using system process control agents. Mathematical models of an assessment and
forecasting of reliability measuring system and control of the maintenance useful minerals in studied a rock
sample are developed.
1 INTRODUCTION
Petrography is the science that studies the material
composition of the rocks. Unlike minerals, rocks are
aggregates composed of different minerals (Blatt
and Robert, 1995).
Minerals are homogeneous in composition and
structure of the rocks and ores. They are natural
chemical compounds resulting from various
geological processes. Historically minerals initially
determined by color and shape. However, the
reliability of the color diagnostics minerals
traditional visual methods is extremely low and the
color differences even can be misleading. In this
case, the diagnosis only color minerals do not solve
the problem of quantifying the content of useful
component in the rock, which is extremely important
in practice (Farndon, 2006).
Using math methods and achievements of
modern computer technology allow to improve
significantly the accuracy of not only the process of
monitoring and diagnosing, but also to quantify the
mineral content in the sample of rock. But we have
another important task - assessment of reliability
process of structural and mineralogical studies
(Baklanova and Uzdenbaev, 2013).
Reliability of research depends on several
factors:
- Natural variations and mineral color;
- Structures of errors in technology of mineral
color parameters measurement;
- Errors in measurement and control standards
and control techniques for measuring color
diagnostic indicators;
- Uncertainty normative values in quantifying
evaluation system for color diagnostic indicators.
Accuracy of control, diagnosis and decision-
making system in the petrographic analysis can be
enhanced by the presence of a database with
information on the location test sample rocks,
geological landscapes and associated pore rows. For
example, gold often meets with milky quartz.
Minerals that occur together are called associated
with (Farndon, 2006).
560
Baklanova O., Kornev V. and Shvets O..
Quantitative Evaluation of Accuracy of Digital Microscope System for Automated Petrographic Analysis.
DOI: 10.5220/0005025705600566
In Proceedings of the 4th International Conference on Simulation and Modeling Methodologies, Technologies and Applications (SIMULTECH-2014),
pages 560-566
ISBN: 978-989-758-038-3
Copyright
c
2014 SCITEPRESS (Science and Technology Publications, Lda.)

2 MATHERIALS AND METHODS
The proposed method consists in measuring the
intensity of the reflected spectral components of
three colors (red, green, blue) at each pixel of the
surface under study (frame) of a rock sample.
Rock sample is subjected to a pretreatment and
preparation of the surface to be scanned, for example
in the form of ore. There is another way in the
literature to expose the sample pulverized and filling
in some container (Clarke and Eberhardt, 2002).
Then substance surface in the container milled
powder mass is formed by manual compression.
Technological prepared surface is scanned by digital
optical microscope and conserved in three pixel
arrays for each color (Panteleev, Egorova and
Klykova, 2005.).
Array elements are equivalents color levels in
each pixel. Meets or does not meet the three color
pixel for mineral composition will depend on the
measured intensities of red, green and blue pixel
admissible set for this mineral. The pixels in the
frame, in which all three colors after the count rated
intensities of color, were in the tolerances for each
color, we denote as - to
,
,
.
Lower and upper tolerable color values denoted
as -
,
,
,
,
,
, where:
-
,
- the lower and upper values of
tolerance red intensity;
-
,
- the lower and upper values of
tolerable intensity of green color;
-
,
- the lower and upper values of
tolerance blue intensity.
Number of pixel in their color tolerable
boundaries in j - th frame (j = 1, L) is denoted as
,
,
. In this collection necessary to select
and register only those pixel, that both were in their
color standards and denote their number in the j-th
frame as
. Then, at a certain scanning area and
discontinuity (resolution) becomes aware of the
microscope and the total number of pixels in this
square - M. This area throughout the study should be
constant. Ratio
will be intermediate relative
diagnostic assessment of mineral content in the j -
m frame, the test sample on the basis of the color.
Quantity required observations (number of
investigated frames) is determined according to
known mathematical statistics method depending on
the variability of the measured parameter, the
resolution of the microscope, and some other factors
which can be identified in the study.
Each next observation begins with the mixing of
the powder mass analyzed rocks. Upon completion
of the entire cycle of L observations, the results are
statistically treated camping, and calculated the
mean value of Sср some numerical estimates of the
average mineral content in the sample breed closely
related to the actual content of the mineral.
It is necessary to make measuring the content of
useful mineral rocks in the volume measurement of
mineral known metrological attorneys’ means, such
as spectral for going from the relative valuation to
some absolute. Evaluation of the content of the
mineral spectral methods denoted as Y. Based on
spectral estimation Y can recalculate color index in
conventional bulk or weight.
One of the tasks in the research is validation the
values of tolerance, which in the final commercial
version will be taken as normative. Mineral ratios
for each color will be determined experimentally,
using statistical methods.
In this article technique of formation evaluation
standards and reliability of the control is considered
an example of gold, which is justified for two
reasons. The first reason is the reserves of gold and
platinum are the most important indicators of the
state's economy. The second reason – gold is
different low chemical reactivity, on the air and it is
not changed, do not act on it, and most acids, so the
color of gold indicated a sufficiently high stability
and low variability. Gold occurs mainly in the native
state in the form of fine grains (Chris, 2002).
Color is lighting from golden yellow to light
yellow. Gold grains, meeting in nature, have the
form of sheets, glitters, hair like discharges, etc
(Shaffer, Herbert and Raymond, 2001).
As etalon of gold color can be used ore with one
smooth ground surface or color photo quality. Since
gold color varies in a certain range, the
experimentally determined ratios will have
uncertainty, i.e. standards are random variables.
Instrumental measurement means also have the
random error, which implies that the results of
monitoring the gold content in rock sample will be
accompanied by errors that errors in the literature
called the first and second kind of risk or the
producer and consumer. We have the problem -
development formal models estimate the value
specified risk in the statistical uncertainty of all
agents’ process control and decision making.
Control process contains the following system
agents:
- agent - normative values;
- agent - measured parameters;
- agent - measurement error;
- agent decision-making system.
QuantitativeEvaluationofAccuracyofDigitalMicroscopeSystemforAutomatedPetrographicAnalysis
561

Agent-based modeling to assess and predict risks
at the stage of decision-making in the system
diagnostics and quality control process in statistical
under uncertainty relies mostly on probability and
simulation technique (Borschev, 2008). Agent-based
modeling makes it possible to investigate the
behavior of the autonomous system objects, agents,
and how this behavior determines the behavior of
the whole system. In contrast to the system
dynamics researcher evaluates the behavior of
agents is not at the individual level, and the behavior
of the system as a whole - is the result of the
activities of all agents, which is called - modeling
"bottom up" (Kuleshov and Kornev, 2011).
Control - is a sequence of procedures:
measurement, comparison measured values with the
regulations and a decision on the principle -
"controlled object pass", "fail-controlled object."
Final decision "pass-fail" is generally accepted by a
man.
Mandatory control procedure is measurement.
Measurement regarded as an independent agent has
no independent process control characteristics.
During the study the multi-agent system, these are
subject to change, in order to find the optimal
values. This approach also applies to other agents.
Due to the fact that the process is accompanied
by measurement errors, we have the control errors.
We consider only random errors in this paper.
These events occur in the following cases from
the probabilistic point of view (Wentzel, 2002):
monitored parameter is normal (pass), and the
measured value as a result of random error was in
the zone - does not pass, it means fail defect;
monitored parameter is in the "fail", and the
measured value as a result of random error was in
the area fit that is undetected fail.
Quantitatively, these errors are estimated
corresponding probabilities, in this case,
-
probability of a false defect and
- probability of
undetected defect. These probabilities are also worth
the risk of the customer's products work and work
accordingly.
A lot of works are devoted for problem of risk
assessment and decision-making control; however,
they assume deterministic normative values. The
need to consider regulations as random values
indicated in some studies, but mainly in the staging
level and qualitative analysis, which deals with
general approaches to evaluating these risks
(Svinolupov, Kornev and Kuleshov, 2012).
There is often a need for practical purposes with
the required reliability quantify and predict the
quality of measurement and control procedures in
the application domain, in any combination of the
statistical characteristics of these agents in the
control system. This may be two problems.
The first problem. Measurement tools are
available with known metrological characteristics,
and there are regulatory requirements for control
precision. It is necessary to evaluate the quality of
test and measurement operations.
The second problem. There are regulatory
requirements for quality control. It is required to
determine the accuracy characteristics of
measurement tools to ensure the quality
requirements specified control.
It is often used concept to assess the quality of
the integrated measurement information - reliability
is the main characteristic of the quality control.
Reliability of the control - is the degree of
confidence that the measured values reflect the true
state of the object (Svinolupov, Kornev and
Kuleshov, 2012).
Reliability analytically is calculated by the
formula:
1,
(1)
where ERR – the probability errors.
3 DISCUSSION AND RESULTS
It is often consider on practice the quality control is
uniquely determined by the error of measurement
and it ignores other system agents’ process control.
It is assumed that quantifying reliability of
inspection results is necessary for the reason that the
error control largely determine the technical and
economic indicators of the entire quality
management system for production processes. In this
regard, it was attempting to develop a formal model
that takes into account the effect of all the factors,
and especially the fact of uncertainty normative
values. The model would be having practical
importance, not only in this subject area, but also in
many other system tasks for quality control
processes, diagnosis and decision-making.
Each object of study, economic, social or
technical, etc., has its own distinct properties. This
fact is confirmed by systematically the most diverse
examples in all spheres of human activity. There is a
fact of explicitly normative values uncertainty in this
subject area. Therefore, the development and
evaluating the quality control in statistical
uncertainty standards become sufficiently actually.
SIMULTECH2014-4thInternationalConferenceonSimulationandModelingMethodologies,Technologiesand
Applications
562
Hen
c
values-a
g
random
statistic
a
Stat
e
necessa
r
of the p
r
of stand
a
of distri
b
the con
t
of errors
Con
s
distribut
i
errors a
n
grocery
p
aramet
e
whe
r
upper a
n
̅
,
̅
limits.
We
h
measuri
n
- tr
u
and wi
t
measure
d
∗
- tru
e
(
outside
o
- tr
u
(
the upp
e
(
∗
when th
e
the zo
n
erroneo
u
case wa
s
its occu
r
- tru
e
and the
(
∗
defect
a
p
robabil
i
The
a
called c
o
c
e, rightly
g
ents system
quantities o
a
l distribution
e
ment of the
p
r
y to develop
r
ocess contro
l
ards for diff
e
b
ution of all
t
rolled para
m
s
of measure
m
s
ider as the fi
i
on of contr
o
n
d normative
distribution
e
r has the for
m
√
√
r
e
,
- t
h
n
d lower stan
d
̅
- average
v
h
ave the follo
w
n
g means hav
i
u
e value of
t
hin normati
v
d
value
∗
;
e
value of
or
)
o
f admissible
u
e value
) and th
e
e
r limit or o
u
or
∗
)
.
e
true value o
n
e of accept
u
sly fixes it
b
s
called "fals
e
r
rence - the pr
e
value
is
o
measured
v
). This
a
nd the pro
b
i
ty of undete
c
a
bove group
o
mplete grou
p
hypothesize
quality ma
n
beying in e
a
laws.
p
roblem is t
h
a model eva
l
l
based on th
e
e
rent compos
i
system agent
s
m
eter, regulati
m
ent means.
rst case an e
x
o
lled parame
t
. Assu
m
e th
a
normative
v
m
:
1
√
2∙
1
√
2∙
h
e standard
d
d
ard values;
v
alues of the
w
ing four pos
i
ng random e
r
is within ac
c
v
e limits
is within
a
is outside of
)
and meas
u
limits (
∗
is within
a
e
measured v
a
u
tcome beyo
n
.
In this cour
s
f the monitor
e
ance - "pas
b
eyond the n
o
e
defect", and
obability of a
o
utside of (
v
alue
∗
wit
h
event is call
e
b
ability of
i
c
ted defect
of events in
p
p
of mutually
that norm
a
agement pro
c
a
ch case ce
r
h
e following:
l
uation credi
b
e
statistical n
a
i
tions of the
l
s
process co
n
o
ns, distribu
t
x
ample of no
r
t
er, measure
m
a
t the functio
n
v
alues of co
n
̅
̅
d
eviations o
f
lower and u
p
sible events
w
r
rors:
c
eptable stan
d
,
a
dmissible li
admissible li
u
red value
or
∗
)
a
dmissible li
a
lue
∗
is exc
e
d the lower
l
s
e there is a
e
d parameter
s" and "de
v
o
rm - "fail."
T
the probabili
t
false defect
or
h
in the toler
a
e
d the undet
e
i
ts occurren
c
.
p
robability th
e
exclusive ev
e
a
tive
c
ess,
r
tain
it is
b
ility
a
ture
l
aws
n
trol:
t
ions
r
mal
m
ent
n of
n
trol
(2)
(3)
f
the
p
per
w
hen
d
ards
and
i
mits
i
mits
∗
is
)
;
i
mits
eeds
l
imit
case
is in
v
ice"
This
t
y of
;
)
a
nce
e
cted
c
e -
eory
e
nts.
Th
e
out
c
du
e
les
s
ran
d
p
ro
b
an
d
the
typ
e
cas
e
Fig
u
ad
m
ex
p
ex
a
li
m
lo
w
reg
i
e
first two c
a
c
omes and th
e
The last two
e
to the fact t
h
s
er extent,
b
d
om error of
m
And this is
b
abilities of t
h
d
, and ho
w
It was devel
quality of d
e
e
s of defect.
e
.
u
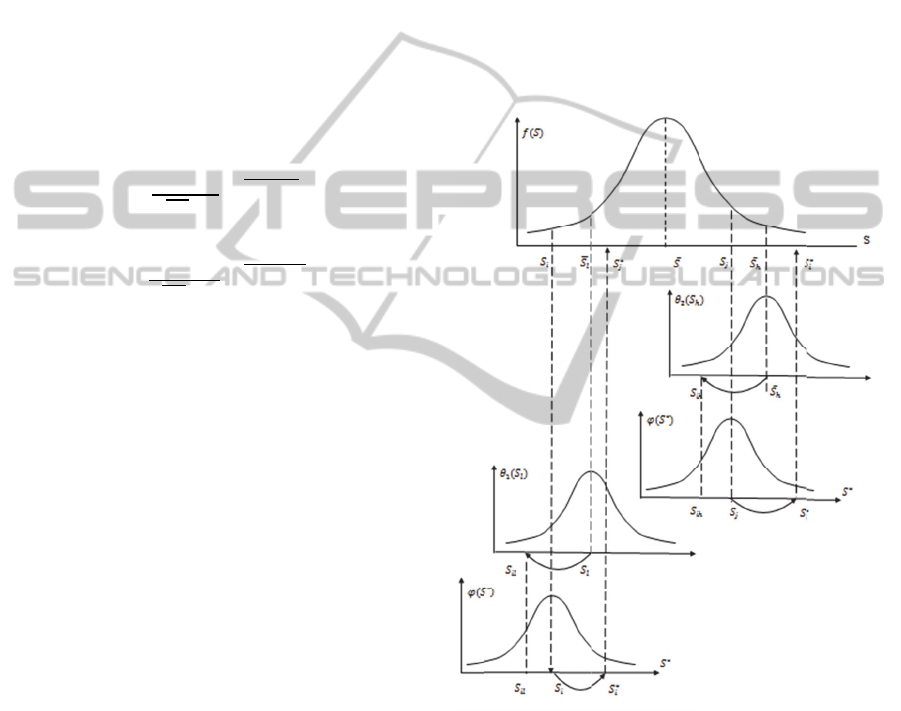
re 1: Graphic
a
m
issible limits.
Consider th
e
p
ression of
r
a
mple of the
it parameter
S
Diagram
w
er limit. The
i
on of uncert
a
Divide the i
n
3
to
a
ses of this g
r
e
y do not rep
r
cases are con
h
at each meas
u
b
ut always
m
easure.
the question,
h
ese errors, i
n
w
to manage t
h
o
ped probab
i
e
cisions and
d
Figure 1 il
l
a
l model of co
n
e
derivation
r
isk assessm
e
standard for
S
.
is the de
n
a
verage valu
e
a
inty (scatteri
n
n
terval of va
r
3
b
y m plo
t
r
oup are un
m
r
esent some i
n
n
trol errors ar
e
u
rement to a
g
accompanie
d
,
how to est
i
n
dimensiona
l
h
eir level.
i
listic model
d
etermine the
lustrates the
n
trol for rando
m
of the mat
h
e
nt
orig
i
the lower a
n
sity distribut
i
e
of
is a ce
n
n
g) of the lo
w
r
iation of the
ts. So from t
h
m
istakable
n
terest.
e
possible
g
reater or
by the
i
mate the
l
case
to assess
probable
analysed
m
errors in
h
ematical
i
nally an
d
missible
i
on of the
n
ter of the
w
er limit.
norm of
h
e N-total
QuantitativeEvaluationofAccuracyofDigitalMicroscopeSystemforAutomatedPetrographicAnalysis
563

number of monitored objects,
- probable number
of objects have a standard value
will be
∙
,
(4)
where:
- - interval i-th probability;
̅
3
1∆
;
̅
3
∆
;
∆
.
probability expressions for the i-th interval
value standard
and j-th value of the parameter S
has the following form:
√
∙
√
,
(5)
where:
̅
;
̅
;
∆
;
.
The total probability for
limit
is:
∑
∑
√
∙
√
,
(6)
The probable number of wrong decisions of a set
, for the case of a false defect will be equal
,
(7)
The probable number of wrong decisions of the
set N, expressed by the formula
∑
∑
∙
√
,
(8)
where:
3
∆
;
3
1∆
.
New variables z and t are centered and
normalized integration variables.
A similar algorithm are an expression to
calculate the probable number of objects in the case
of undetected marriage, as well as a whole to
calculate the values of these probabilities on the
upper normative value in
.
Let us consider that p et case of the distribution
of normative values of
by the normal law and
monitored parameter S by Weibull law, which, as
studies have shown, is not only one of the most
common of the known laws, but also the most
appropriate distribution law for modeling purposes.
Weibull law is three-parameter law. Common laws,
as the normal law can be considered in a certain
approximation, as a special case of this law (Law
and Kelton, 2000).
Density function of the Weibull law is as
follows:
,,,
,
(9)
where:
- the scale parameter;
- the shape parameter;
- location parameter.
At distribution shape parameter =1, it simulates
an exponential law, with =2.5 - approximates the
Rayleigh law, while =3.25, the shape of the
Weibull distribution is close to the normal
distribution, which is quite often used in research
practice. However, the dignity of the Weibull law
consists in the fact that he, unlike the normal law has
an analytical form of the integral of the distribution
law, which has the form
1
,
(10)
So the probability
takes the following form:
∑
∑
,
(11)
Then, the total number of false defect of N
samples will be
∑
∆
∑
∙
SIMULTECH2014-4thInternationalConferenceonSimulationandModelingMethodologies,Technologiesand
Applications
564
∑
∆
∆
∙
, (12)
According in formula (12), the average and
standard deviation of the Weibull law expressed in
(Law and Kelton, 2000):
̅
Γ1
,
(13)
Γ1
Γ1
,
(14)
For the case of defect, the number of undetected
decisions in the sample N will be
∑
∙
∑
∆
∆
∙
, (15)
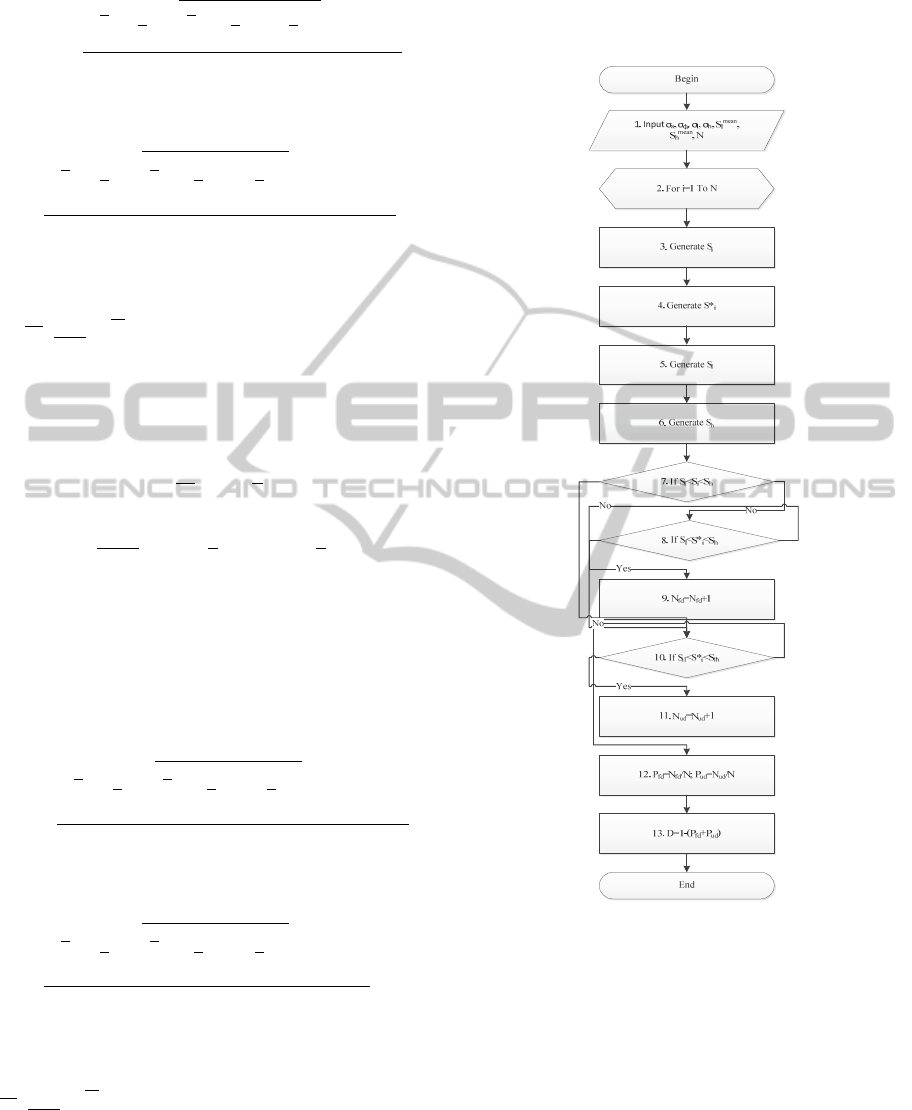
Use simulation algorithm is shown on Figure 2 to
calculate the values of the probable risks expressions
(12) and (15) rationally. Algorithm works as
follows:
Figure 2: The simulation algorithm for estimating the
quality control in the conditions of uncertainty normative
values.
In the unit 2 opens the cycle 1 to N. In blocks 3,
4, 5, 6 are generated ("played out"), the random
values of the lower
and upper
ratios in the
controlled parameter.
Section 7 contains a logical condition IF
(branching)
.
If provided,
. value
will be
within a limits (the condition is true - YES), the
condition is now following analysis of the
QuantitativeEvaluationofAccuracyofDigitalMicroscopeSystemforAutomatedPetrographicAnalysis
565

measurement result
∗
in (block 8) and
in the case of YES - a true outcome, control is
passed to a new cycle unit 2. If the condition is false
block 8 - NO, there was an error - a false defect, in
block 9 counter is triggered these cases and will
return to the beginning of the next cycle of unit 2.
If block 7 the condition is false - it is not, at
block 10 Si analysis of the condition S
S
∗
S
and at the right end of the control is passed to the
beginning of a new cycle (block 2), otherwise (NO)
an error undetected defect and in block 11
counter is triggered and a new cycle begins in block
2.
Upon completion of the specified number of
simulations equal to N, in block 12 is evaluated and
the probability of undetected false defect by
(probable error control)
,
(16)
,
(17)
where
is the number of events false defect;
- number of events undetected defect;
N - total number of simulation events.
The integral indicator of quality control - the
accuracy of D in block 13 calculates by the formula
1
.
(16)
Similar calculations can be made for different
combinations of distribution laws, and compare the
results to determine the degree impact on quality
control and decision-making process of distribution
laws.
4 CONCLUSIONS
We can make the following conclusions on
simulation results: the formation of the total error
control should be considered as a system of
interconnected agents, expression quantitative
assessment of the likely risks of undetected and false
defect laws are functions of distribution, the
statistical characteristics of agents and average
standard deviations of the statistical characteristics
of standards.
REFERENCES
Blatt, H, Robert J. T., 1995. Petrology: Igneous,
Sedimentary, and Metamorphic, 2nd ed. New York:
W.H. Freeman.
Farndon, J., 2006. The practical encyclopedia of rocks and
minerals. How to Find, Identify, Collect and Maintain
the World's best Specimens, with over 1000
Photographs and Artworks. London: Lorenz Books.
Baklanova, O. E., Uzdenbaev, Z.S., 2013. Development of
methodology for analysis of mineral rocks in the
mining industry. Joint issue of the Bulletin of the East
Kazakhstan state technical University and Computer
technology of Institute of computational technologies,
Siberian branch of the Russian Academy of Sciences,
Part 1, September, 2013. - P.60-66.
Clarke, A. R., Eberhardt, C. N., 2002. Microscopy
Techniques for Materials. Science Woodhead
Publishing, CRC Press, 459 p.
Panteleev, C., Egorova, O., Klykova, E., 2005. Computer
microscopy. Technosphere, 304 p.
Chris, P., 2002. Rocks and Minerals. Smithsonian
Handbooks. New York: Dorling Kindersley.
Shaffer, P. R., Herbert S. Z., Raymond P., 2001. Rocks,
Gems and Minerals. Rev. ed. New York: St. Martin's
Press.
Borschev, A. V., 2008. How agent-based modeling and its
place in the arsenal of the analyst. Exponenta Pro,
2008. № 3-4 [Electronic resource] //URL:
http://www.xitek.ru/anylogic/articles/
Kuleshov, V.K., Kornev, V. A., 2011. Modeling process
control and decision-making. Tomsk Polytechnic
University, 295 p.
Wentzel, E. S., 2002. Probability theory. Moscow: Higher
School, 575p.
Svinolupov, U., Kornev, V.A., Kuleshov, V. A., 2012.
Methodology for assessing the quality of measuring
instruments (Case study: Pressure sensors) // Russian
Journal of Nondestructive Testing 48 (2) 2012, P. 129-
136.
Law, A. M., Kelton, W. D., 2000. Simulation Modeling
and Analysis, Third Edition, McGraw-Hill, New York.
SIMULTECH2014-4thInternationalConferenceonSimulationandModelingMethodologies,Technologiesand
Applications
566
