
Surgical Skill Evaluation by Means of a Sensory Glove
and a Neural Network
Giovanni Costantini
1
, Giovanni Saggio
1
, Laura Sbernini
2
, Nicola Di Lorenzo
2
,
Franco Di Paolo
1
and Daniele Casali
1
1
Department of Electronic a Emngineering, Tor Vergata University, Rome, Italy
2
Department of Experimental Medicine and Surgery, Tor Vergata University, Rome, Italy
Keywords: Neural Networks, Data Glove, Hand-Gesture, Classification, Surgery.
Abstract: In this work we used the HiTEg data glove to measure the skill of a physician or physician student in the
execution of a typical surgical task: the suture. The aim of this project is to develop a system that, analyzing
the movements of the hand, could tell if they are correct. To collect a set of measurements, we asked 18
subjects to performing the same task wearing the sensory glove. Nine subjects were skilled surgeons and
nine subjects were non-surgeons, every subject performed ten repetitions of the same task, for two sessions,
yielding to a dataset of 36 instances. Acquired data has been processed and classified with a neural network.
A feature selection has been done considering only the features that have less variance among the expert
subjects. The cross-validation of the classifier shows an error of 5.6%.
1 INTRODUCTION
One of the most important skills of a surgeon is the
ability to perform hand motion tasks with precision,
accuracy, and firmness. Indeed, these tasks cannot
be trivial since the necessity of adaptation to every
single situation, being the context never absolutely
identical. However, an experienced surgeon is able
to repeat as many tasks as required, always
maintaining similar precision and accuracy,
especially in some key-phases of the gesture. This
cannot be the same for novice surgeons still on the
learning curve, as already demonstrated in robotic
surgical system by means of pattern of movements
(Verner et al., 2003; Lin et al., 2006), in
laparoscopic surgery by means of eye patterns (Law
et al., 2004), and in simulation-based training by
means of video analysis (Qiang et al., 2010).
In such a frame, an automatic system, able to
analyze the hand gestures and classify their
effectiveness, can be strategically adopted. This
system can objectively evaluate the performance of
an apprentice surgeon and time tracing his/her
progresses. Moreover, gesture recognition is a well-
known topic of machine learning and it has been
mostly studied for sign language recognition (Saggio
et al., 2011a).
There are many works related to recognition of hand
gestures, which differ in the gesture capture method,
and in the gesture classification procedure. The most
relevant works regard the acquisition of video
signals by means of webcams, using a software
capable of motion tracking of optical markers. This
solution can suffer from visual occlusion problems
and the mathematical algorithm can be complex,
with high computational cost. More and more efforts
have been devoted to develop acquisition system
based on sensory (or data) glove equipped with
sensors to measure flexions of finger joints and
positions of the hand in space. This solution is
cheaper and has not occlusion problems with respect
the aforementioned optical one, and presents lower
computational costs.
Data, coming from optical systems or sensory
gloves, have to be processed to objectively evaluate
the hand gestures (Saggio et al. 2011b, 2011c). In
such a frame, the mostly adopted classifiers are
Neural Networks, Hidden Markov Models and
Support Vector Machines (Mitra, 2007).
Our works intends to propose a system to
evaluate surgical skills, by means of measuring
system based on a sensory glove, and a classification
method based on Neural Network. It compares hand
motion tasks performed both by expert than novice
surgeons.
105
Costantini G., Saggio G., Sbernini L., Di Lorenzo N., Di Paolo F. and Casali D..
Surgical Skill Evaluation by Means of a Sensory Glove and a Neural Network.
DOI: 10.5220/0005030301050110
In Proceedings of the International Conference on Neural Computation Theory and Applications (NCTA-2014), pages 105-110
ISBN: 978-989-758-054-3
Copyright
c
2014 SCITEPRESS (Science and Technology Publications, Lda.)
2 THE DATA GLOVE
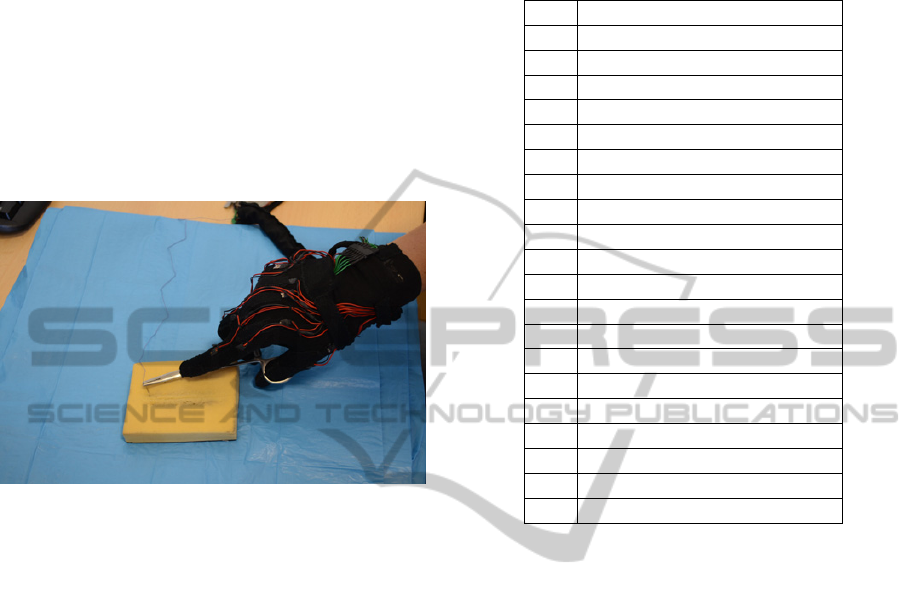
Our sensory glove, termed Hiteg-glove (Fig. 1), is
made of a supporting glove with 20 embedded
sensors, including bending types, 3D accelerometers
and 3D gyroscopes (Saggio et al., 2009a, 2009b).
Acquired data from the sensors are conditioned by
an indigenously designed electronic circuitry and fed
to a personal computer via USB port. The hand
gestures can be reproduced in a virtual environment
by means of an avatar for a visual feedback to the
user.
Figure 1: The HITEG data glove during the experiment.
Table 1 reports type and name of each of the
sensors equipped in the glove. Two bending sensors
are for the thumb (1-2), three for the other fingers
(3-14), and three accelerometers (15-17) plus three
gyroscopes (18-20) are for the wrist. The bending
sensors measure Distal Interpahlangeal (DIP),
Proximal Interphalangeal, and Metacarpo Phalangeal
angles, while the inertial units measures wrist
movements.
2 THE CLASSIFICATION
SYSTEM
Each subject is asked to repeat the gesture in a given
number of times. The system first performs a pre-
processing, where data is filtered with a moving
average filter. Initial and final part of data are cut
because not describing any movement. Data are then
re-sampled in order to have the same number of
samples for every subject. Every repetition is
normalized to 1000 samples, so the whole gesture is
1000 n samples length, where n is the number of
repetitions for the gesture.
Information regarding the actual duration of the
gesture is taken into account separately.
Table 1: HITEG glove sensors. “1PIPJ” means thumb
Proximal Interphalangeal Junction angle, “1 DIPJ” means
thumb Distal Interphalangeal Junction angle, “2MCPJ”
means first finger Metacarpo Phalangeal angle, etc.
# Sensor
1 1PIPJ
2 1DIPJ
3 2MCPJ
4 2PIPJ
5 2DIPJ
6 3MCPJ
7 3PIPJ
8 3DIPJ
9 4MCPJ
10 4MCPJ
11 4PIPJ
12 5DIPJ
13 5PIPJ
14 5DIPJ
15 Accelerometer, x axis
16 Accelerometer, y axis
17 Accelerometer, z axis
18 Gyroscope, x axis
19 Gyroscope, y axis
20 Gyroscope, z axis
Data coming from the 20 sensors are splitted into
windows of 50 samples, overlapped by 25 samples,
obtaining 39 windows in total. Every window is a
representation of the state of the system in a specific
interval of time. For example, window 1 represents
the beginning of the gesture, from its start to 1/49
th
of its length. For every window we calculate the
mean value of its samples; the obtained value is
averaged over the n repetitions. With 20 sensors and
39 time-series values, we have a total of 780 values
that can be considered as features for classification.
In addition, we also consider the median value of the
time length of the gesture. In Fig. 2, medians of the
duration time of the repetitions are shown. For every
one of the 18 subjects, the first box represent the
median value for the first session, and the second
box the median value for the second session. The
first 9 subjects are expert, while the second 9 are
non-expert. Because the duration for non-experts is
often longer, this feature can be useful for the
classification.
For the classification, we used an Artificial
Neural Network (ANN) being the hidden layer made
up with 4 neurons on, since we noticed worse results
with a lower number, and no improvements with a
higher number. The learning rate of the network is
0.3.
NCTA2014-InternationalConferenceonNeuralComputationTheoryandApplications
106
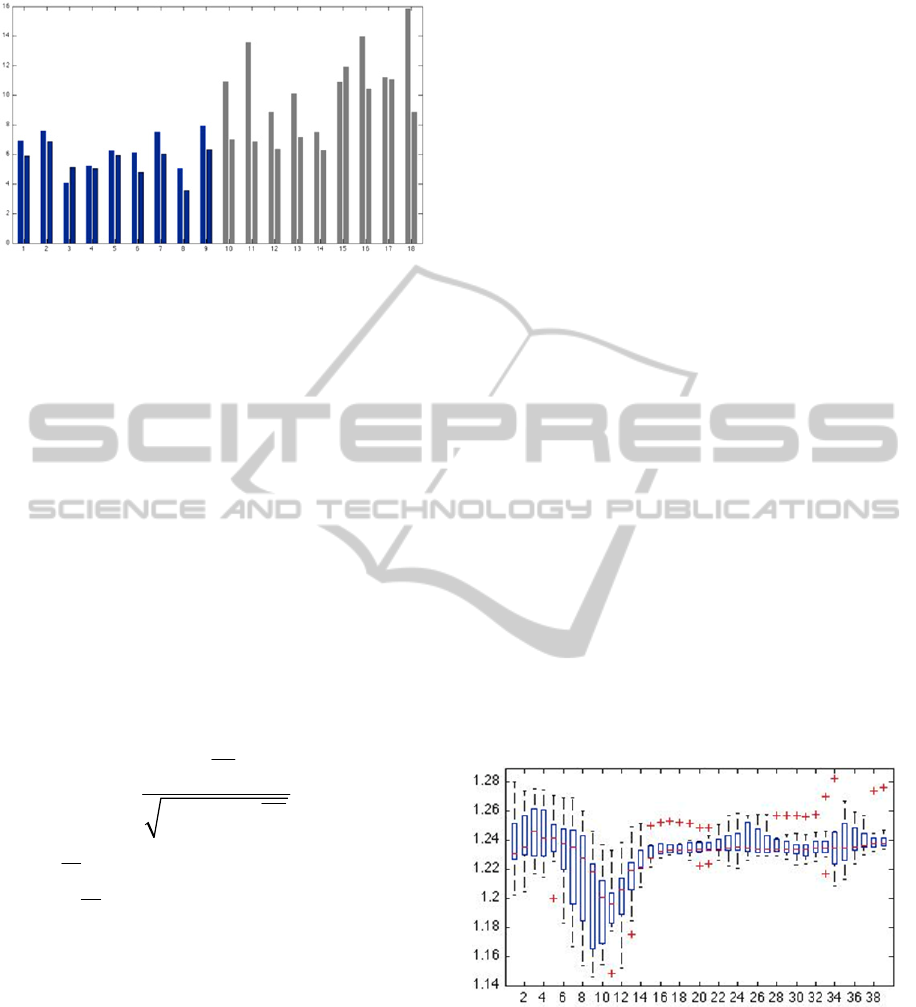
Figure 2: Medians of the duration time of the repetitions.
The first 9 subjects are expert, while the second 9 are non-
expert.
For the classification, we used an Artificial
Neural Network (ANN) being the hidden layer made
up with 4 neurons on, since we noticed worse results
with a lower number, and no improvements with a
higher number. The learning rate of the network is
0.3.
Because 781 features are not acceptable for an
ANN, we had to use a method to reduce their
number, considering only the sensors and the time
windows strictly useful to discriminate experts vs.
novices. We applied the Correlation-based Feature
Subset Selection (CFS) algorithm (Hall, 1998),
where only features that have higher correlation with
the class and lower correlation among themselves
are chosen. According to this algorithm, the
following formula is adopted to measure the “merit”
of a feature subset S containing k features:
(1)
cf
s
ff
kr
M
kk r
(1)
where
cf
r
is the mean feature-class correlation (f
S) and
ff
r
is the average feature-feature inter-
correlation. Among the different possible heuristic
search strategies to explore the feature subsets, the
one that we adopted is the Forward Selection: we
begin with no features and greedily add one feature
at a time until no possible single feature addition
results in a higher evaluation.
After the feature selection, all features are
normalized as required by the ANN. Back-
propagation algorithm is used for the training of the
network.
3 EXPERIMENTS AND RESULTS
3.1 Experimental Procedure
We selected 18 subjects: 9 of them were skilled
surgeons and 9 novices on their starting learning
curve. All of them were asked to perform the same
task: a suture on a plastic material designed to have
the same characteristics of human skin. The gestures
always started and finished on the same rest
position. Every subject, at every session, repeated
the gesture 10 times.
Two sessions were recorded for every subject, on
two different days, so we totally collected a total of
36 sessions: 18 from skilled and 18 from unskilled
subjects.
The medians of the duration time of every
session for every subject were calculated (see Fig.
2).
3.2 Feature Extraction
Data comparisons clearly show differences between
skilled and unskilled subjects. For example, Fig. 3
reports data from sensor 20 (gyroscope, axis z) in a
box-plot. In the axis x we reported the time window
(1-39), in axis y the values from of expert subjects.
On each box, the central mark is the median, the
edges of the box are the 25th and 75th percentiles,
the whiskers extend to the most extreme data points
not considered outliers, and outliers are plotted
individually.
Figure 3: Box-plot of sensor 20, for all experts, from time
window 1 to 39 (begin to end of every repetition).
We can see that the trajectory followed by the
experts are very similar: almost all of them behaves
starting with a value around 1.24, slightly
increasing, reducing to 1.16, then rising up again to
1.23, at half of the total duration.
SurgicalSkillEvaluationbyMeansofaSensoryGloveandaNeuralNetwork
107
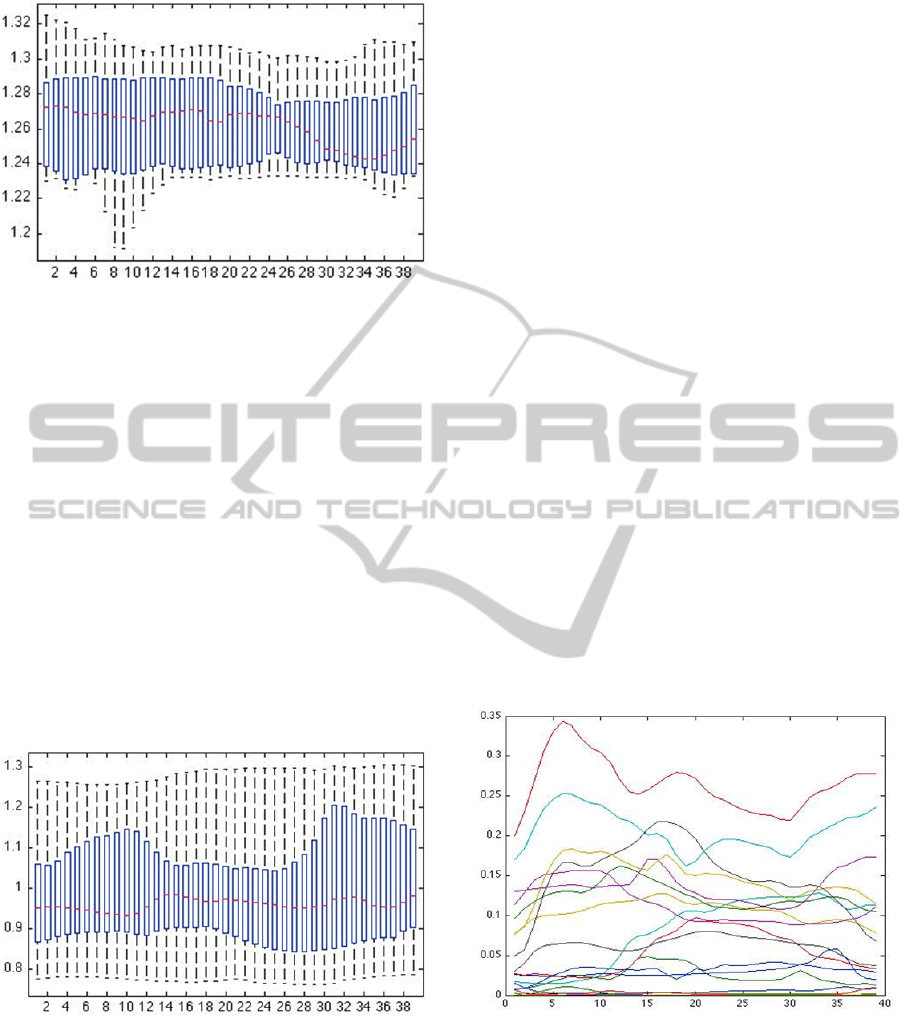
Figure 4: Box-plot of sensor 20, for all non-experts.
Figure 4 reports data from novice subjects:
dispersion is higher without any recognizable
standard sequence.
3.3 Feature Selection
The box-plots of the experts report value dispersion
not identical in time: in some time instants (for
example in the central position of the graph in Fig.
3) it is very low, while it is higher elsewhere.
Moreover, this can change with the sensor. For
example, in Fig. 5 we show the values relative to
sensor 1, which is the proximal interphalangeal
junction angle of the thumb with dispersion value
quite high among the experts too. This could mean
that the position of the thumb can vary, and is not a
discriminant factor for the recognition of the skill.
Figure 5: Box-plot of sensor 1, for all experts.
We can see that the trajectory followed by the
experts are very similar: almost all of them behaves
starting with a value around 1.24, slightly
increasing, reducing to 1.16, then rising up again to
1.23, at half of the total duration.
These considerations are confirmed by the result
of the CFS, which are reported in Table 2. As we
can see, the algorithms reduced the number of
features to 20, using sensors 4, 7, 9, 10, 11, 13, 16,
17, 18, 19, 20, and duration. Sensors 16-20 have
been judged the most important. Anyway also some
other sensors have been found useful. For example,
sensor 10, despite having a big variance also among
experts is considered quite useful and two windows
have been take from this sensor: 14 and 39.
Table 2: Selected features: the CFS algorithm selected the
following 20 features.
Sensor Time window
4 (2PIPJ) 1
7 (3PIPJ) 12
9 (4MCPJ) 33
10 (4PIPJ) 14, 39
11 (4DIPJ) 12
13 (5PIPJ) 19, 24, 25
16 (acc. Y) 3, 19, 36, 37
17 (acc. Z) 4
18 (gyr. X) 16
19 (gyr. Y) 35
20 (gyr. Z) 10, 11, 13
duration
Fig. 6 shows the variance for every sensor: some
sensors, more specifically the accelerometers and
gyroscopes, have a lower variance than others. By
comparing it with the box-plot in Fig. 6 we can see,
for example, that highest curve is the one that
corresponds to sensor 10, and that it has a maximum
around the time window 7.
Figure 6: Variance of every sensor vs. time.
Most significant sensors can be evidenced looking at
the box-plot in Fig. 7, with sensors 15-20 have
almost always a very low variance, sensor 2 and 8
have a low variance but just in some time windows,
so that a selection based both on the sensor and on
the time windows is better than considering only the
sensors.
NCTA2014-InternationalConferenceonNeuralComputationTheoryandApplications
108
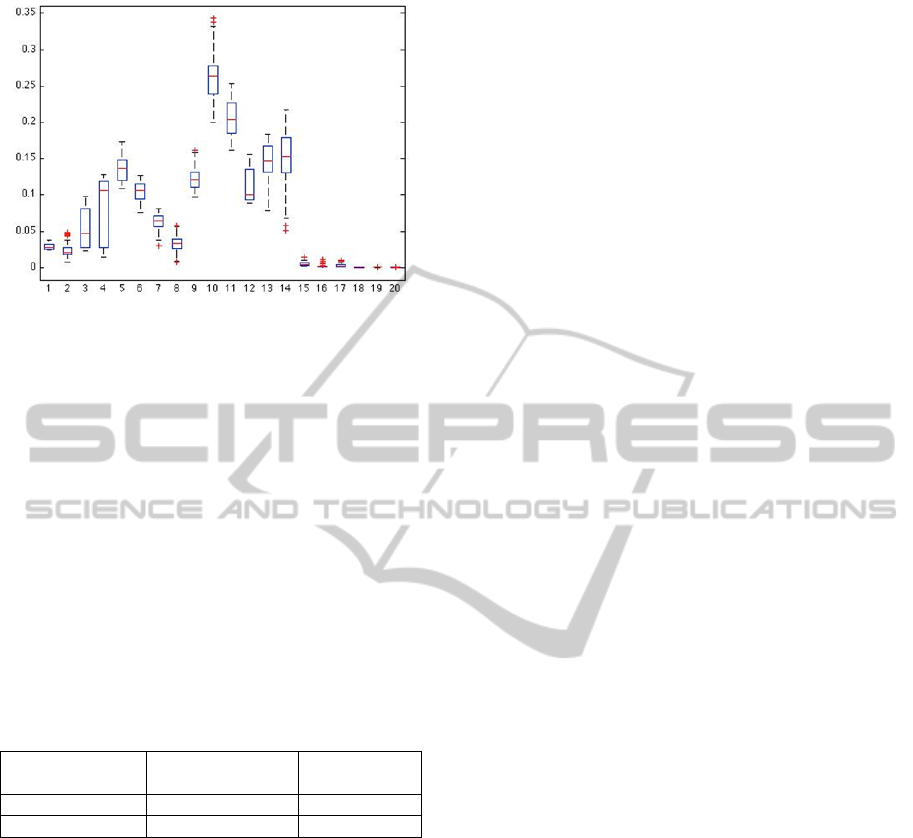
Figure 7: Box-plot of the variance for every one of the 20
sensors.
3.4 Results
We performed a cross-validation of the network.
The dataset was randomly partitioned in 6 groups
called “folds”: a single fold was used as validation
set while the remaining 5 as training set. The process
was repeated 6 times, with each 6 folds used exactly
once as the validation set. Finally, the 6 results were
combined together.
Results are summarized in Table 3. We have a
dataset of 36 instances, 18 of which are expert (2
sessions for every expert subject) and 18 are
novices; 94.4% of the instances are correctly
classified, while 5.6% are incorrectly classified.
Table 3: Confusion matrix.
Classified as
expert
Classified as
novice
16 2 Expert
0 18 Novice
TP (true positive) rate for experts is 0.889, and
for novices is 1, while FP rate for experts is 0 and
for novices is 0.111.
4 CONCLUSIONS
We designed and developed a system for the
evaluation of the skill of a surgeon while performing
a suture. The system makes use of a sensory glove to
obtain the exact position of the hand and movements
of the fingers. Features were extracted by re-
sampling data from the glove in order to give the
same duration to all the gestures, and then averaging
the values of the 20 sensor in windows of 50
samples. The total number of features was reduced
using the Correlation-based Feature Subset
Selection, with forward selection. Finally, the
median of the duration of the gesture was added to
the feature set. The dataset was classified by means
of a neural network. Results of a 6-folds cross-
validation showed a correct recognition of 94.4%.
By looking at the dispersion of the acquired data,
we noticed that, in general, experts have a lower
dispersion among them with respect to novices,
underlining a more systematic approach. We
exploited this by using an algorithm that reduces the
number of feature by considering only the most
effective one. Possible future enhancements include
the analysis of the dispersion among different
repetition in the same session: this information could
be used as an additional useful input to the classifier.
REFERENCES
Hall M. A.(1998). Correlation-based Feature Subset
Selection for Machine Learning Hamilton, New
Zealand.
Law B., Atkins M. S., Fraser S., Kirkpatrick A. E., Lomax
A. J., Eye gaze patterns differentiate novice and
experts in a virtual laparoscopic surgery training
environment, Proceedings of the 2004 symposium on
Eye tracking research & applications Pages 41-48
Lin H., Shafran I., Yuh D., Hager G. D, (2006). Towards
automatic skill evaluation: Detection and segmentation
of robot-assisted surgical motions. Computer Aided
Surgery, Septermber 2006; 11(5): 220-230.
Mitra S., Acharya T., Member S. (2007). Gesture
recognition: A survey. IEEE C 37.
Qiang Z. and Baoxin L. (2010). Towards Computational
Understanding of Skill Levels in Simulation-based
Surgical Training via Automatic Video Analysis.
International Symposium on Visual Computing
(ISVC).
Saggio G., Bocchetti S., Pinto G. A., Orengo G., Giannini
F., (2009a). A novel application method for wearable
bend sensors, ISABEL2009, 2nd International
Symposium on Applied Sciences in Biomedical and
Communication Technologies, Bratislava, Slovak
Republic, November 24-27.
Saggio G., De Sanctis M., Cianca E., Latessa G., De
Santis F., Giannini F. (2009b). Long Term
Measurement of Human Joint Movements for Health
Care and Rehabilitation Purposes”, Wireless Vitae09 -
Wireless Communications, Vehicular Technology,
Information Theory and Aerospace & Electronic
Systems Technology, Aalborg (Denmark), 17-20 May,
pp. 674-678.
Saggio G., Cavallo P., Fabrizio A., Obinna Ibe S., (2011a).
Gesture recognition through HITEG data glove to
provide a new way of communication. ISABEL 2011,
4th Proceedings of the International Symposium on
Applied Sciences in Biomedical and Communication
Technologies, October 26-29.
SurgicalSkillEvaluationbyMeansofaSensoryGloveandaNeuralNetwork
109

Saggio G, Cavallo P, Casali D, Costantini G (2011b).
Complexity Reduction in Control of Human Hand
Prosthesis for a Limited Set of Gestures. Proceedings
of the 4th International Conference on Health
Informatics (HEALTHINF, part of BIOSTEC).
Saggio G, Giannini F, Todisco M, Costantini G (2011c). A
Data Glove Based Sensor Interface to Expressively
Control Musical Processes. 4th IWASI IEEE
International Workshop on Advances in Sensors and
Interfaces.
Starner T. and Pentland A.. (1995). Visual recognition of
american sign language using hidden markov models.
Verner L., Oleynikov D., Holtman S., Haider H., Zhukov
L., Measurments of the Level of Expertise Using
Flight Path Analysis from da Vinci Robotic Surgical
System, Medicine Meets Virtual Reality (MMVR
2003). Studies in Health Technology and Informatics,
vol 94, pp 373-378, 2003.
NCTA2014-InternationalConferenceonNeuralComputationTheoryandApplications
110
