
A Simulation Model for Risk Management Support in
IT Outsourcing
Tarcio R. Bezerra
1
, Seth Bullock
2
and Antão Moura
1
1
Computing Systems Department, Federal University of Campina Grande, Campina Grande, Brazil
2
Department of Eletronic and Computer Science, University of Southampton, Southampton, U.K.
Keywords: IT Outsourcing, IT Capabilities, Risk Management, System Dynamics Simulation.
Abstract: IT Outsourcing (ITO) is the practice to delegate organizational IT functions to a third party. However, this
practice introduces important risks for customer organizations. We have developed a system dynamics
simulation model to support ITO decision making that considers a dynamic and integrated view of
capabilities management and benefits management. Two IT capabilities are modelled: Contract Monitoring
(on the customer's side) and Service Delivery (on the supplier's side). In this paper the proposed model is
used to assess the risks presented by a deficit in these capabilities. The results of our experiments indicate
that the lack of contract monitoring capability in ITO contracting organizations directly impacts on service
conclusion time and influences the cost of contract management, which is an important risk factor related to
exceeding the ITO budget. It was also found that low levels of service delivery capability in the supplier
most significantly impact the cost of rework and the number of penalties. These factors influence the
profitability of the supplier and may induce it to abandon the contract prematurely.
1 INTRODUCTION
When an organization doesn’t have the internal IT
capabilities required for the provision of all of its IT
services, it must look for external organizations able
to fill the gap (Barney, 1991). This practice is named
Information Technology Outsourcing - ITO.
Outsourcing is often used to transfer risk to third
parties. However, this practice introduces new risks
for customer organizations as well. The loss of
internal technical skills is an important (new) risk
factor for organizations embarking on an ITO
initiative (Ngwenyama and Sullivan, 2007; Martens
and Teuteberg, 2009). The goal of ITO is not to lose
control of IT, given the importance and centrality
that it typically has for the outsourcing business.
This concern should be reflected in the various
phases of the outsourcing cycle. However, there is
no clarity on the part of managers on how to
mitigate this risk in a rational and balanced way,
without compromising the potential benefits of
outsourcing (Lacity and Willcocks, 2009).
The specialized literature offers many conceptual
articles that identify lists of ITO risks or develop
ITO risk models and empirical papers that address
specific ITO risks, risk measurement (Bahli and
Rivald, 2005) and risk management strategies
(Lacity and Willcocks, 2009).
On the other hand however, there are still gaps to
be filled by tools and models that help managers to
decide which capabilities to develop and / or
maintain internal to their organizations, in which
quantity or magnitude and how such capabilities
behave in a dynamic scenario of constant interaction
between internal IT and vendor´s teams.
The model to support decision making and ITO
capabilities management proposed in (Bezerra et al.,
2014) captures the dynamics of interaction between
the ITO contract monitoring capability of
contracting organizations and the service delivery
capability of supplier organizations. Here we expand
on this ITO decision support model and apply it to
assess risks in the ITO contract monitoring process,
enabling the model to support risk-based decisions.
We apply the risk assessment procedure proposed in
(Pfahl, 2005) in the context of a Brazilian state tax
and finance agency (SEFAZ-AL) to analyze the
impact of two kinds of risk (lack of contract
monitoring capability in ITO customers and lack of
service delivery capability in suppliers) on the ITO
budget, on the deadline for completion of services
339
Bezerra T., Bullock S. and Moura A..
A Simulation Model for Risk Management Support in IT Outsourcing.
DOI: 10.5220/0005035703390351
In Proceedings of the 4th International Conference on Simulation and Modeling Methodologies, Technologies and Applications (SIMULTECH-2014),
pages 339-351
ISBN: 978-989-758-038-3
Copyright
c
2014 SCITEPRESS (Science and Technology Publications, Lda.)

and on the relationship between contractor and
supplier.
2 RELATED WORK
The term risk is used in a variety of settings, and can
take on different meanings. In ISO / DIS 31000
(2008), risk is the effect of uncertainty on objectives,
where an effect is a deviation from the expected
outcome (positive and / or negative). In the scope of
our work, we are interested in studying the risks of
undesirable outcomes. Formally, the risk exposure is
defined as RE = [Prob (UO) x Loss (UO)], where
RE is the risk exposure, Prob (UO) is the probability
of an undesirable outcome, and Loss (UO) is the loss
due to an undesirable outcome.
Risk management consists of making decisions
about management and investment based on
evaluating the threats and vulnerabilities that apply
to the area or the process of interest. A generic risk
management process includes the following steps
(ISO / DIS 31000, 2008): 1) Context establishment;
2) Risks identification; 3) Risk assessment (the
process of measuring the level of risk, expressed in
terms of the combination of consequences and
likelihood); 4) Risk evaluation; 5) Risk
treatment/control. Our work is focused on applying
steps 1, 2 and 3 to ITO scenarios.
Risk management in ITO is a topic that has been
extensively studied for decades and is still a topic of
great relevance. Within a recent review of ITO
(Lacity and Willcocks, 2010), 36 of the 164 works
cited specifically address ITO risk management.
Among these articles, (Earl, 1996) identifies a list of
risk factors, (Osei-Bryson and Ngwenyama, 2006)
develop risk models, (Ngwenyama and Sullivan,
(2006; Ngwenyama and Sullivan , 2007) incorporate
strategies for risk mitigation contracts, (Willcocks
and Lacity, 2000) develop empirical research and
(Bahli and Rivald, 2005) focus on risk measurement.
Among the extensive list of risk factors
identified in ITO by several authors, the lack of
essential IT capabilities by customers and suppliers
is almost ubiquitous (Martens and Teuteberg, 2009;
Lacity and Willcocks, 2009; Lacity and Willcocks,
2010).
The literature on ITO shows the strong
relationship between the contracting organizations
capabilities and the expected outcomes of
outsourcing initiatives (Lacity and Willcocks, 2009;
Lacity and Willcocks, 2010): the capability to
manage vendors, to negotiate contracts and technical
/ methodological capability in information systems
development are strongly related to the ITO success.
In his review of the literature on IT capabilities,
(Jorfi et al., 2011) points to a positive relationship
between IT capabilities and corporate strategic
alignment.
(Martens and Teuteberg, 2009) review 97 articles
focused on ITO risk management. They summarise
the main ITO risk factors and the impacts generated
by them, categorize these factors and use them to
build more complex risk and impact factors. The
authors also associate these factors with related
stages of a typical ITO life cycle.
In general, there are two methods that can be
used to measure risk: quantitative and qualitative. In
the quantitative method, the risk metric is calculated
using a methodology that attempts to quantify
numerically the associated risk components. As a
result, the risk could be represented in terms of
potential financial loss, for instance. In the
qualitative method, a subjective scale, such as low,
medium and high, is used to estimate the
components of risk. In this type of analysis, the
results depend heavily on the knowledge of the
experts that assign values to the risk components.
The use of purely quantitative approaches is
extremely difficult and costly. Among the main
challenges are the lack of information records and
the difficulty in estimating costs. There is great
difficulty for organizations in producing statistics
because of the lack of accurate records. This
difficulty affects two components of risk: estimates
concerning the likelihood of an event and impact of
an event.
Our work uses a quantitative method to calculate
risk exposure, based on a quantitative system
dynamics simulation model of the contract
monitoring process, where impact factors are
calculated from differential equations and
probabilities can be calculated from the results of
multivariate sensitivity analyses. We believe that a
quantitative approach, despite the already outlined
difficulties in adopting it, has a more objective
power to communicate risks to the decision makers.
This is of particular interest for business process
managers wishing to make informed decisions based
on quantitative (financial) values, especially in the
case where risk treatment involves financial
expenditures. To argue that an investment of some
thousand dollars will avoid a loss of some million
dollars is a clearer way to inform about risks than
saying that a "very high" risk will be mitigated.
Quantitative approaches can also encourage
organizations to implement measurement programs
to log quantitative empirical data. Furthermore, for
SIMULTECH2014-4thInternationalConferenceonSimulationandModelingMethodologies,Technologiesand
Applications
340

comparison purposes – i.e., when one needs to
compare (and select between) alternatives A and B,
a quantitative approach provides a useful yardstick
which may not need to be absolutely precise but just
“relatively” precise (worse alternatives provide
worse quantities). Even if errors are present in the
estimated results (and they usually are), the
quantitative approach is an efficient decision support
tool for comparison and selection purposes.
Software simulation modeling has been
extensively used in risk management applied to
various sectors of knowledge, industry and services
over the years. Some of these models use a static
approach and others capture the dynamics of the
processes to which they apply. Both approaches can
stochastically generate values for risk factors as a
strategy for representing uncertainty. Our adoption
of system dynamics at the expense of other
simulation techniques is that it is a holistic approach
that is not limited to mono-causality relationships,
but allows one to represent a complex network of
inter-dependencies among risk and impact factors,
including when impact factors are fed back to the
system as risk factors.
The model proposed by us aims to be a tool for
supporting decisions in ITO and in managing
capabilities directly involved in the ITO process
taking into account business benefits realization. In
this direction, we have sought inspiration from
system dynamics simulation models applied to
project management in general and in particular to
software engineering projects (Abdel-Hamid and
Madnick, 1991; Lin et al., 1997; Garousi et al.,
2009) and also applied to decision making in people
management (Costa et al., 2013). One use case for
the proposed model is taking risk-based decisions,
considering the ITO risk factors and impacts that can
be represented within the scope of the model. Risk
assessment procedures to be applied to pre-existing
system dynamics models are proposed in (Houston
et al., 2001) and (Pfahl, 2005) and influenced our
work. There are very few examples of simulation-
based ITO risk management research. (Gui-sem and
Xiang-yang, 2010) present a model structure for risk
analysis. Our work differs in that our approach is
quantitative, and we focus on the risks related to the
IT capabilities involved in the ITO process.
Further down the ITO lifecycle come the stages
of evaluation and treatment of risks. These involve
decisions made by the model user supported by the
outputs of the simulation model presented here
combined with decision-making frameworks. As an
example, (Tan et al., 2010) proposes the use of a
decision tree to evaluate the outputs of a system
dynamics model applied to project risk management.
These later stages however, are outside the scope of
this paper – which concentrates on developing and
applying a system dynamics simulation model to
ITO risk assessment.
3 A SIMULATION MODEL
Measuring IT capabilities quantitatively in order to
properly allocate resources to better achieve planned
results (e.g. project objectives) is still a challenging
problem, especially with regard to human resource
skills and the impact of the tools and techniques
used to support IT functions. However, there is a
lack of tools and models that help managers to make
decisions about capabilities management.
The loss of internal technical skills is an
important risk factor for organizations embarking on
an ITO initiative. However, there is little clarity for
managers seeking to mitigate this risk in a rational
and balanced way, without compromising the
potential benefits that outsourcing can provide.
3.1 Model Objectives
We have developed a system dynamics simulation
model to support ITO decision making that
considers a dynamic and integrated view of
capabilities management and benefits management.
Two IT capabilities are modeled here: Contract
Monitoring – a core capability in the context of
outsourcing which mediates all interactions between
client and vendor capabilities; and, Service Delivery
– a generic single point of contact for IT services.
The objective of this paper is to use the proposed
model to assess the risks presented by deficits in
these capabilities on the contractor and supplier
sides, including the risk of a premature contract
termination. Due to space limitations, this paper
identifies risks only without discussing ways of
mitigating them and details the model’s
implementation, which is somewhat complex, only
to the extent of informing on its main modules and
output.
3.2 Architecture and Entities
Our model has a large number of parameters,
divided into four distinct categories: input,
calibration, mediation and output.
Input parameters characterize the benefits and
performance metrics to be achieved, the IT resources
available within the organization and the IT demand
ASimulationModelforRiskManagementSupportinITOutsourcing
341

characteristics. Calibration parameters are used to
tune the model’s behavior to match the scenarios
being simulated. Mediation parameters represent
intermediate information obtained from the entries,
from calibration and, in situations involving
feedback loops, from output parameters, e.g., IT
capabilities and second-level performance targets
(desired workforce, desired skill level). Output
parameters are values arising from the dynamic
cause-effect relationships between model input,
calibration and mediator parameters. The model
produces outputs that reflect the expected
performance of IT resources (in terms of cost,
quality, resource consumption) in response to
submitted inputs.
3.2.1 Model Views
For clarity, maintainability and reusability, the
model was segmented into “views”, reflecting the
organization of policies captured in the modeling
phase (financial management; demand management;
capability forecasting & planning; sourcing
management; insourced capabilities management;
outsourced capabilities management; contract
monitoring of IT processes/functions). The views
that highlight the core concepts of our risk
assessment are detailed below.
3.2.2 Model Parameters
The most important input (I), calibration (C) and
output (O) parameters are listed in Table 1 and will
be detailed in section 5.
Table 1: Main model parameters.
Parameter Unit Type
Task (SU = Service Units)
SU I
Task Conclusion Time Days I
ITO Budget $ I
Initial Available CM WorkForce (WF) Persons I
Initial Average CM Skill Level - I
SD SLA - I
Minimum SD Skill Level - I
Time to Adjust CM WF Days C
Time to Adjust CM Skill Level Days C
CM Materials Effectiveness - C
CM Intangible Effectiveness - C
Time to adjust SD Productivity Days C
Cumulative Cost of Insourced CM
Capability
$ O
Cumulative Cost of Outsourced SD
Capability
$ O
SD Demand Conclusion Time Day O
Cost of Rework $ O
Penalties for Rework $ O
3.2.3 Sourcing Management
In the sourcing management view, one can decide
whether a particular IT capability will be fully
executed by the internal team or completely or
partially outsourced. We capture this behavior in our
model by dividing the diagram representing a given
IT capability into two parts: the internal part, which
allocates internal resources to build the capability
(located in the Insourced Capabilities Management
view) and the external part, located in the
Outsourced Capabilities Management view, where
additional supplier capability is requested and
allocated. In the present view, the user can set up the
model to choose the desired sourcing mode for each
capability.
3.2.4 Insourced Capabilities Management
This view (see Figure 1) contains the diagrams
representing the ITO contracting organization’s side
of the IT capabilities, among them the Contract
Monitoring (CM) capability.
We consider that a capability is effectively a
Figure 1: The Contract Monitoring Capability diagram.
productivity rate – i.e., the number of service units
(SU) processed per day. Therefore, the Contract
Monitoring capability is given by the variable
Insourced CM Productivity, in SU/Day, which is
calculated based on the productivity of the
resources involved (people, material resources,
intangible assets) using the following formula:
Insourced CM Productivity = Allocated
Insourced CM Workforce x Maximum CM Rate per
Insourced Contract
Monitoring Productivity
Maximum C o ntract
Monitoring rate p er person
per day
Contract Monitoring
Materials Effectiveness
Contract Mo nitoring
Intangibles Effectiveness
Desired CM
Worforce
Des ire d CM S kill
Level
Allocated C ontract
Monitoring
Workforce
Contract
Monitoring
Average Skill
Level
Gain o f C M S k ill
Loss of CM Skill
CM Workforce
adjustment
CM S k ill Sho rtfall
Inicia l C M S k ill
Level
Time to Adjust CM
Workforce
Time to Adjust CM
Sk ill Leve l
Available Insourced
Contract Monitoring
Workforce
CM Workforce
Allo ca tio n
CM Workforce
Dea lloc atio n
Forgetting fraction per
person per day
<Windowed Desired
CM Prod>
Inicia l Availa ble C M
Workforce
<Contract Monitoring
Average Skill Level>
SIMULTECH2014-4thInternationalConferenceonSimulationandModelingMethodologies,Technologiesand
Applications
342

Person per Day x Average CM Skill Level x CM
Materials Effectiveness x CM Intangibles
Effectiveness
Allocated Insourced CM Workforce represents
the number of people allocated to monitor the
contract; Maximum CM Rate per Person per Day is
a constant used to represent the number of service
units that an “optimally skilled” workforce is able to
process in a day. The Average CM Skill Level
parameter takes values between 0 and 1 and
represents the average fraction of the optimal skill
level presented by the internal staff. As our work is
focused on human resources, the constant CM
Intangibles Effectiveness and CM Materials
Effectiveness are just multipliers which represent the
extent to which intangible and material resources
empower staff productivity, respectively. The
highlight of this view is the dynamic behavior of
resources mobilized as capabilities governed by the
need for productivity created by the service order to
be processed (Windowed Desired CM Productivity)
and subject to various operational delays (variables
Time to Adjust CM Workforce, Time to Adjust CM
Average Skill Level).
3.2.5 Outsourced Capabilities Management
The dynamic of the provider´s capability behavior is
captured in the diagram of Figure 2.
Figure 2: Supplier’s Service Delivery Capability diagram.
If all of the organization’s own resources have
been allocated and even so the internal generated
capability is insufficient to meet demand, if
outsourcing is enabled and if there is available ITO
budget, the provider’s capability will be adjusted to
the required levels subject to a required time for this
adjustment. In our example, we use the Service
Delivery (SD) generic capability.
3.2.6 Contract Monitoring for Service
Delivery
This view (see Figure 3) captures the specifics of the
demands flow between the customer’s IT
organization and the ITO provider. This flow
reflects the contract monitoring process and the
interaction between this capability and IT service
delivery capability.
Figure 3: Interaction between Contract Monitoring and
Outsourced Service Delivery capabilities.
The Actual Contract Monitoring Productivity
variable moves the streams of new service orders
and those on warranty (rework) from the customer´s
organization to the provider, as well as the flow of
delivered services approval and defects detection.
The provider’s capability to process the demands
forwarded by the contractor is represented by the
variable Outsourced SD Productivity. Outsourced
SD Defect Injection Fraction represents the error
generation rate in service delivery.
4 ILLUSTRATION: ITO
CONTRACT MONITORING AT
SEFAZ-AL/BRAZIL
Development and validation of the System
Dynamics simulation model are ongoing in order to
provide support to ITO decision making (Bezerra
and Medeiros, 2013; Bezerra et al., 2014). The
model has been in use at the Finance and Revenue
Agency of Alagoas State, Brazil (SEFAZ-AL) which
is for tax collection and financial control of the state
administration. SEFAZ-AL has the largest IT
department and the most important outsourcing
activity in Alagoas, both in volume and in
complexity (Cunha, 2011). Having gone through
Outsourced SD
Productivity
Time to adjust SD
Prod uctivity
SD Poductivity
Adjustement
Growth in Out SD
Productivity
<ITO Budget>
Red uc tion in O ut SD
Productivity
Desired SD
Productivity
Insourced SD
Productivity
Available Insourced
SD Workforce
Enable SD
Outsource
Service Orders
to Provider
Delive re d
Services
Services to be
Corrected
(rework)
Service Orders
Forwarding Activity
Corrections Request
Forwarding Activity
Provider´s SD
Demands
Se rvice Delivery
Activity
Delivered Services
Verification Activity
<Actual Contract
Monitor ing P ro ductivity>
<Actual Contract
Monitor ing P ro ductivity>
<Actual Contract
Monitor ing P ro ductivity>
Delivered
Services with
Undetected
Defects
SD Defect
Detection Activity
Time to Detect SD
Defects
<Outsourced SD
Pro duc tivity>
Time to Detect SD
Defects Lookup
Service Orders Gen
Actibvity
<Outsourced SD Defect
Injection Fraction>
ASimulationModelforRiskManagementSupportinITOutsourcing
343

several generations of ITO, SEFAZ-AL has
experienced various contract formats and models.
For the case study to be carried out in this
section, we consider the scope of a contract that has
been in operation for only a few months. Its purpose
was to provide design and implementation services
of new information systems (projects) and to
maintain those already in production (continuous
services). We had access to records of service orders
(SO) performed during the contract. It is beyond the
scope of this paper to analyze all of these service
orders. We selected five SOs sent to the supplier
since the inception of the contract in order to build
the capacity plan for filling demands based on the
contract parameters. To illustrate the use of our
model for risk assessment, SO FIS07 was selected
because it is the largest, with greatest potential for
variation in the allocation of resources.
SO FIS07 has an expected workload of 5320
service units (SU), 163 days as expected conclusion
time and its estimated cost is $267,560. The
anticipated contract management cost is $124,609
and the cost of rework $3,240. These two latter
parameters were not originally registered by
SEFAZ-AL, but were estimated using simulation.
In what follows we study how the proposed
simulation model was applied to ITO risk
management at SEFAZ-AL following a 5-step
roadmap described in (Pfahl, 2005): 1) Defining the
risk factors; 2) Defining impacts; 3) Defining the
variation of risk factors; 4) Conducting sensitivity
analysis; 5) Analyzing the results.
4.1 Defining the Risk Factors
A number of risk factors were selected based on
important references in the ITO risk management
literature (Earl, 1996; Rivard et al., 1998; Martens
and Teuteberg, 2009; Ngwenyama and Sullivan,
2006; Ngwenyama and Sullivan, 2007; Bahli and
Rivard, 2003). It is important to emphasize that the
focus of the proposed model is on human resources
management related to IT capabilities, the Contract
Monitoring Capability in particular. Risk factors
associated with attributes of the contract itself and of
the relationship between contractor and supplier are
outside the scope of the current model.
The causal relationships between risk factors and
impact factors found in the cited references describe
a complex network, which varies greatly in terms of
granularity. In some cases, fine-grain risk factors are
combined to form intermediate risk factors, which in
turn relate to “final” impact factors or to impact
factors which can themselves be considered as
intermediate risk factors. For this reason, to relate
the parameters of our model to the risk factors
identified in the literature, we describe risk
scenarios, as in (Bahli and Rivard, 2003; Martens
and Teuteberg, 2009), which can be interpreted as
complex risk factors. For illustration purposes, the
following two risk scenarios (and related model
parameters) were selected:
RS1 – Insufficient capability of the contracting
organization in monitoring ITO contracts. In this
scenario, contracts based on performance metrics
(quality, cost, reward, penalties, revenue, etc.) are
highly impacted as it becomes costly and inefficient
to measure such metrics, which seriously
compromises the results of the ITO initiative.
In our work, we consider that the contract
monitoring process involves the following skills: the
capability to estimate effort levels and timelines for
completing tasks, to have knowledge in IT
outsourced function to check the delivered product
or services, to operate the collection and recording
of the contract performance indicators and to
negotiate with the supplier in the event of dispute.
The less experience the customer has with the
outsourced IT function, the more difficulty it will
have in checking the delivered product or service
and in estimating levels of effort and timelines for
completing tasks. The less experience the customer
has with contract management, the more difficulty it
will have in negotiating with the supplier in the
event of dispute, and in operationalizing the
collection and recording of the performance
indicators of the contract and with transferring the
operation of the contracted service to the supplier’s
environment. Concerning other categories of
resources, such as material and intangible ones, the
lack of contract management tools may represent a
bottleneck for managers’ productivity, delay closure
of invoices for payment, and cause difficulties in
calculating penalties and in timely renegotiation and
renewal of contracts. An incomplete or poorly
detailed contract can generate dispute between
contractor and supplier about scope and quality
levels of the contracted service, methodology for
calculating the quality and cost indicators, penalties
and incentives. All these facts can lead, separately or
in conjunction, to expected service conclusion time
and cost misses; to acceptance of services with low
quality level; and, to litigation with the supplier.
The contracts monitoring capability is
represented in our model by a productivity rate (CM
Productivity), measured in service units per day (SU
SIMULTECH2014-4thInternationalConferenceonSimulationandModelingMethodologies,Technologiesand
Applications
344

/ Day) and calculated as a function of the parameters
described below.
Associated model parameters are: Allocated CM
Workforce (in Number of Persons): Human
resources allocated to perform tasks related to the
ITO contract monitoring; Initial Average CM Skill
Level (no measurement units): Initial average skill
level of internal staff allocated to the ITO contract
monitoring in this function; Time to Adjust CM WF
(Day): Operating delay in adjusting the contract
monitoring human resources; Time to Adjust CM
Skill Level (Day): Time required to absorb and
apply training and/or to gain experience on contract
monitoring; Time to Detect Defects (Day): Time
required for a defect in a delivered service to be
detected by the contract monitoring team. We
modeled this parameter as a nonlinear function of
the parameter CM Capability, so its behavior is
endogenous; CM Materials Effectiveness (no
measurement units): Effective contribution that
material resources make to the contract monitoring
capability; CM Intangible Effectiveness (no
measurement units): Effective contribution that
intangible resources make to the contract monitoring
capability.
RS2 – Insufficient capability of the supplier to
deliver the contracted service. Our work is focused
on managing the contracting organization’s
resources and how to configure them to build IT
capabilities. Therefore, we consider the supply-side
capabilities in a consolidated basis (as a cloud). The
supplier´s service delivery capability involves the
following skills: knowledge of the outsourced IT
function and ability to deliver the product or service
according to the performance parameters specified
in the contract.
The less technical knowledge the supplier has on
the outsourced IT function, the more he will fail to
meet agreed performance requirements and this will
directly affect the quality of the service delivered.
Non-compliant delivered services will be re-
submitted to the vendor for corrections, which will
delay the expected completion time for the service.
The more re-work is generated, the more contract
monitoring working hours will be consumed re-
checking delivered services. This will increase
contract monitoring costs. Rework over the
parameters agreed in the contract will also generate
penalties and extra operational costs for the supplier,
decreasing its profitability and causing it to reduce
interest in the contract.
The service delivery capability is represented in
our model by a productivity rate (SD Productivity),
measured in service units per day (SU / Day).
Associated model parameters are: Time to Adjust
SD Productivity (Day): Operating delay to adjust the
service delivery capability; Minimum SD Skill
Level (no measurement units): Minimum average
capability of the supplier’s staff allocated to perform
the outsourced IT function. This parameter
influences the variable SD Defect Injection Fraction;
SD SLA (no measurement units): Service Level
Agreement parameter is a real number between 0-1
that represents the minimum quality level of the
delivered services. We say that a fraction (1–SD
SLA) of the delivered service units will have defects
and will need to be reworked. This parameter
doesn’t influence penalties but influences the total
cost of rework, which affects the supplier’s
profitability.
4.2 Defining the Impacts
The impact factors are attributes of the entities
involved in IT services (client, provider, service
itself), usually representing their performance
indicators such as cost, completion time, quality
level, satisfaction level, which are affected by
changes in risk factors. Based on the same rationale
given in section 5.1, here we describe impact
scenarios as combinations of impact factors
reaching certain conditions.
Based on the risk scenarios selected and on the
causality relationships identified in the ITO risk
management literature, the following impact
scenarios are of interest.
IS1 – Exceed ITO budget. This impact scenario
arises when the expected cost for service orders is
exceeded. Associated model parameter is the
Cumulative Cost of SD Capability ($): Cost of the
capability used to process all service units from a
service order.
IS2 – Exceed the expected service conclusion
time. This impact scenario when the expected
conclusion time for service orders is exceeded.
Associated model parameter is the: SD Demand
Conclusion Time (Day):
Number of days that a
supplier requires to process a service order’s service
units completely.
IS3 – High contract management cost. The costs
of internal resources are usually neglected or not
computed in public sector outsourcing processes,
where salaries of career employees are not
considered as part of the projects/program budget
(Carvalho, 2009). The effort (and cost) involved in
managing contracts in Brazil typically represent
between 30% and 40% of the related service cost
ASimulationModelforRiskManagementSupportinITOutsourcing
345

(Carvalho, 2009). Exceeding this threshold means
incurring additional management costs.
Associated model parameter is the Cumulative
Cost of Insourced CM Capability ($): Cost of the
capability used for monitoring ITO contracts.
IS4 – Premature contract termination and service
discontinuity or debasement. This impact scenario
is more subjective. From the customer’s point of
view one can monitor indications that the supplier is
losing money or is not achieving the profitability
projected at the beginning of the contract. Therefore,
the supplier has reduced interest in continuing the
relationship. Thus, in a possible replacement
scenario, services may be discontinued or have their
quality compromised by the lack of resources for
their proper functioning.
Associated model parameters are: Cost of
Rework ($) which is the cost to the supplier to
correct detected defects in delivered services; and,
Penalties for Rework (Number of Penalties) which
is the number of penalties issued to the supplier
upon reaching a contractually agreed rework index.
All “expected values” mentioned in the
description of impact scenarios are established
relative to a baseline. This baseline can be
constructed from empirical data, interviews with
experts or generated synthetically using simulation.
4.3 Relationships between Risk and
Impact Scenarios
Figure 4 summarizes the cause-and-effect relations
of risk and impact scenarios within the model.
Figure 4: Cause-and-effect relationships between risk and
impact scenarios.
These relations were established based on (Earl,
1996; Rivard et al, 1998; Bahli and Rivard, 2003)
and on interviews with experts from SEFAZ-AL.
Figure 4 includes hypotheses to be explored in the
sensitivity analysis in 4.5.
4.4 Variation of Risk Factors
The range of risk factor values reflects the
uncertainty with which decision makers predict
impacts. Such uncertainties are generated
stochastically by varying the model input variables
(risk factors) according to probability distribution
functions. These functions are constructed based on
empirical data and goodness-of-fit tests or the
triangular probability distribution function is used
with parameters estimated by experts. Here, we use
estimates from SEFAZ-AL experts. It is important to
emphasize that the subjective estimation of
numerical parameters made by experts based on
their experience and knowledge does not violate the
quantitative nature of our approach. Also note that
history (information in logs), conditions (such as
physical, temporal or financial limitations) and
guidelines (such as those established in corporate
policies) may reduce the “subjectivity” in providing
estimates.
To better understand the impacts caused by
variation in risk factors, these variations will be
divided into (a) Contractor conditions and; (b)
Supplier conditions, as laid out in Table 2.
Table 2: Risk factor variation.
Parameters
Estimated values
Min Exp Max
Customer conditions
Initial Available CM Workforce 2 5 7
Initial Average CM Skill Level 0,4 0,7 1
Time to Adjust CM WF 5 15 30
Time to Adjust CM Skill Level 10 30 40
CM Materials Effectiveness 1 1,3 1,5
CM Intangible Effectiveness 1 1,3 1,5
Supplier conditions
Time to Adjust SD Productivity 5 15 30
SD SLA (Minimum Level of
Service)
0,95 0,99 1
Minimum SD Skill Level 0,5 0,8 1
4.5 Sensitivity of Impact Factors
The sensitivity charts generated by the Vensim DSS
simulation environment allow an intuitive visual
analysis where it is possible to see the magnitude of
the impacts caused by the realization of risk
conditions at different confidence intervals. Without
any thorough statistical analysis, one can observe the
RS1 - Insufficient
Contract Monitoring
Ca pability
RS 2 - Insufficient
Servic e Delivery
Capability
IS3 - High Contract
Management Cost
IS1 - Exceed ITO
Budget
IS2 - Exceed Expected
Service Conclusion Time
IS4 - Premature Contract
Termination and Service
Discontinuitiy or Debasement
+
+
+
+
+
+
+
+
+
SIMULTECH2014-4thInternationalConferenceonSimulationandModelingMethodologies,Technologiesand
Applications
346

cumulative probability of an impact factor exceeding
an expected value.
Figure 5 shows the variation of the impact factor
Cumulative Cost of SD Capability. Figure 6 shows
the variation of the impact factor Cumulative Cost of
Insourced CM Capability.
In all 200 simulations performed for the
sensitivity analysis, the Latin Hypercube sampling
technique with a default noise seed (1234) and
triangular probability distributions with the ranges in
table 2 were used to generate the multivariate
random sample of risk factors. The Latin Hypercube
sampling ensures that the full range of each
parameter being varied is explored more evenly and
consistently in the simulations.
The solid line (peak) is the simulation result for
the scenario in which all risk factors simultaneously
assume their expected values. It is the baseline for
the risk analysis. The dashed line in Figure 6
indicates the median of values for the Cumulative
Cost of Insourced CM Capability.
The shaded areas represent the confidence
intervals adopted for the sensitivity analysis, where
50% (light gray), 75% (gray), 95% (dark gray) and
100% (black) of simulated impact factors are
located. The limits of the black area represent the
situation of the maximum and minimum impacts on
service performance.
Each simulation runs for 400 days. This end-of-
simulation condition was adopted because this time
period holds more than double the estimated
simulated SO completion time and it is possible to
observe all behaviors of interest.
Besides the sensitivity charts, the simulator
generates histogram charts and the main statistical
estimators (mean, median, standard deviation,
minimum value, maximum value, normalized
standard deviation). This information enables
various statistical analyses on the impact factors,
including the identification of their probability
distribution functions.
Note that Figures 5 and 6 show, besides the
dynamic behavior of the output variables over time,
the variation of such behavior in response to
variation (simultaneously or not) of the input
parameters.
4.6 Analysis of Simulation Results
Following the risk management cycle, the
information gathered from the sensitivity analysis
(the risk assessment) can be used to prioritize risks,
invest in risk prevention, risk control and risk
mitigation activities. It is possible to calculate
potential financial losses and to quantify indicators
that can be used to support qualitative or subjective
management decisions.
Figure 5: Cost of service (peak = $267,560).
Figure 6: Total contract monitoring cost (peak=$124,609).
The dashed line indicates the median.
To better understand the impacts of risk factors,
we divided the sensitivity analysis into two
subsections. First, we recorded the effects of
uncertainty about the contracting organization’s
conditions over the impact factors. Then, we
recorded the impacts caused by uncertainty about the
supplier’s conditions.
The impacts will arise when the expected values
(peak line) for the impact factors are exceeded. The
polarity of the relationship between risk factors and
impact factors will define in which region of the
graph undesirable values will be located. For
instance, if x is the expected cost of a service order
to the supplier and F (x) the probability distribution
function associated with this cost, the probability of
service budget overrun is 1 - F (x ≤ expected cost). F
can be identified as the Chi-Square function from
the frequency distribution of outputs using
goodness-of-fit tests.
50% 75% 95% 100%
Cumulative Cost of TOC Capability
1 M
750,000
500,000
250,000
0
0 100 200 300 400
Time (Day)
p
50% 75% 95% 100%
Cumulative Cost of Insourced CM Capability
143,495
133,333
123,170
113,008
102,845
0 100 200 300 400
Time (Day)
125,781
Confidence intervals
Confidence intervals
ASimulationModelforRiskManagementSupportinITOutsourcing
347
4.6.1 Varying the Customer’s Conditions
In total, 200 simulations were performed in which
all model parameters related to the contract
monitoring capability of the ITO customer
organization varied simultaneously.
Impact on Service Order Cost
Figure 5 shows the cost accumulation of the
capability employed to execute the service order.
Analyzing the behavior of the peak line, its shape
shows a slight exponential growth in the initial
phase of the simulation, during which the service
delivery capability is being allocated and used. The
inflection point indicates the time when this
capability begins to be demobilized and its
accumulated costs tend to stabilize (stop growing).
This fact indicates that the service order has been
fully executed. In terms of sensitivity analysis, the
location of the peak line in relation to confidence
intervals reveals a very unfavorable prognosis for
the execution of the service order within the planned
cost. Visually, one can estimate that between 50%
and 75% of the simulation results exceed the budget
for the service order. It is interesting to note in
Figure 5 that the confidence intervals for 50% and
75%, the output variable reaches a stable value
within the simulated period (400 days). Not so in the
confidence intervals of 95% and 100% 400 days
were not enough to conclude the SO. We increased
the simulation period for up to 1000 days and the
cost variable reached the stable state for these
confidence intervals. Table 3 shows the confidence
bounds for the cost of the SO.
Table 3: Confidence bounds for the cost of service.
Conf. Bound Min Cost Max Cost
50% $270,690 $341,580
75% $266,470 $420,400
95% $265,900 $663,824
100% $265,852 $803,276
All peak $267,560
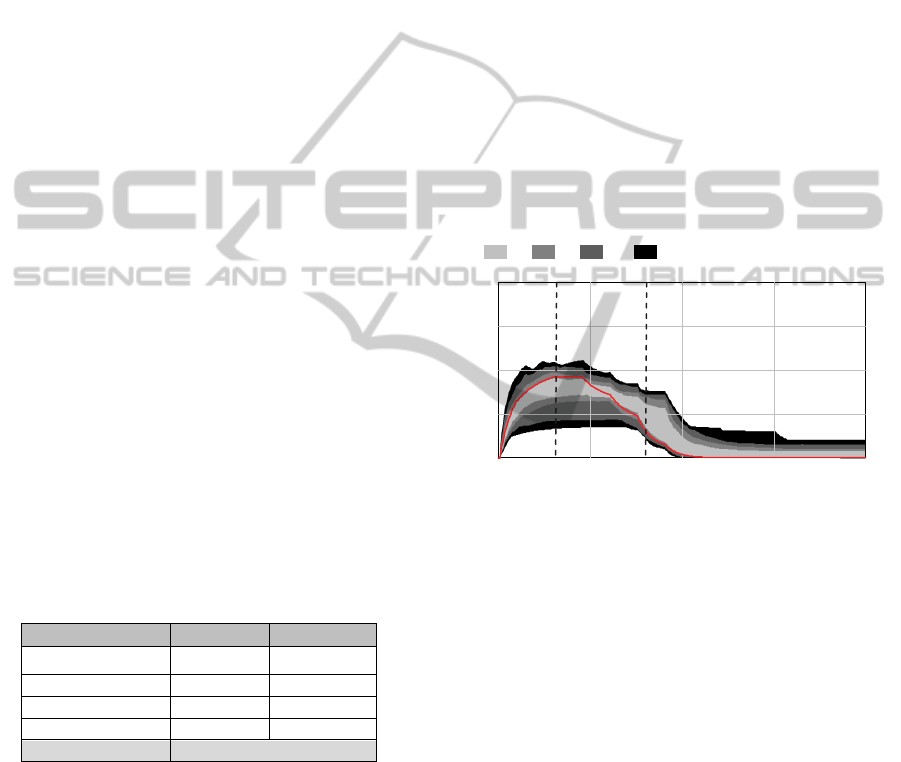
Figure 7 shows the dynamic changes in the
customer’s contract monitoring (CM) capability
level caused by the variation of the parameters that
comprise it. Analyzing the behavior of the peak line,
its shape shows that the level of CM capability
grows to its maximum point at the 60th day of
simulation. The concavity of the curve indicates that
this growth is happening in a balance loop,
controlled by the variable Desired Insourced CM
Capability which limits the amount of capability to
be allocated. However it is important to emphasize
that this limit is not fixed throughout the simulation
period. The maximum point of the curve represents
the time when the maximum capability required to
run the SO was reached. This point is not necessarily
a horizontal asymptote, as there may be still
available resources that can be allocated on demand
and generate more capability. After a period at the
maximum point, the curve starts to descend
indicating capability deallocation until the
conclusion of the SO.
Regarding the sensitivity analysis it is observed that
most unfavorable values (below the expected level)
for this capability were generated before the
expected completion of the SO, i.e., 163 days. This
fact was caused by the generation sequence of input
values taken by Latin Hypercube (LH) sampling
algorithm and will influence the results obtained by
the sensitivity analysis of the completion time of the
OS. More about this fact in the next section.
Figure 7: Dynamic changes in customer’s contract
monitoring capability.
Examining the histogram for the SO execution
cost (not shown here) it was observed that the
distribution resembles a negative exponential
distribution. Therefore, given that the average of 200
simulations of the SO execution cost is $327,993,
the cumulative probability of a budget overrun is
approximately [1-P (x ≤ $267,560)] = 55.77%.
Impact on Service Order Conclusion Time
Table 4 shows that the expected conclusion time is
reached only by the peak line. This behavior is not
initially intuitive, producing the following question:
why is the expected completion time never achieved
even when risk factors assume favorable values?
The answer lies in observing the locations between
the confidence interval 50% to 75% related to the
peak line in figure 7. It is possible to realize higher
contract monitoring capability values below the peak
line near the 100th simulation day.
50% 75% 95% 100%
N
ominal Contract Monitoring Productivit
y
400
300
200
100
0
0 100 200 300 400
Time (Day)
163
60
SIMULTECH2014-4thInternationalConferenceonSimulationandModelingMethodologies,Technologiesand
Applications
348

Table 4: Confidence bounds for SO Conclusion Time.
FIS07 SO Conclusion Time
Conf. Bound Min Max
50% 163 169
75% 163 177
95% 163 978
100% 163 980
All peak 163
This situation begins to reverse after the 100th
day, when there is a higher concentration of
favorable levels of this capability (above the peak
line). However, this actually happens near the
estimated SO completion time (day 163), causing a
large concentration of simulation outcomes where
the completion time of the OS is exceeded. This can
be considered a “side effect” of the sequence of
values that the Latin Hyperbole sampling algorithm
generated for the variables that comprise the contract
monitoring capability for some runs.
Impact on Contract Monitoring Cost
For this intermediate risk factor, the relative position
of the confidence intervals is more centralized, as
shown in Figure 6, tending to a normal distribution.
The peak line is slightly below the median
($125,781), indicating the predominance of
unfavorable results in terms of cost. Assuming F(x)
is a normal probability distribution, the cumulative
probability of contract monitoring costs being higher
than anticipated is [1- F(x≤$124,609)] = 0.6543, i.e.,
risk materializes in 65.43% of the simulations.
Impact on Rework
Rework is a crucial stage for risk analysis in ITO
and in general project management. Two model
variables related to rework were analyzed: the
number of penalties generated and the cost of
rework. In 50% of the simulations the number of
penalties converged to the expected value and in
75% the number deviated from the expected value
by only one penalty. The same happened with the
cost of rework. This implies that variations in
contract monitoring capability will not impact the
amount of generated rework but, rather, will
influence the time taken to detect defects.
In a direct way, the factors related to rework
impact the supplier financially and indirectly affect
the relationship between customer and supplier. For
all contracts analyzed within this model, the supplier
is financially penalized because it bears the costs of
penalties (not calculated here) and the operating cost
of reworking.
We conclude this section by summarizing that
the simulated uncertainty levels in the customer’s
conditions causes direct impacts on the service’s
conclusion time (IS2) and in contract management
cost, which is an endogenous risk factor related to
exceeding the budget for the service (IS1). Service
conclusion time overruns can bring indirect impacts
to the custmer, depending on how the outsourced
service is related to the business layer. The high cost
of contract management related tasks (IS3) is often
overlooked by public organizations in Brazil since
they do not include wages of the internal team
responsible for this task in IT projects budgets.
Univariate simulations which vary the
customer’s risk factors one at a time were also
undertaken in order to identify which had the most
impact. The Initial Contract Monitoring Workforce
factor is responsible for the greatest variation in the
impact factors. Therefore, the model indicates that a
more effective action to control or mitigate the risks
of insufficient contract monitoring capability is to
ensure sufficient human resources are allocated to
this activity. Of course, the other components that
comprise this capability are also important and
should be considered when mitigating this risk.
Investing in training and contract management tools,
using methodologies and expertise to more
accurately estimate the effort and cost of IT projects
are actions that can mitigate risks associated with
costs overrun.
4.6.2 Varying the Supplier’s Conditions
200 simulations were performed varying
simultaneously all model parameters related to the
supplier´s service delivery capability, namely: Time
to Adjust SD productivity, Minimum SD Skill Level
and SD SLA (Service Level Agreement).
Surprisingly, changes imposed on the supplier's
conditions did not cause significant changes in the
cost of the service, the cost of contract monitoring or
in the service conclusion time. These factors
exceeded expected values by up to 16%, 8% and
12% respectively.
The most significant impacts were on the number
of penalties incurred and the cost of rework. These
factors more than doubled in 70% of simulations
and, in the worst case increased by up to 400%
compared to the expected value. The risk factor to
which impact factors were most sensitive was the
Service Level Agreement, associated with the
overall quality of service provided in relation to the
percentage of defects generated.
ASimulationModelforRiskManagementSupportinITOutsourcing
349

The most subjective impact being predicted (IS4:
premature contract termination caused by low
profitability for the supplier) has a high probability
of arising in this scenario based on the indicators
chosen here to represent the quality of the
relationship between customer and supplier.
The simulations performed can provide multiple
insights for decision makers regarding prevention
and control of premature contract termination, which
may compromise the quality of services and the
achievement of planned benefits. The effects of a
supplier’s low service delivery capability go beyond
the obvious and immediate delay in projects. They
can compromise the quality of the relationship and
the profitability of the contract, affecting the
supplier itself, which could not withstand such
impacts for long.
It is important that the customer monitors its
suppliers’ level of satisfaction in order to anticipate
scenarios where switching supplier is needed -
typically a complex and costly process in Brazilian
public organizations.
4.7 Implications of the Proposed Model
to Risk Management at SEFAZ
Risk management at SEFAZ is currently carried out
with a tool that uses a qualitative approach based on
compliance. In this tool, a governance map is built
associating objects in 3 different layers: business
process in the strategic layer, IT processes in the
tactical layer and IT asset (material resources,
systems and human resources) in the operational
layer. Qualitative levels of importance (low,
medium, high) are assigned to each of the
connections between objects. A set of controls is
associated with each category of IT assets. These
controls represent risk factors to which each asset is
subject. The process of risk assessment with this tool
consists in informing whether or not the controls are
implemented. At the end of this process, qualitative
risk indices (very low, low, medium, high, very
high) are calculated for each asset and propagated to
the strategic layer through the links defined on the
governance map.
We have interviewed four users of such tool (an
information security officer, an IT manager, a
business process manager and a software project
manager) on the tool´s utility for them. They think
the way risks are currently measured / reported
suffices to prioritize them based on the indices. On
the other hand, the qualitative nature of such indices
does not allow decision makers to estimate actual
extent of impacts and thus precludes trade off
analyses of investments when addressing those risks.
They believe the proposed model will facilitate these
estimation and analyses.
5 CONCLUSIONS AND
OUTLOOK
In this paper we showed how our model to support
decision making in ITO and in IT capabilities can be
used to analyze and prioritize risks. Following the
risk assessment procedure in (Pfahl, 2005) applied to
the context of a Brazilian state tax and finance
agency (SEFAZ-AL), we analyzed the impact of two
kinds of risks (lack of contract monitoring capability
in contracting organizations and lack of service
delivery capability in suppliers) on the ITO budget,
on the deadline for completion of services and on the
relationship between contractor and supplier.
Our experiments indicate that a lack of contract
monitoring capability in ITO contracting
organizations directly impacts on service conclusion
time and influences the cost of contract
management, which is an endogenous risk factor
related to exceeding the service budget. It was also
found that low levels of service delivery capability
in the supplier most significantly impact the cost of
rework and the number of penalties. These
endogenous factors influence supplier profitability
and may induce early termination of the contract.
The base model used in this study underwent a
complete validation cycle (see Bezerra et al., 2014).
However our implementation of risk assessment is a
new feature that has gone through the initial stages
of validation and verification (tests of structure, tests
of behavior). In order to complete validation of its
utility for supporting risk-based decision making for
ITO, the model needs to undergo new tests of
learning with the same interviewed group of users,
as well as a more comprehensive comparative study
between our approach and the currently risk
assessment approach used at SEFAZ.
ACKNOWLEDGEMENTS
Authors thank the Science Without Borders Program
from CAPES/ Ministry of Education of Brazil
(www.capes.gov.br) for partially funding this work.
Comments and suggestions from Prof. Dr. Dietmar
Pfahl from the University of Tartu, Estonia and from
anonymous reviewers are also gratefully
acknowledged.
SIMULTECH2014-4thInternationalConferenceonSimulationandModelingMethodologies,Technologiesand
Applications
350

REFERENCES
Abdel-Hamid, T. K., Madnick, S. E. (1991) Software
Project Dynamics: An Integrated Approach, Prentice-
Hall.
Bahli, B., Rivard, S. (2003) 'The information technology
outsourcing risk:a transaction cost and agency theory-
based perspective', Journal of Information
Technology, (September, 2003) 18, 211-221.
Bahli, B., Rivard, S. (2005) 'Validating measures of
information technology outsourcing risk factors',
Omega, 332, 175-187.
Barney B. (1991) 'Firm resources and sustained
competitive advantage', Journal of Management,
vol.17, pp.99-120.
Bezerra T.R., Medeiros V. R. (2013) 'Managing
customers’ IT capabilities in IT outsourcing over time:
A system dynamic approach', Proceedings of the 8th
IFIP/IEEE International Workshop on Business-
driven IT Management - BDIM.
Bezerra T.R., Sampaio, A., Moura, J.A. (2014) 'A system
dynamics model to support strategic decision making
on IT Outsourcing: A case study at a state revenue
agency in Brazil’, Proceedings of the 9th IFIP/IEEE
International Workshop on Business-driven IT
Management - BDIM.
Carvalho, S. (2009) 'Um processo para gestão de contratos
de aquisição de serviços de desenvolvimento de
software na administração pública', master
dissertation, UFPE, Recife, Brazil, Sep. 2009.
Costa, M. D., Braga, J.L., Abrantes, L.A., Ambrósio, B.G.
(2013) 'Support to the Decision Making Process in
Human Resources Management in Software Projects
Based on Simulation Models', Revista Eletrônica de
Sistemas de Informação, v. 12, n. 1, jan-mai 2013,
artigo 51 doi:10.5329/RESI.2013.1201005.
Cunha, Mônica C. (2011) 'Aspectos e Fatores da
Terceirização de Sistemas de Informação no Setor
Púbico: Um Estudo em Instituições Públicas de
Alagoas”. Tese de Doutorado. Universidade Federal
de Pernambuco'. In Portuguese.
Earl, M.J.(1996) 'The Risk of Outsourcing IT', Sloan
Management Review/Spring 1996.
Garousi, V., Khosrovian, K. and Pfahl, D. (2009) 'A
customizable pattern-based software process
simulation model: design, calibration and application',
Softw. Process: Improve. Pract., 14(3): 165–180.
Gui-sem, W., Xiang-yang, L. (2010) 'The Risk Analysis
on IT Service Outsourcing of Enterprise with System
Dynamics', International Conference on Service
Sciences, DOI 10.1109/ICSS.2010.47.
Houston, D. X., Mackulak, G. T., Collofello, J. S. (2001)
'Stochastic simulation of risk factor potential effects
for software development risk management', JSS
59(3), 247-257.
International Standards Organization (2008) ISO
31000:2008 - Risk Management: Principles and
Guidelines on Implementation.
Jorfi, S., Nor, K. and Najjar, L. (2011) ‘Assessing the
impact of IT connectivity and IT capability on IT-
business strategic alignment: an empirical study’,
Computer and Information Science, vol. 4, pp. 76-87.
Lacity, M. C., Khan, S. A., Willcocks, L. P. (2009) 'A
review of the IT outsourcing literature: Insights for
practice', The Journal of Strategic Information
Systems, 18(3), 130-146. Elsevier B.V.
Lacity, M.,Khan, S., Yan, A., Willcocks, L. (2010) 'A
review of the IT outsourcing empirical literature and
future research directions', Journal of Information
Technology, v.25, pp. 395-433.
Lin, C.Y., Abdel-Hamid, T.K., Sherif, J.S. (1997)
'Software-Engineering Process Simulation Model'
(SEPS). JSS 38, 263-277.
Martens B., Teuteberg F. (2009) 'Why risk management
matters in IT outsourcing: a literature review and
elements of a research agenda', Proceedings of the
17th European Conf. on Information Systems, p. 1-13.
Ngwenyama, O. K., Technology, I., Sullivan, W. E.,
Patricia, B. (2006) 'Secrets of a Successful
Outsourcing Contract: A Risk Analysis Framework for
Analysing Risk Factors. Technology, (416), 1-12.
Ngwenyama, O. K., & Sullivan, W. E. (2007) Outsourcing
contracts as instruments of risk management: insights
from two successful public contracts', Journal of
Enterprise Information Management, 20(6), 615-640.
Osei-Bryson, K.M., Ngwenyama, O.K. (2006) 'Managing
risks in information systems outsourcing: An approach
to analyzing outsourcing risks and structuring
incentive contracts', European Journal of Operational
Research, 174 (1), 245-264.
Pfahl D. (2005) 'ProSim/RA – Software Process
Simulation in Support of Risk Assessment'. In: Biffl S,
Aurum A, Boehm B, Erdogmus H, Grünbacher P
(eds.) Value-based Software Engineering, Springer
Press, Berlin, pp 263–286.
Rivard, S., Albert, B., Patry, M. (1998) 'Assessing the
Risk of IT Outsourcing', IEEE, 1998.Rivard, S.,
Albert, B., Patry, M., Dussault, S. (1998) 'Managing
the Risk of IT Outsourcing', IEEE, Montreal.
Tan, B., Anderson Jr., E.G., Dyer, J.S. and Parker, G.G.
(2010) 'Evaluating system dynamics models of risky
projects using decision trees: alternative energy
projects as an illustrative example', System Dynamics
Review, vol 26, No 1, pp 1–17, January–March, 2010.
Willcocks, L. P., Lacity, M. C., Kern, T. (2000) 'Risk
mitigation in IT outsourcing strategy revisited :
longitudinal case research at LISA', Information
Systems, 8(1999), 285-314.
ASimulationModelforRiskManagementSupportinITOutsourcing
351
