
Influence of Resource Allocation in the Photovoltaic R&D of Japan
based on Technology Stock Modeling
Eiichi Endo
National Institute of Advanced Industrial Science and Technology, 1-2-1, Namiki, Tsukuba, Ibaraki, 305-8564 Japan
Keywords: Solar Cell, R&D, Resource Allocation, Technological Progress Model, Technology Stock, Module Price,
Market Share.
Abstract: In Japan, crystalline silicon solar cells have a large market share in production, however they have not been
a priority in R&D. This paper analyzes the influence of resource allocation in the photovoltaic (PV) R&D in
Japan on the price of solar cells and the market share in world solar cell production. Firstly, it finds that the
price of solar cells in Japan, with respect to the resource allocation in R&D of crystalline silicon solar cells,
did not reduce significantly but maintained a constant level. For the projection, it does not use an experience
curve, but models technological progress and price reduction of solar cells in Japan, excluding mass
production effects, based on technological knowledge stock modeling. Secondly, solar cell prices in other
countries are estimated based on their market share of the world's solar cell production. The estimated solar
cell price in Japan is reduced by up to 40% from the actual price, and is competitive to the estimated solar
cell prices in China and Taiwan. In this case, Japan could maintain its high share in the world solar cell
production for a few years longer. This analysis will contribute to cost-effective R&D resource allocation by
a simulation approach.
1 INTRODUCTION
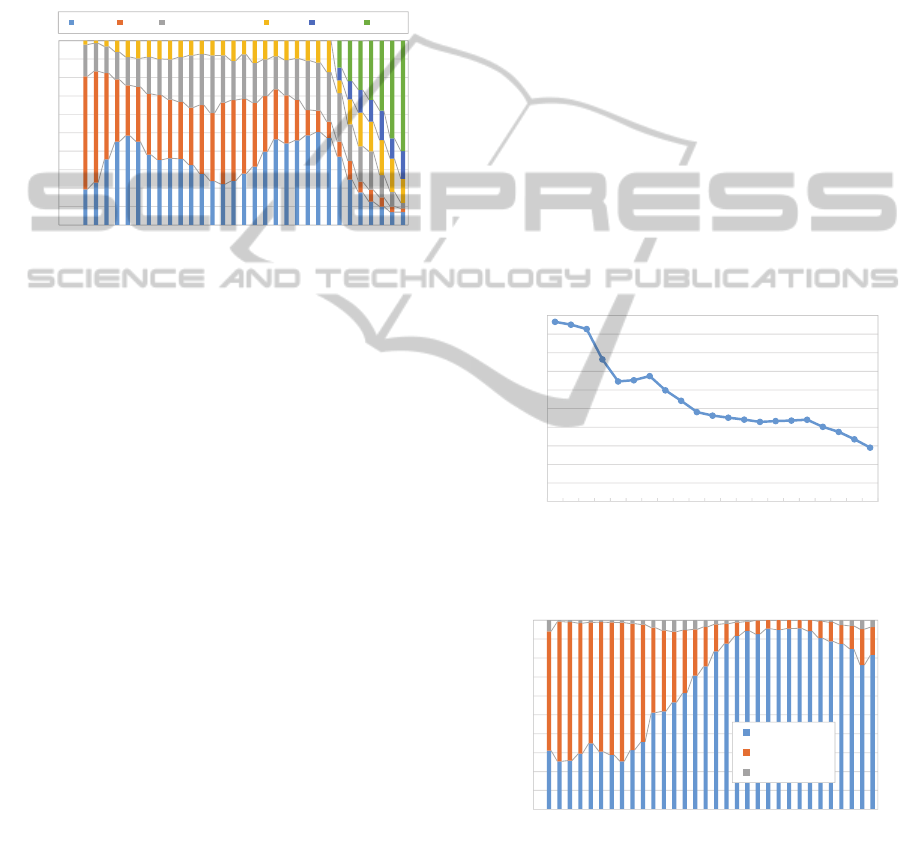
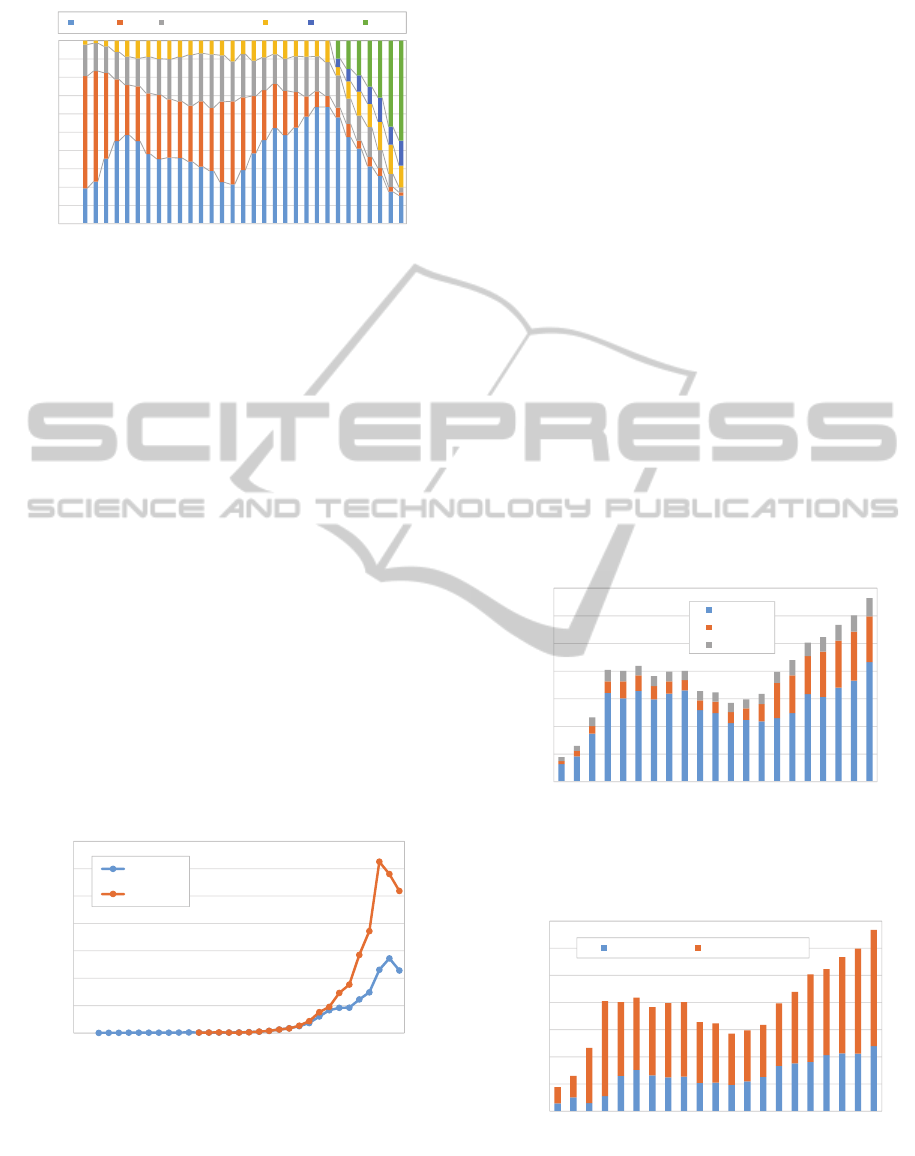
Figure 1 shows the market share of the world solar
cell production by country (IEA-PVPS, 1998, 2013,
Maycock, 1982,…,2006). The market share of Japan
had increased by up to 50% from 1995 to 2004.
However, after that, Japan has lost its market share,
declining rapidly to 7%. Instead of Japan, China and
Taiwan have rapidly expanded their market share. A
few of the reasons why Japan has lost its market
share, according to New Energy and Industrial
Technology Development Organization (NEDO),
one of the governmental funding agencies of Japan,
are that Japanese solar cell manufacturers could not
import enough materials made of silicon and they
could not keep up with the large investments made
by China and Taiwan. However, prior studies point
out other problems in the photovoltaic (PV)
technology development and industrial policies of
the government (Endo, 2003, Oshika, 2013).
Most analyses regarding solar cell technologies, for
example, price projection, are based mainly on the
experience curve (IEA, 2000). However, it cannot
distinguish between the effects of mass production
and technological progress. Other than the
experience curve, other approaches, such as the
analysis of cost factors (Nemet, 2006), life cycle
assessment (LCA) (Yamada, 2012), and analysis of
technology development (Watanabe, 2000), were
used for analyzing solar cell technologies and
projecting their costs, but there are no studies
focusing on the resource allocation in PV R&D.
Based on the background mentioned above, this
paper focuses on R&D of crystalline silicon solar
cells (single and multi-crystalline silicon solar cells)
in Japan, from a resource allocation point of view,
and analyzes its effects on price reduction of solar
cells and change in market share of the world's
production of solar cells. This analysis is not based
on the experience curve, but models price reduction
as a result of R&D, excluding the effects of mass
production, and adopts the technology knowledge
stock approach. On the other hand, price ratios of
solar cells between Japan and other countries are
estimated based on their market share of the world
solar cell production. The analysis shows the
influence of resource allocation in PV R&D of Japan
709
Endo E..
Influence of Resource Allocation in the Photovoltaic R&D of Japan based on Technology Stock Modeling.
DOI: 10.5220/0005038007090716
In Proceedings of the 4th International Conference on Simulation and Modeling Methodologies, Technologies and Applications (SIMULTECH-2014),
pages 709-716
ISBN: 978-989-758-038-3
Copyright
c
2014 SCITEPRESS (Science and Technology Publications, Lda.)
on the price of indigenous solar cells and market
share of the world's solar cell production.
A combination of the technological progress model
of solar cells, the world solar cell market model, and
the dissemination model for residential PV systems
(Endo, 2014) suggests the possibility of utilizing a
simulation approach to achieve cost-effective
resource allocation in PV technology development.
0
10
20
30
40
50
60
70
80
90
100
1980 1984 1988 1992 1996 2000 2004 2008 2012
Solar cell production (%)
(Year)
Japan USA Europe/Germany ROW Taiwan China
Figure 1: Market share of the world solar cell production
by country.
2 MODELING OF
TECHNOLOGICAL PROGRESS
OF SOLAR CELLS
2.1 Solar Cell Price
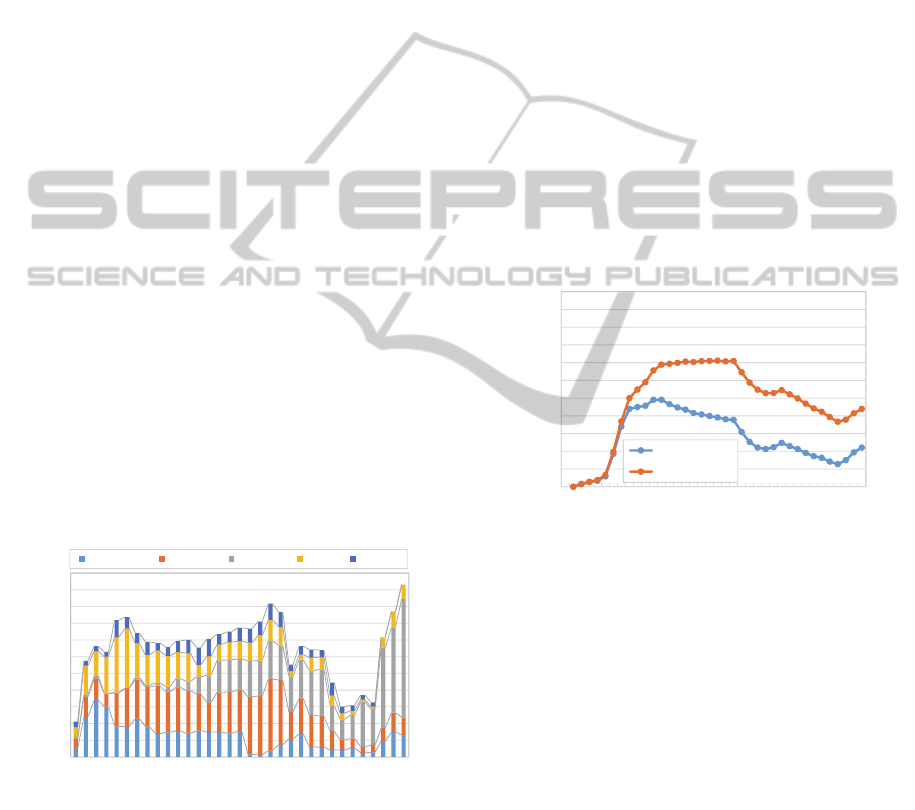
Figure 2 shows the module price of solar cells in
Japan (IEA-PVPS, 2013), which has been reducing
steadily since 1992. However, it was affected by
increases in silicon price and almost stabilized in the
middle of the 2000s. After 2008, the price of solar
cells dropped rapidly due to oversupply in the world
solar cell market. The price can be regarded as the
module price of crystalline silicon solar cells, as
crystalline silicon has had a large market share in the
solar cell production of Japan, except in the early
years, when solar cells were used mainly in
calculators, as shown in Figure 3.
The module price declined from 966 JPY/W in 1992
to 290 JPY/W in 2012. This price reduction to 0.300
(=290/966) of the 1992 level was because of
technological progress and the effects of mass
production, such as economies of scale and learning-
by-doing. For modeling technological progress, that
is, price reduction due to R&D, the effects of mass
production are removed in the following manner.
Regarding the effects of mass production, economies
of scale is estimated using LCA. Yamada, 2012
showed that the module cost was 350 JPY/W ten
years ago, at a production scale of 10 MW/year. It is
now 144 JPY/W at the production scale of 1
GW/year. In this case, the effects of economies of
scale are computed to be 40 JPY/W. This means that
the price, reduced by 10 times of the scale up, is
0.941 = ((310/350)^0.5). For this analysis, instead of
the total annual production of crystalline silicon
solar cells in a production line or a company, the
indigenous production of Japan is used as the annual
production. For the figures on cumulative
production, total cumulative production of
crystalline silicon solar cells in Japan is used. The
annual and cumulative solar cell production
increases are 401 times and 334 times, respectively,
during the last 20 years. If the price, reduced by 10
times of the scale up, is rounded and assumed as
0.94, the price reduction due to economies of scale
during the last 20 years is 0.851 = (0.94^
log
10
(401)).
0
100
200
300
400
500
600
700
800
900
1000
199219962000200420082012
Module price (JPY/W)
(Year)
Figure 2: Solar cell price in Japan.
0
10
20
30
40
50
60
70
80
90
100
1980 1984 1988 1992 1996 2000 2004 2008 2012
Solar cell production (%)
(Year)
crystalline Si
thin film Si
others
Figure 3: Solar cell production in Japan by cell
technology.
The progress ratio (PR) (IEA, 2000) includes
technological progress and the effects of mass
production, and is 0.866 = 0.300^(1/log
2
(334)) =
SIMULTECH2014-4thInternationalConferenceonSimulationandModelingMethodologies,Technologiesand
Applications
710
(2^-E), with (E=0.207). However, PR for only
learning-by-doing is assumed to be 0.991 (price
reduction of 0.97 for 10 times of the cumulative
production). In other words, price reduction during
the last 20 years is assumed to be 0.926 with
learning-by-doing (=0.991^log
2
(334) or
0.97^log
10
(334)) and 0.381 (=0.300/(0.851*0.926))
with technological progress due to R&D.
2.2 R&D Expenditures for PV
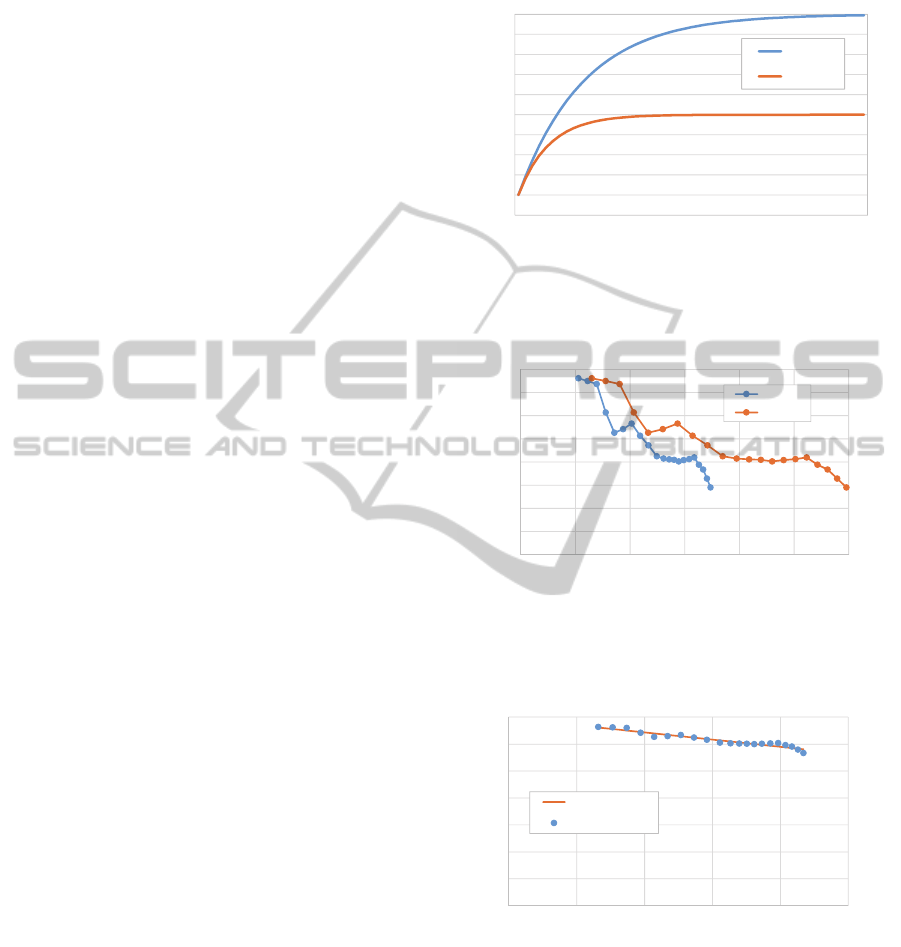
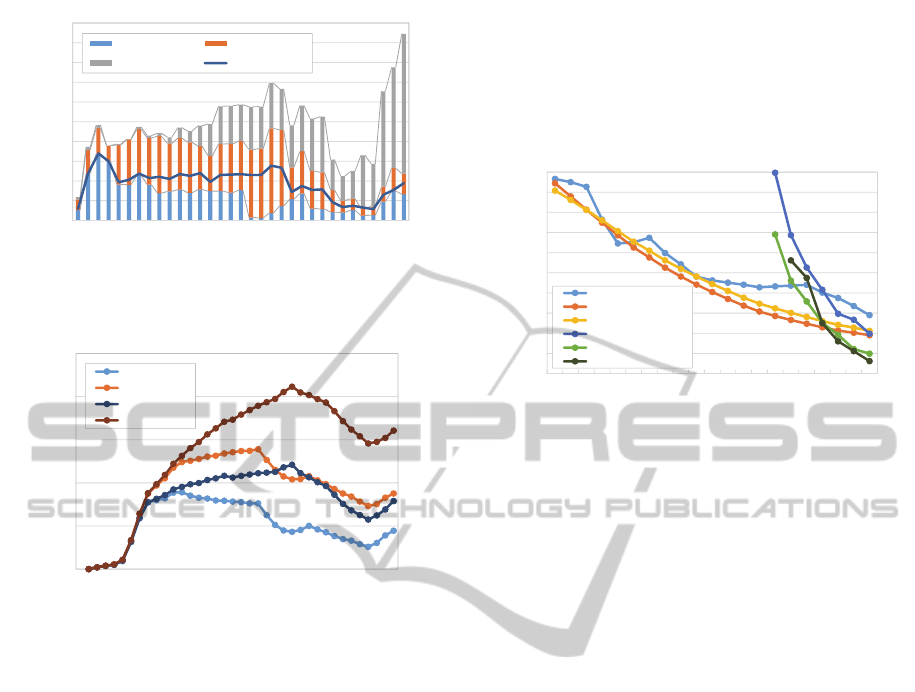
Figure 4 shows the governmental budget for PV
R&D in Japan. In the figure, budgets are categorized
into three types of solar cells, crystalline silicon, thin
film silicon, and others, PV systems including
balance of system (BOS), and other PV related ones.
From 1974 to 2000, PV R&D was promoted under
the Sunshine Program (from 1993, the New-
Sunshine Program) of the Ministry of International
Trade and Industry (MITI). From 2001, PV R&D
was conducted as a part of NEDO’s technology
development program (from 2008, the advanced
solar cell technology development program was
initiated). NEDO does not disclose R&D
expenditures by themes. For the analysis, therefore,
R&D expenditures from 2001 were estimated based
on the budget for individual projects and the number
of themes or sub-themes in the project.
Regarding R&D expenditures on crystalline silicon
solar cells, it was reduced drastically in 1997. It
came back to previous levels soon, but it has been
kept at a low level after that.
0
1000
2000
3000
4000
5000
6000
7000
8000
9000
10000
11000
1980 1984 1988 1992 1996 2000 2004 2008 2012
R&D expenditures (million JPY)
(Year)
crystalline Si thin film Si other cells system other PV
Figure 4: R&D expenditures for photovoltaics by the
Japanese government by technologies.
2.3 Technology Knowledge Stock
Based on Watanabe, 2000, let us define technology
knowledge stock by equation (1).
TS
t
= TS
t
-1
* (1 - ro) + RE
t
-
m
/ rd
t
-
m
(1)
where
TS
t
: technology knowledge stock of R&D in year t
(million JPY)
m: lead-time from R&D to commercialization
(year), m=5 is used based on NEDO’s PV
technology development (Ogawa, 2001)
ro: rate of obsolescence (%), ro=20% (Watanabe,
2000) and 10% (MRI, 1991) are used for PV R&D
RE
t
: R&D expenditures in year t (million JPY)
rd
t
: R&D deflator in year t (MEXT, 2013)
R&D expenditures become obsolete and contribute
lesser to technological progress over time.
Technology knowledge stock is the cumulative
R&D expenditure, after considering the
obsolescence of technologies. Obsolescence is
defined not by period, but by the rate of
obsolescence. ro=20%, 10% mean technologies
become obsolete in 5 and 10 years, respectively. If
the rate of obsolescence can be omitted (ro=0), then
technology knowledge stock is the same as
cumulative R&D expenditure.
0
2000
4000
6000
8000
10000
12000
14000
16000
18000
20000
22000
1980 1984 1988 1992 1996 2000 2004 2008 2012 2016
Tecknology knowledge stock
(million JPY)
(Year)
m=5y,ro=20%
m=5y,ro=10%
Figure 5: Technology knowledge stocks for crystalline
silicon solar cells, through PV R&D by the Japanese
government.
Figure 5 shows the technology knowledge stocks for
crystalline silicon solar cells, through PV R&D, of
the Japanese government in m=5 years, ro=20% and
10%, based on equation (1). R&D expenditures for
crystalline silicon solar cells from 1988-1996
maintain technology knowledge stock until 2001 in
the case ro=10%. However, the allocated R&D
expenditure is not enough to keep technology
knowledge stock constant in the case of ro=20%.
After the drastic budget reduction in 1997,
technology knowledge stock could not be
maintained in both the cases.
InfluenceofResourceAllocationinthePhotovoltaicR&DofJapanbasedonTechnologyStockModeling
711
2.4 Technological Progress Model of
Solar Cells
If R&D expenditure is constant, technology
knowledge stock will saturate at RE/ro, as shown in
Figure 6. However, even if R&D expenditure is
constant, technological progress is induced by the
expenditure. This means that there is no correlation
between technology knowledge stock of PV R&D
and the price of the solar cells, but there exists a
correlation between technology knowledge stock of
PV R&D and solar cell price reduction. In this study,
correlation between cumulative technology
knowledge stock and solar cell price is modeled for
stable parameter estimation (a and b in equation (2)).
Figure 7 shows the correlation between cumulative
technology knowledge stock for crystalline silicon
solar cells (given in Figure 5) and module price,
excluding the effects of mass production in Japan
(annual and cumulative production for 2012 is
assumed during the entire period).
Prior models indicate that the module price of solar
cells converge with the material price. However, the
silicon necessary for solar cells (g/W) and the silicon
price (JPY/g) are both changing. In this paper, for
convenience, the exponential curve in equation (2) is
used for modeling technological progress of solar
cell price.
y = exp (a * x + b) (2)
where
x: cumulative technology knowledge stock (million
JPY)
y: solar cell price (JPY/W)
a, b: parameters, a<0
Using equation (2) means continuity and additivity
are assumed for R&D. By applying the regression
analysis in equation (3),
log
e
(y) = a * x + b (3)
a and b are estimated as -6.61 E-6 and 7.02,
respectively, with the coefficient of determination
(R
2
) being 0.922 when ro=20%, and -3.30 E-6 and
6.82 with coefficient of determination at 0.910 when
ro=10%.
The estimated regression line and technological
progress model, when ro=20%, are shown in Figures
8 and 9, respectively. The projected module price of
50 JPY/W is the present target of PV R&D for
crystalline silicon solar cells in Japan.
0
1
2
3
4
5
6
7
8
9
10
1 6 11 16 21 26 31 36 41 46 51
Technology knowledge stock
(Year)
ro=10%
ro=20%
Figure 6: Relationship between constant R&D expenditure
(=1) and technology knowledge stock.
0
100
200
300
400
500
600
700
800
0 50000 100000 150000 200000 250000 300000
Module price (JPY/W)
Technology knowledge stock (million JPY)
ro=20%
ro=10%
Figure 7: Correlation between cumulative technology
knowledge stock for crystalline silicon solar cells and
solar cell price, excluding mass production effects.
0
1
2
3
4
5
6
7
0 40000 80000 120000 160000 200000
ln(module price (JPY/W))
Cumulative technology knowledge stock (million JPY)
regression line
data
Figure 8: Correlation between cumulative technology
knowledge stock for crystalline silicon solar cells and
solar cell price excluding mass production effects, in
logarithm, and its regression line, with ro=20%.
SIMULTECH2014-4thInternationalConferenceonSimulationandModelingMethodologies,Technologiesand
Applications
712
0
100
200
300
400
500
600
700
800
0 100000 200000 300000 400000 500000
Module price (JPY/W)
Cumulative technology knowledge stock (million JPY)
regression line
data
Figure 9: Correlation between cumulative technology
knowledge stock for crystalline silicon solar cells and
solar cell price, excluding mass production effects and the
technological progress model, with ro=20%.
3 ESTIMATION OF SOLAR CELL
PRICE RATIO
In some countries, reliable average module prices of
solar cells over a long period are not available. In
this paper, solar cell price is estimated based on the
market share of the world’s solar cell production,
which is more reliable, as shown in Figure 1. For the
estimation, market share of the world's solar cell
production is assumed to be proportional to the
inverse square of the solar cell price ratio, as shown
in equation (4). This relationship is also used for
estimating market share based on price ratios of
solar cells in Japan and other countries. Equation (4)
means that the same market share estimates the
same solar cell price (price ratio=1). Larger market
share estimates lower price, while smaller market
share estimates raise the price. However, small
differences in prices are enlarged in the estimation
of market share. If solar cell price data are available,
estimated prices are compared and discussed with
respect to the data.
n
MS
i
= (1 / PR
i
)
2
/ Σ (1 / PR
i
)
2
i=1
(4)
where
MS
i
: market share of i, i=1,…,n
PR
i
: price ratio of i.
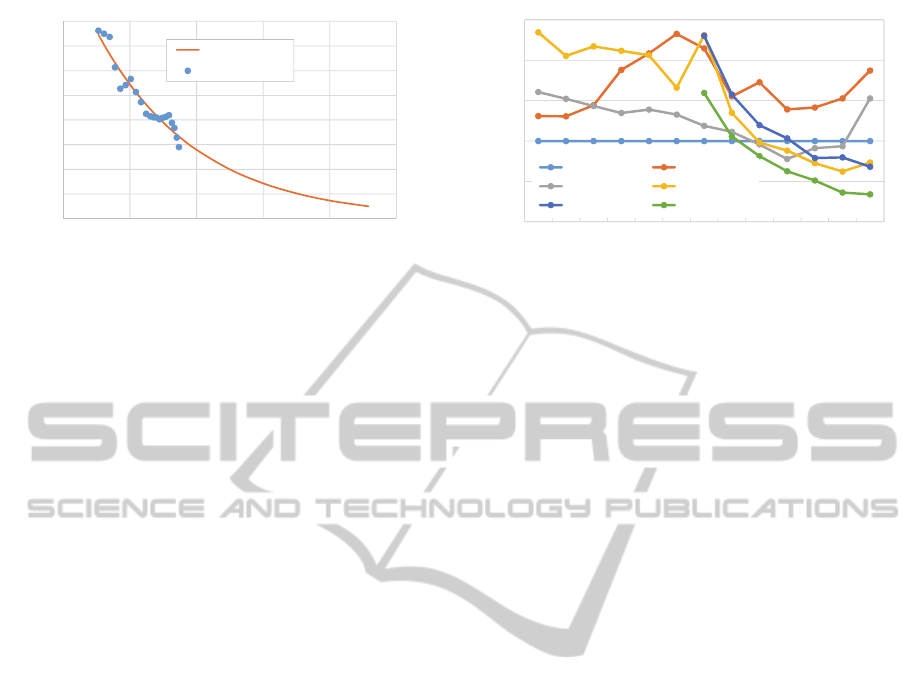
Figure 10 shows the estimated solar cell price ratios,
as compared to Japan, by country, based on equation
(4).
0
0.5
1
1.5
2
2.5
2000 2002 2004 2006 2008 2010 2012
Price ratio (Japan=1)
(Year)
Japan USA
Europe/Germany ROW
Taiwan China
Figure 10: Estimated solar cell price ratios by country,
with Japan=1.
4 INFLUENCE OF RESOURCE
ALLOCATION OF PV R&D
4.1 Influence on Solar Cell Price
Comparing Figures 3 and 4, shares of solar cells by
technology type are completely different in
production and R&D, even when considering a 5-
year lead-time. It seems market projection after the
lead-time is not reflected in R&D resource
allocation. In this study, a case where crystalline
silicon solar cells are allocated, adequate R&D
expenditures are assumed. 50%, 40%, 30%, and
20% of R&D expenditure for solar cells is allocated
to crystalline silicon solar cells during the Sunshine
Program (1974-1992), New-Sunshine Program
(1993-2000), and NEDO’s technology development
program (2001-2007, and 2008-2012), respectively.
These figures are assumed considering gradual
increase in priority of new solar cell technologies.
R&D expenditures for crystalline silicon solar cells
and technology knowledge stock under the
assumption are shown in Figures 11 and 12,
respectively. Actual and assumed R&D expenditures
for crystalline silicon solar cells are different,
especially in 1997-2000, when major budget cuts
were made. In this assumption, technology
knowledge stock is maintained and increases until
2005 at ro=20% and 10%, respectively. However, it
decreases after 2005 in both the cases. Cumulative
technology knowledge stock in 2012 goes from 183
billion JPY to 268 billion JPY when ro=20% and
316 billion JPY to 445 billion JPY when ro=10%.
InfluenceofResourceAllocationinthePhotovoltaicR&DofJapanbasedonTechnologyStockModeling
713
0
1000
2000
3000
4000
5000
6000
7000
8000
9000
10000
1980 1984 1988 1992 1996 2000 2004 2008 2012
R&D expenditures (million JPY)
(Year)
crystalline Si thin film Si
other cells cSi, assumption
Figure 11: R&D expenditures for solar cells with
assumptions about crystalline silicon solar cells.
0
5000
10000
15000
20000
25000
1980 1984 1988 1992 1996 2000 2004 2008 2012 2016
Tecknology knowledge stock
(million JPY)
(Year)
data,ro=20%
data,ro=10%
est.,ro=20%
est.,ro=10%
Figure 12: Technology knowledge stocks for the assumed
R&D resource allocations.
Increase of cumulative technology knowledge stock
accelerates solar cell price reduction. It gives 191
JPY/W and 212 JPY/W in 2012 when ro=20% and
10%, respectively, as shown in Figure 13. This price
is not reflected in the secondary effects of price
reduction through R&D.
The estimated solar cell price shows that the
assumed resource allocation in R&D for crystalline
silicon solar cells gives around a 30% price
reduction in solar cells in 2012. However, the
difference between the actual and estimated module
prices peaks at around 40% in 2008-2010. This is
because actual module price dropped after that due
to the price reduction of silicon and solar cells
because of oversupply. This is, however, not
reflected in the estimated solar cell prices.
Figure 13 compares solar cell prices in Japan, China,
and Taiwan, based on the estimated price ratios in
Figure 10. Estimated solar cell prices of China and
Taiwan come close to that of Japan in 2007 and
2009, respectively. However, under the assumed
R&D resource allocation, the catching-up by China
and Taiwan is delayed by 2 and 3 years,
respectively.
Regarding China, estimated solar cell price based on
its market share is different when compared to the
data (Lv, 2013) in 2007 and 2008, but it shows a
relatively good fit after that, as shown in Figure 13.
0
100
200
300
400
500
600
700
800
900
1000
1992 1996 2000 2004 2008 2012
Module price (JPY/W)
(Year)
Japan, data
Japan,est.,ro=20%
Japan,est.,ro=10%
Taiwan, est.
China, est.
China, data
Figure 13: Solar cell price in Japan, estimated under the
assumed R&D resource allocation, in comparison to China
and Taiwan.
4.2 Influence on Solar Cell Market
Share
Based on the estimated solar cell prices in Japan and
other countries, market share in the world solar cell
production can be estimated by assuming a market
share that is proportional to the inverse square of the
price ratio shown in equation (4). Figure 14 shows
the estimated market share of the world solar cell
production by country, under the assumed R&D
resource allocation, when ro=20%.
In actuality, the market share of Japan is the same as
that of China in 2007 and Taiwan in 2009. Japan
could not maintain its top share and fell behind
China and Taiwan in 2008 and 2010, respectively.
However, under the assumed R&D resource
allocation, the catch up delays to 2009 for China and
2012 for Taiwan. This means that the assumed R&D
resource allocation could not keep Japan’s top share,
but allows Japan to maintain a price advantage and
keep the top share in the market 2 or 3 years longer.
It shows that Japan could have had the highest
market share of 63.5% and 58.2% in 2004 with
ro=20% and 10%, respectively. This is around 10
points larger than the actual market share. Japan
could have maintained a 14.8% and a 12.3% market
share in 2012 with ro=20% and 10%, respectively.
This is around 2 times larger than the actual market
share.
SIMULTECH2014-4thInternationalConferenceonSimulationandModelingMethodologies,Technologiesand
Applications
714
0
10
20
30
40
50
60
70
80
90
100
1980 1984 1988 1992 1996 2000 2004 2008 2012
Solar cell production (%)
(Year)
Japan USA Europe/Germany ROW Taiwan China
Figure 14: Estimated market share in world solar cell
production by country, under the assumed R&D resource
allocation, with ro=20%.
4.3 Secondary Effects of Mass
Production
Annual and cumulative production of crystalline
silicon solar cells in Japan can be calculated using
the world solar cell production, estimated market
share of Japan in the world solar cell production, and
the share of crystalline silicon in the solar cell
production of Japan. The estimated peak of solar cell
production in Japan is 6.10 GW/year in 2010 with
ro=20%. This is 2.24 times higher than the actual
maximum annual production of 2.73 GW/year in
2011, as shown in Figure 15. Similarly, the
cumulative production increases to 1.9 times in
2011. The increase of both annual and cumulative
production causes a price reduction due to increased
production. Solar cell prices reflect secondary
effects and become 188 JPY/W and 211 JPY/W in
2012 with ro=20% and 10%, respectively.
0
1000
2000
3000
4000
5000
6000
7000
1980 1984 1988 1992 1996 2000 2004 2008 2012
Solar cell production (MW/year)
(Year)
data
estimation
Figure 15: Estimated annual solar cell production in Japan,
under the assumed R&D resource allocation, with
ro=20%.
5 DISCUSSION
In this section, among the assumptions and
parameters used in this study, R&D expenditures of
the private sector are discussed.
Figure 16 shows R&D expenditures on solar energy
in Japan during 1977-1997 (Statistic Bureau of
Japan, 1979,…,1999). This figure can be categorized
into R&D expenditures for solar energy in Japan by
government and non-government owned funds, as
shown in Figure 17. The R&D expenditures include
not only those on solar cells, but also on PV systems
including BOS and solar thermal power generation
and utilization. As the survey has since been
terminated, there is no recent data. Both government
and non-government funds have a correlation of
0.762 during the entire period of 1977-1997 and
have a very strong correlation of 0.950 during 1989-
1997. This means that the non-government sector
promotes R&D in solar energy at the same pace as
the government. If both sectors have the same lead-
time, the non-government sector could be omitted in
the modeling of this study.
0
5000
10000
15000
20000
25000
30000
35000
1977 1981 1985 1989 1993 1997
R&D expenditures (million JPY)
(Year)
company
institute
university
Figure 16: R&D expenditures for solar energy in Japan by
companies, institutes, and universities.
0
5000
10000
15000
20000
25000
30000
35000
1977 1981 1985 1989 1993 1997
R&D expenditures (million JPY)
(Year)
government non-government
Figure 17: R&D expenditures for solar energy in Japan by
government and non-government owned funds.
InfluenceofResourceAllocationinthePhotovoltaicR&DofJapanbasedonTechnologyStockModeling
715

6 CONCLUSIONS
In this paper, the price reduction of solar cells in
Japan is modeled, excluding mass production
effects, based on the technology knowledge stock
approach. By using the technological progress model
of solar cells and the relationship between price ratio
and market share, possible influence of resource
allocation in the PV R&D of Japan is analyzed.
Conclusions of this study are as follows.
(1) The estimated influence of resource allocation in
the PV R&D of Japan on module prices of solar
cells and market share in world solar cell production
is not small and should not be ignored.
(2) Japan could achieve a module price of solar cells
of around 200 JPY/W, which is 30% cheaper than
presently available. The price is comparable to solar
cell prices in China and Taiwan,
and (3) though Japan could not keep its top share, it
could have maintained a large share in world solar
cell production for several more years by reducing
solar cell prices, if the assumed R&D resources had
been allocated to crystalline silicon solar cells,
which are very affordable.
The analysis depends on assumptions such as
continuity and additivity in R&D and the relation
between price and market share, which needs more
discussion. Sensitivity analysis for assumed data and
parameters, such as R&D expenditures after 2000
and mass production effects of learning-by-doing,
are necessary.
For further study, we could look at combining the
technological progress model of solar cells, the
world solar cell market model, both shown in this
study, and the dissemination model for residential
PV systems model (Endo, 2014). The study of cost-
effective resource allocation will be simulated for
PV technology development in Japan, in terms of
not only R&D expenditure, but also subsidies by the
government.
REFERENCES
Watanabe, C., Wakabayashi, K., Miyazawa, T., 2000.
Industrial dynamism and the creation of a “virtuous
cycle” between R&D, market growth and price
reduction, the case of photovoltaic power generation
(PV) development in Japan, Technovation 20, 299-
312.
Ogawa, K., 2001. Status and Prospect of PV R&D
Projects by NEDO, Technical Digest of the 12th
International Photovolatic Science and Engineering
Conference, 59-61.
Endo, E., Tamura, Y., 2003. Cost-effectiveness analysis of
R&D on solar cells in Japan, Solar Energy Materials
and Solar Cells, 75, 751-759.
Nemet, G. F., 2006. Beyond the learning curve: factors
influencing cost reductions in photovoltaics, Energy
Policy 34, 3218-3232.
Yamada, K., Komiyama, H., 2012. LCS social scenario,
Chapter 2.3, 24-29.
http://www.jst.go.jp/lcs/en/documents/publishes/
Endo, E., 2014. Analysis of Dissemination of Residential
PV Systems in Japan, Electrical Engineering in Japan,
188, 4, 20-30.
IEA, 2000. Experience curves for energy technology
policy, OECD/IEA.
Oshika, Y., 2013. Japan’s inattention to PV, policy change
was delayed (in Japanese). The Asahi Shimbun.
Maycock, P. D., 1982,…,2006. World PV cell/ module
shipments, PV News, PV Energy Systems.
Yamada, H., Ikki, O., 2013. National Survey Report of PV
Power Applications in Japan -2012.
Lv, F., Xu, H., Wang, S., 2013. National Survey Report of
PV Power Applications in China -2012.
IEA-PVPS, 2013. Trends 2013 in photovoltaic
applications, 1998. Trends in PV applications in
selected IEA countries between 1992 and 1997, Report
IEA-PVPS Task 1.
Statistics Bureau of Japan, 1979,…,1999. Report on the
Survey of Research and Development, Statistics
Bureau of Japan.
Mitsubishi Research Institute (MRI), Inc., 1991. Survey
research on quantitative comparison of Japan and US
(in Japanese). Japan Society for the Promotion of
Machine Industry.
Science and Technology Policy Bureau, Ministry of
Education, Culture, Sports Science and Technology
(MEXT), Japan. 2013. Indicators of Science and
technology.
Japan Photovolatic Energy Association, Shipment
statistics of PV cells and modules.
http://www.jpea.gr.jp/en/statistic/
SIMULTECH2014-4thInternationalConferenceonSimulationandModelingMethodologies,Technologiesand
Applications
716
