
Modeling and Performance Optimization of a Direct Injection Spark
Ignition Engine for the Avoidance of Knocking
Michela Costa, Ugo Sorge, Paolo Sementa and Bianca Maria Vaglieco
Istituto Motori, CNR, Via Marconi, 4, 80125, Naples, Italy
Keywords: CFD Optimization, 3D Engine Model, GDI Spark Ignition Engine, Control, Knocking.
Abstract: The paper applies simulation techniques for the prediction and optimization of the thermo-fluid-dynamic
phenomena characterising the energy conversion process in an internal combustion engine. It presents the
development and validation of a 3D CFD model for a GDI optically accessible engine operating either
under stoichiometric homogeneous charges or under overall lean mixtures. The model validation is realized
on the ground of experimental measurements of the in-cylinder pressure cycle and of the available optical
images. The model comprehends properly developed sub-models for the spray dynamics and the spray-wall
interaction. This last is particularly important due to the nature of the mixture formation mode, being of the
wall-guided type. In the stoichiometric mixture case, the possible occurrence of knocking is also considered
by means of a sub-model able to reproduce the pre-flame chemical activity. The CFD tool is finally
included in a properly formulated optimization problem aimed at minimizing the engine specific fuel
consumption with the avoidance of knocking. The optimization, performed through a non-evolutionary
algorithm, allows determining the best engine control parameters (spark advance and start of injection).
1 INTRODUCTION
Present work has the primary purpose of showing
how a properly developed simulation tool may be of
importance for the prediction of the behaviour of a
complex system as a gasoline direct injection (GDI)
spark ignition engine, hence for the choice of the
optimal control parameters of its actual operation.
The well-established role of computational fluid
dynamics (CFD) as a tool for the analysis of thermo-
fluid-dynamic systems is further confirmed by its
application in the design phase of energy conversion
systems, and, in particular, of internal combustion
engines. Simulation analyses allow running a virtual
prototype of a certain propulsion system and testing
various geometric configurations or control
parameters within time and costs absolutely
negligible if compared with the corresponding
characterization at the test bench. Just the increasing
complexity of modern engines, consequent the large
number of parameters that govern their operation,
and the need to respond to higher and higher
performance targets, may justify the importance of
appropriate calculation tools able to describe the
relevant phenomenology, especially in the phase of
design and prototype development (Carling, 2010).
The use of rigorous methods of decision-making,
such as optimization methods, coupled with modern
tools of numerical simulation, on the other hand, is
today very effective to reduce costs, improve
performance and reliability and shorten the time to
market of technical systems and components. In fact,
numerical procedures may be used to generate a
series of progressively improved solutions to the
optimization problem, starting from an initial one,
until a given convergence criterion is satisfied
(Thévenin, 2008). In this perspective, automatic
searching methods may strongly reduce the time
needed for computational engine optimization
effected through parametric analyses.
The state of the art of computational models and
optimization methods for internal combustion engine
development can be found in the book by Shi, Ge
and Reitz (2011): engine optimization through
parametric analysis is compared with optimizations
realised through non-evolutionary methods or
evolutionary methods. Several examples are
provided.
In the present paper, the development of a
simulation model able to predict both the mixture
formation and the combustion processes occurring
within the combustion chamber of a high
484
Costa M., Sorge U., Sementa P. and Vaglieco B..
Modeling and Performance Optimization of a Direct Injection Spark Ignition Engine for the Avoidance of Knocking.
DOI: 10.5220/0005040204840496
In Proceedings of the 4th International Conference on Simulation and Modeling Methodologies, Technologies and Applications (SIMULTECH-2014),
pages 484-496
ISBN: 978-989-758-038-3
Copyright
c
2014 SCITEPRESS (Science and Technology Publications, Lda.)

performance GDI engine working under a mixed
mode boosting (Alkidas, 2007) is described. The
mixed mode boosting consists in a stoichiometric
charge operation at high load and a lean charge
operation at the lower loads and speeds (Oh and
Bae, 2013, Park et al., 2012). The 3D engine model
validation, indeed, is shown with reference to both
these conditions. The main feature of the engine
under study is the optical accessibility to the
combustion chamber, which allows also collecting
images of the in-cylinder spray evolution and flame
development. In a certain relevant operating
condition, the possibility of occurrence of abnormal
combustions is also analysed, in particular with
reference to the phenomenon of spontaneous
ignition arising in the so-called end-gas zone, not yet
reached by the flame front initiated by the spark
plug. The developed simulation tool is finally
applied to realize the best choice of the engine
governing parameters for the operation with the
lower fuel consumption and the avoidance of
knocking.
The work description follows the steps described
below:
- experimental set-up and campaign;
- development and validation of a 3D model for
sprays issuing from new generation high pressure
GDI injectors;
- formulation and validation of a 3D model for the
simulation of the whole operating cycle of a GDI
engine;
- validation of a sub-model for the prediction of
the knocking occurrence.
- reduction of the specific fuel consumption and
avoidance of knocking under a stioichiometric
charge operation.
2 EXPERIMENTAL APPARATUS
The experimental apparatus employed for the
collection of data to be used for the validation of the
3D engine model includes the following modules:
the spark ignition engine, an electrical
dynamometer, the fuel injection line, the data
acquisition and control units, the emission
measurement system and the optical apparatus.
A GDI, inline 4-cylinder, 4-stroke, displacement
of 1750 cm
3
, turbocharged, high performance engine
is the object of the present study. The engine is
equipped either with a Bosch 7-hole injector located
between the intake valves and oriented at 70° with
respect to the cylinder axis, or with a Magneti
Marelli 6-hole injector, mounted in the same way.
Mixture formation is realized in the wall guided
mode, being the piston head properly shaped to
direct the spray and vapour cloud towards the top of
the cylinder and the spark plug. The engine is
equipped with a variable valve timing (VVT) system
in order to optimize the intake and exhaust valves
lift under each specific regime of operation. The
engine is not equipped with after-treatment devices.
Details are reported in Table 1.
Table 1: Characteristics of the engine under study.
Unitary displacement [cm
3
] 435.5
Bore [mm] 83
Stroke [mm] 80.5
Air supply Exhaust gas
turbocharger
Max. boost pressure [bar] 2.5
Valve timing Int. and Exh. VVT
Compression ratio 9.5:1
Max. power [kW] 147.1 @ 5000 rpm
Max. torque [Nm] 320.4 @ 1400 rpm
An electrical dynamometer allows the operation
under both motoring and firing conditions, hence
detecting the in-cylinder pressure data and exploring
the engine behaviour under stationary and simple
dynamic conditions.
An optical shaft encoder is used to transmit the
crank shaft position to the electronic control unit.
The information is in digital pulses, the encoder has
two outputs, the first is the top dead centre (TDC)
index signal with a resolution of 1 pulse/revolution,
and the second is the crank angle degree marker
(CDM) 1pulse/0.2degree. Since the engine is 4-
stroke, the encoder gives as output two TDC signals
per engine cycle. In order to determine the right
crank shaft position, one pulse is suppressed via the
dedicated software.
A quartz pressure transducer is installed into the
spark plug to measure the in-cylinder pressure with a
sensitivity of 19 pC/bar and a natural frequency of
130 kHz. Thanks to its characteristics, a good
resolution at high engine speed is obtained. The in-
cylinder pressure, the rate of heat release and the
related parameters are evaluated on an individual
cycle basis and/or averaged over 300 cycles.
The tests presented in this paper are carried out
at the engine speed of 1500 rpm. The absolute intake
air pressure remains constant at 1300 mbar, the
temperature is 323 K. Two operating conditions are
considered for the 3D model validation, whose
control parameters are summarised in Table 2. The
first, hereafter indicated with the letter L, is
characterized by an overall lean charge; the second
ModelingandPerformanceOptimizationofaDirectInjectionSparkIgnitionEnginefortheAvoidanceofKnocking
485
one has a stoichiometric charge, and is indicated
with letter S. Start of injection (SOI) and start of
spark (SOS) are expressed in crank angles before the
top dead centre (BTDC). The injection pressure is
equal to 6 MPa in the lean case, to 15 MPA in the
stoichiometric case. Commercial gasoline is
delivered through the 7-hole Bosch injector. Intake
valve opening (IVO), intake valve closing (IC),
exhaust valve opening (EVO) and exhaust valve
closing (EVC) are all reported in the table caption
after (A) or before (B) the relevant dead centre
(TDC or bottom dead centre, BDC).
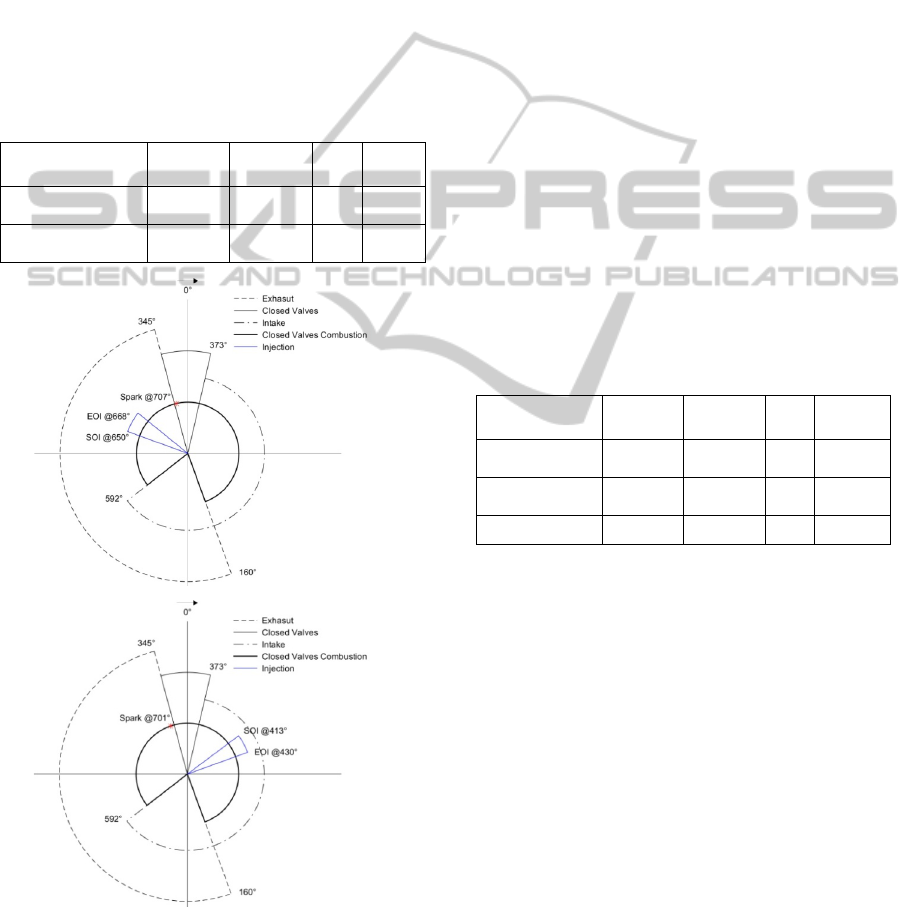
Table 2: Operating conditions considered for the 3D
model validation. IVO@13°ATDC, IVC@52° ABDC,
EVO@20° BBDC, EVC@15° BTDC.
SOI
[°BTDC]
SOS
[°BTDC]
A/F
p
inj
[MPa]
Overall lean charge
(L)
70 13
21.5
6
Stoichiometric
charge (S)
307 19
14.7
15
(a)
(b)
Figure 1: Polar diagrams for the (a) lean burn and (b)
stoichiometric case of validation.
The polar diagrams of Figure 1 summarises the
synchronization of injection, ignition and valve
timing for the cases L and S. The injection occurs
entirely during the intake stroke in the S case,
entirely in the compression stroke in the L case.
Their length is comparable, although the delivered
fuel amount is greater in the S case, due to the
different injection pressure.
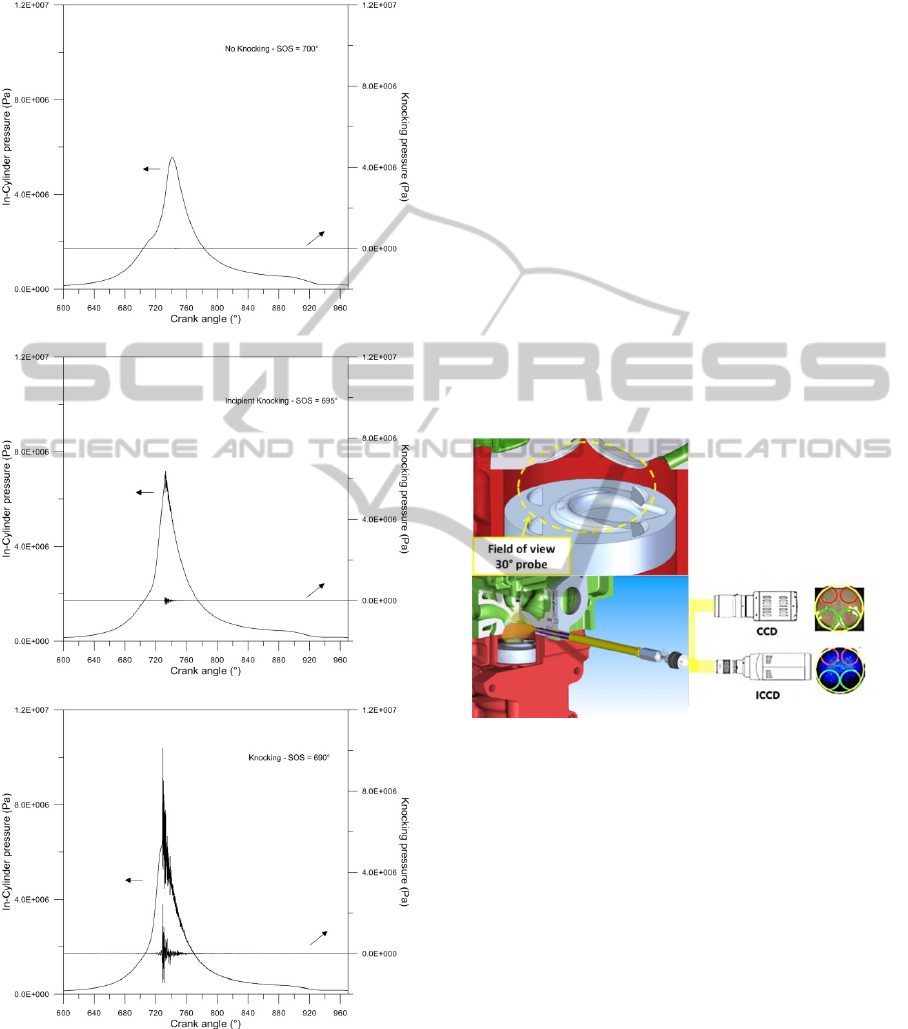
Three different operating conditions are instead
employed with the aim of studying the knocking
occurrence in the engine under study. The 92 RON
fuel is here delivered through the Magneti Marelli 6-
hole injector, with governing parameters as reported
in Table 3. Figure 2 shows the in-cylinder pressure
in the cases of Table 3. In particular, Figure 2a
reports the average over 300 consecutive cycles in a
no-knocking situation, Figure 2b and 2c represents
the instantaneous pressure curves corresponding to
the 150th cycle of 300 consecutive ones in an
incipient knocking case and a knocking case,
respectively. In Figure 2b and 2c the pressure traces
show the typical ripples of knock, whose intensity
increases as the spark advance is increased.
Table 3: Operating conditions considered for study of the
knocking occurrence. IVO@22° BTDC, IVC@17°ABDC,
EVO@5° BBDC, EVC@TDC.
SOI
[°BTDC]
SOS
[°BTDC]
A/F
p
inj
[MPa]
No knocking
case
200 20
14.7
10
Incipient
knocking case
200 25
14.7
10
Knocking case 200 30
14.7
10
2.1 Optical Apparatus
The engine under study is optically accessible.
Imaging measurements are performed by means of
the optical experimental set-up shown in Figure 3.
The optical accesses are realized in the engine head,
as reported in Figure 3.b. A customised protective
case for an endoscopic probe, equipped with an
optical sapphire window (5 mm diameter), is
installed in the engine head in the 4th cylinder. This
system allows investigating an area including the
spark and the gasoline spray through an endoscope
exhibiting a viewing angle of 70°. The field of view
is centred in the combustion chamber
perpendicularly to the plane identified by the axes of
the cylinder and the injector, hence perpendicular to
the plane of tumble motion. The endoscopic probe is
coupled with two high spatial and temporal
resolution CCD cameras. The first is an intensified
SIMULTECH2014-4thInternationalConferenceonSimulationandModelingMethodologies,Technologiesand
Applications
486
cooled CCD camera (ICCD). It is equipped with a
78 mm focal length, f/3.8 UV Nikon objective.
(a)
(b)
(c)
Figure 2: In-cylinder pressure in the (a) no knocking, (b)
incipient knocking and (c) knocking case and 5-30 kHz
band pass filter.
The ICCD has an array size of 512x512 pixels and a
16-bit dynamic range digitization at 100 kHz. The
optical apparatus allows a spatial resolution of
approximately 0.19 mm/pixel. Its spectral range
spreads from UV (180 nm) until visible (700 nm).
The ICCD operates at a digitizer offset of about
230 counts, but the dark noise fluctuation in the
background is much smaller, less than 50 counts.
Dark noise and photon statistical noise are both
small compared with the measured intensity. The
second camera is a digital CCD colour camera
equipped with a 50 mm focal length, f/3.8 Nikon
lens (Figure 3.a). Its spectral range spreads from 400
to 700 nm and it allows performing a 2D flame
visualization. The spatial resolution for this other
optical assessment is of about 0.19 mm/pixel.
The gasoline injection phase is characterized
through the ICCD camera and an intense strobe
lamp, which is introduced in the spark location
through a fiberoptics. For all the optical
measurements, the synchronization between the
cameras and the engine is made by the crank angle
encoder signal through a unit delay.
Figure 3: Sketch of the experimental setup for optical
investigation and detail of the combustion chamber: a)
CCD for 2D two colour technique, b) ICCD for UV-
Visible acquisition.
3 SPRAY SIMULATION
The analysis of the models available in the literature
for the simulation of sprays generated by new
generation GDI injectors, carried out in order to
identify any inadequacies and issues for potential
improvement, has highlighted the need for the
development of a sub-model suitable of being used
in different operating conditions of a modern GDI
engine. In fact, already in the GDI exclusive
operation with homogeneous charges, namely in
what could be called the first generation GDI
engines, a crucial role was played by the interaction
between the spray of injected fuel and the air
ModelingandPerformanceOptimizationofaDirectInjectionSparkIgnitionEnginefortheAvoidanceofKnocking
487

turbulent motion within the combustion chamber.
The complex phenomena of penetration, transport
and evaporation of gasoline had to be carefully
controlled in order to allow the desired
homogeneous preparation of the mixture and the
minimization of anomalies such as the presence of
liquid particles on the walls or any localized
thickening of fuel deposits (Stan, 2000, Zhao, 2001).
In the new generation GDI engines, based on the so-
called mixed mode boosting, the concentration of
fuel vapor in the combustion chamber may be
differentiated at the medium loads in order to create
a zone with air-fuel ratio stoichiometric or slightly
rich in the vicinity of the spark plug, and lean in the
vicinity of the cylinder walls. Globally, the mixture
ratio can be lean (lean burn). At higher loads, and at
all loads and higher speeds, the engine may be
operated in a stoichiometric homogeneous mode.
The control of the formation process of the air-fuel
mixture, therefore, is an objective of great interest,
as detrimental in ensuring flame stability, reduction
of produced pollutants and high combustion
efficiency.
The 3D sub-model able to simulate the dynamics
of the gasoline spray issuing from the considered
injector is here developed in the context of the
software AVL Fire
TM
, in such a way to simulate
preliminary experiments performed by mounting the
injector and delivering sprays in an optically
accessible vessel. The followed approach is the
classical coupling between the Eulerian description
of the gaseous phase and the Lagrangian description
of the liquid phase. The governing equations are
here not reported for the sake of brevity; the
interested reader may refer to the book by Ramos
(Ramos, 1989). The train of droplets inserted in the
computational domain in correspondence of the
injector holes exit section suffers various concurring
effects as it travels. Details of the model are given in
the paper by Costa et al. (2012). Here it is only
worth pointing out that the droplets break-up
phenomenon is simulated according to the sub-
model of Huh-Gosman (1991), whose constant C
1
(regulating the break-up time) is adjusted in a tuning
procedure. The effects of the turbulent dispersion on
the droplets dynamics is simulated through the sub-
model by O’Rouke (O’Rouke and Bracco 1980), the
coalescence through the sub-model by Nordin
(2001), the evaporation through the sub-model by
Dukowicz (1979).
Initial size of droplets at the nozzle exit section,
is considered as variable according to a probabilistic
log-normal distribution, whose expected value is
given by the following theoretical diameter, where
f
is the gasoline surface tension,
g
the surrounding
gas density, u
rel
the relative velocity between the fuel
and the gas, C
d
a constant of the order of the unity
(indeed taken equal to the unity), and the parameter
* deriving from the hydrodynamic stability
analysis and indicating the dimensionless
wavelength of the more unstable perturbation to the
liquid-gas interface at the injector exit section:
*
2
2
relg
f
dth
u
CD
(1)
The variance of the distribution, , is another sub-
model parameter to be properly tuned.
The model tuning is effected through an
automatic procedure developed by authors, that
solves a single objective optimization problem. In
other words, instead of resorting to a search of the
values of the constants by trial and error, i.e. for
successive approximations, an optimization problem
is set-up, where the Nelder - Mead Simplex
algorithm (Nelder and Mead, 1965) is used to reduce
the error between the results of the numerical
computations and the experimental measurements
relevant to the penetration length. The automatic
procedure allows obtaining a model of high
"portability", i.e. such to be applied as it is to
different operating conditions, or even to sprays
generated by different injectors.
The tuning procedure is hereafter described.
Experimental tests are reproduced by simulating the
spray dynamics within a domain reproducing in size
and shape the used confined vessel. At each
injection pressure, the log-normal distribution of the
initial droplet size at the injector exit section is built
starting from the value of chosen in the design of
experiments (DOE) space and the value of the
expected value computed according to eq. (1). The
distribution profile is transferred to the Fire
TM
spray
sub-model, that also receives the value of C
1
from
the DOE space. The model performs the spray
computation in the interval of time needed to inject a
given mass of gasoline (according to the
experimental measurements), and furnishes, as an
output, the penetration length of the jets
compounding the spray. The error between the
numerically computed penetration length, as
averaged over the six (or seven) jets, and the
experimentally measured one is minimized by the
Simplex algorithm. The objective function is defined
as :
n
i
inumiex
C
tltlObj
1
2
,
1
, (2)
SIMULTECH2014-4thInternationalConferenceonSimulationandModelingMethodologies,Technologiesand
Applications
488
where n represents the number of discrete
instants of time in which the injection interval of
time is subdivided, t
i
is the i
th
instant of time, and
l
ex
(t
i
) and l
num
(t
i
) the values, respectively, of the
experimentally measured and the numerically
computed penetration length at t
i
. The
experimentally measured penetration length, indeed,
is evaluated by means of a smoothing spline passing
through the actual measurements points in the time-
length plane.
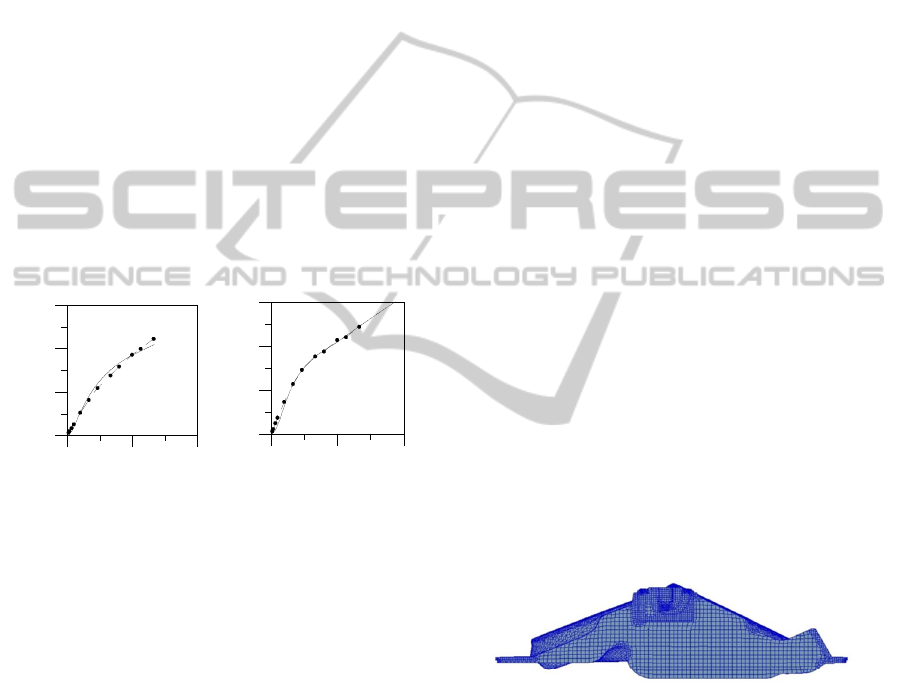
Some results of the developed spray sub-model,
in its application to the 7-hole Bosch injector, are
summarised in Figure 4, where the comparison
between the experimentally measured penetration
length (of one of the seven jets compounding the
spray) and the numerically computed one (as
averaged over the seven jets) is reported for two
different injection pressures.
The prediction capability of the sub-model is
demonstrated by the really satisfactory agreement
between numerical and experimental data under all
the injection pressures.
01.53
Time (ms)
0
0.04
0.08
0.12
Penetration length (m)
p
inj
= 6 MPa
01.53
Time (ms)
0
0.04
0.08
0.12
p
inj
= 15 MPa
Figure 4: Numerical (continuous line) and experimental
(dashed line with dots) penetration lengths of the GDI
spray in a confined vessel at various injection pressures.
Moreover, the developed model also proves being
satisfactory in its application to the Magneti Marelli
6-hole injector, as demonstrated in the paper by
Costa et al. (2014).
As previously mentioned, in the considered
engine, mixture formation occurs in a wall guided
mode, with the spray directed towards a properly
shaped cavity on the piston head, which makes for
the spray droplets and vapour cloud to move in the
proximity of the spark plug. The spray wall
impingement, therefore, plays a fundamental role.
This is the reason why particular care is devoted to
account for the phenomena consequent the impact,
namely the droplets fragmentation, sticking, rebound
and evaporation as a consequence of the heat
transferred from the hot piston wall to the droplets,
which contributes to the latent heat of vaporization.
The sub-model proposed by Kuhnke (2004) is
preferred to the one by Mundo et al. (1995).
4 3D ENGINE MODEL
The formulation of the 3D engine model is carried
out within the AVL Fire
TM
environment, although
the choice of the software is not binding. As
previously mentioned, the simulation model of the
working cycle of the GDI engine object of study is
based on the coupling between the balance equations
of mass, momentum and energy for the gaseous
phase, written according to the Eulerian approach,
and the Lagrangian treatment of the liquid phase.
The mass of gasoline that at each crank angle
undergoes the phase change from liquid to vapor, in
each computational cell, constitutes a source term
for the mass balance equation of the gas phase. The
whole 4-stroke cycle is simulated. Boundary
conditions for the 3D model are obtained from test
bench data.
The discretization of the computational domain
corresponding to the cylinder and the intake and
exhaust ducts of the considered engine is made
through the pre-processing module Fame Engine
Plus (FEP) of the AVL Fire
TM
code, with part of the
domain discretized “manually” to increase the mesh
regularity and assure stability of computations.
Figure 5 shows a computational grid relevant to
the closed valve period, where one may note the care
devoted in the discretisation of the zone surrounding
the spark plug. The nose in the piston head is also
visible on the bottom left of the figure, in opposite
position to the injector location, that is on the right.
Figure 5: Computational grid at TDC.
The combustion process in the developed engine
model is simulated through the Extended Coherent
Flamelet Model (ECFM) (Colin et al., 2003), NO
formation follows the Zeldovich’s mechanism
(Zeldovich et al., 1947). The ECFM model is
properly tuned to well catch the in-cylinder pressure
curve by acting on the initial flame surface density
and the flame stretch factor. The validation consisted
in a preliminary verification of the results
independency upon the grid size, as well as in the
calculation of the motored cycle. For the sake of
ModelingandPerformanceOptimizationofaDirectInjectionSparkIgnitionEnginefortheAvoidanceofKnocking
489
brevity, further details of the validation procedure of
the 3D model are here not reported.
The interested reader may refer to the paper by
Allocca et al. (2012).
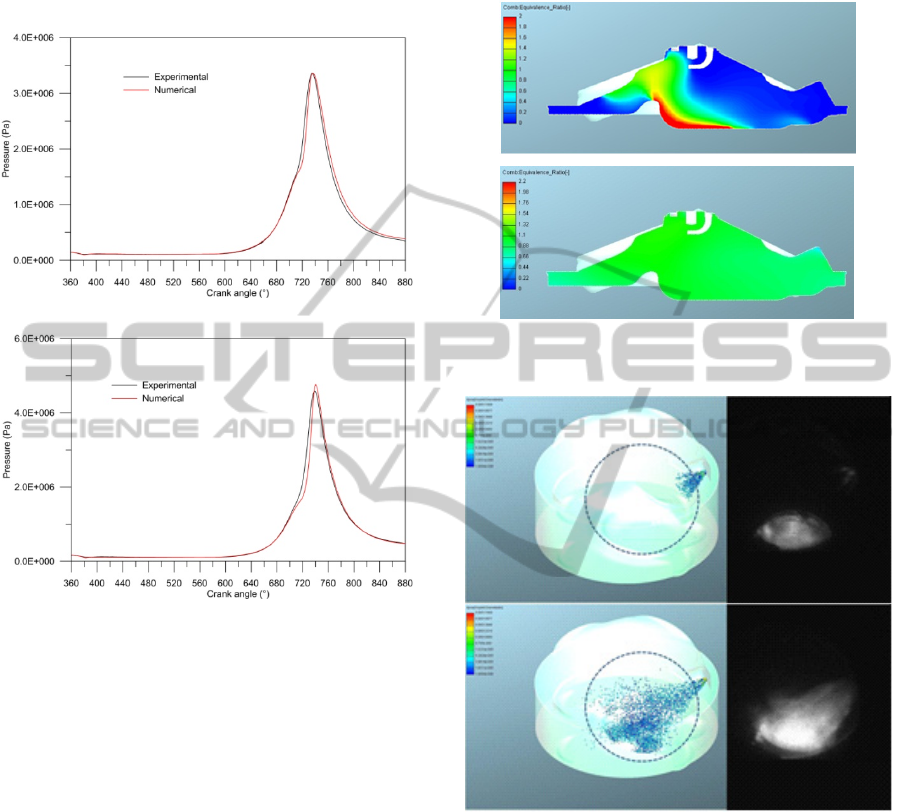
(a)
(b)
Figure 6: Numerical-experimental comparison between
the in-cylinder pressure under (a) lean burn and (b) in the
stoichiometric case.
Figure 6.a shows the comparison between the
measured pressure cycle (averaged over 300
consecutive cycles) and the cycle calculated
numerically in the lean burn case of Table 2. The
injection begins 70° BTDC and has duration of 18°;
SOS takes place 13° BTDC. Figure 6.b represents
the comparison between the calculated and the
measured pressure cycles in the stoichiometric case
of Table 2. In both the situations the numerical-
experimental agreement is really satisfactory.
The different characteristics of the mixture
formation process in the two considered cases L and
S are well highlighted in Figure 7, where the
equivalence ratio distribution of the charge on a
plane passing through the spark plug is drawn at the
time of spark ignition. The mixture inhomogeneity
of the case L is determined by the late injection. In
the stoichiometric case, the early supply of gasoline
leaves enough time to the perfect mixing of vapour
with the surrounding air. The charge stratification of
the L case is not optimal, since a rich zone appears
on the piston head, in correspondence of the nose.
Figure 7: In-chamber equivalence ratio on a plane passing
through the spark plug at SOS: (a) case L; (b) case S.
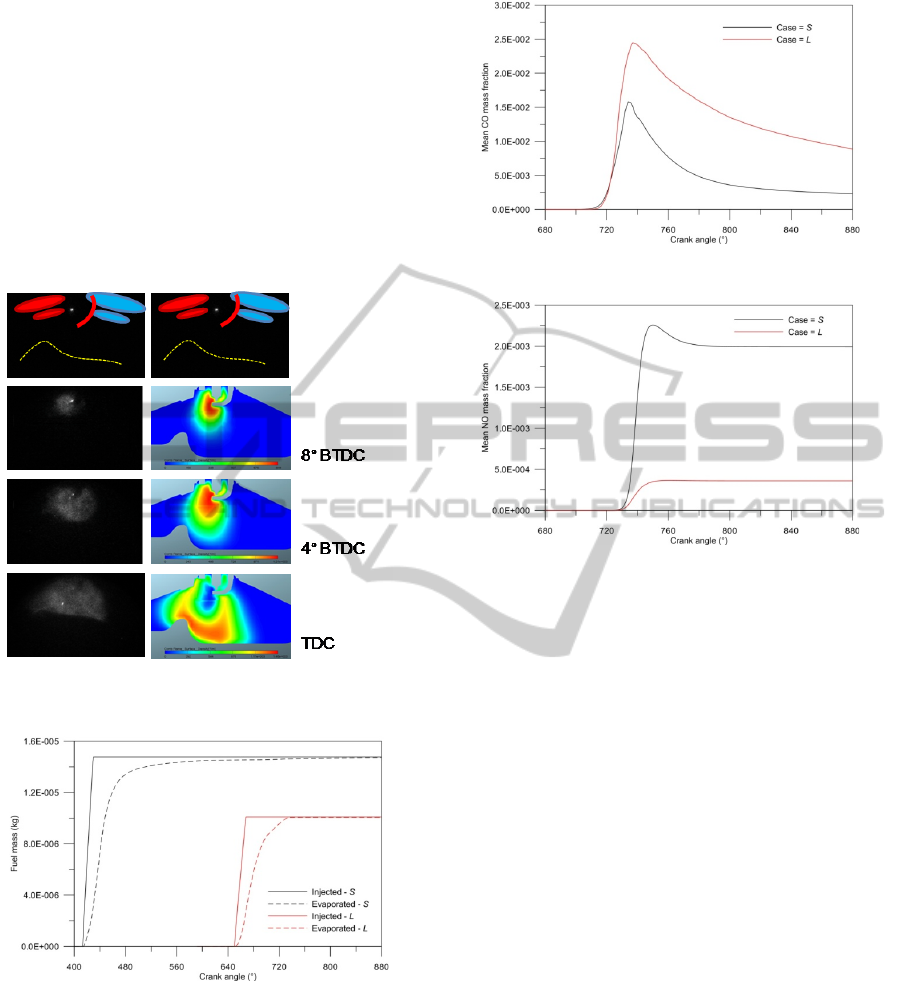
Figure 8: Comparison between numerically computed
(left) and experimentally collected images of the spray
(right) at two crank angles ASOI, for the Case S.
Information concerning the spray evolution within
the combustion chamber can be deduced from
Figure 8, where the numerically computed spray and
the experimentally collected images are represented
for two crank angles after SOI in the S case. The
developed numerical model well reproduces the
droplet dynamics and impingement on the piston
wall, which is moving towards the TDC.
Further confirmation of the good predictive
capability of the numerical model is given by Figure
9, which represents the propagation of the flame
(b)
(a)
6°ASOI
16°ASOI
SIMULTECH2014-4thInternationalConferenceonSimulationandModelingMethodologies,Technologiesand
Applications
490
front in the stoichiometric mixture in the times
immediately following the initiation of combustion,
a comparison made possible due to the optical
accessibility of the engine under study. In particular,
three different angular positions after the ignition are
considered. It must be kept into account that the
experimental image represents the flame as averaged
over the optical path, while the numerical image
represents the flame surface density on a plane
passing through the spark plug. The slight shift of
the flame toward the exhaust valves, on the left side
of the figure, is well reproduced numerically.
Figure 9: Flame front in the stoichiometric case:
experimental (left) and numerical (right) at various times.
Figure 10: Injected and evaporated gasoline mass in cases
L and S.
As an example of the type of results suitable of
being obtained through the developed numerical
model, one may look at Figure 10, where the trends
of the mass of fuel injected and of the mass of fuel
evaporated are reported in the two conditions S and
L. The evaporation in the case L is not complete at
the crank angle of spark advance, and continues
during combustion, being enhanced by the
Figure 11: CO mass fraction in cases L and S.
Figure 12: NO mass fraction in cases L and S.
consequent increase of the in-chamber temperature.
The production of the main pollutants can instead be
discussed with reference to Figure 11 and 12. A
greater production of carbon monoxide is observed
in the case L due to the incomplete combustion
process. Reduced NO amount are evident, due to the
lower combustion temperature. Definitely, the here
considered lean burn case cannot be considered
optimal, but is susceptible of improvement through a
different choice of the injection strategy or spark
advance.
5 KNOCKING PREDICTION
The study of operating conditions for which
abnormal combustions occur is carried out with
reference to the knocking phenomenon, namely to
situations in which a part of the mixture, before
being invested by the flame front ignited by the
spark plug reaches conditions that promote its
spontaneous ignition. The self-ignition of a fuel-air
mixture is the result of a series of pre-flame or low
temperature reactions, which lead to the start of the
combustion process without the intervention of an
external source of ignition, but through the
formation of not stable products of partial oxidation
(peroxides, aldehydes, hydroperoxides, etc.) and the
ModelingandPerformanceOptimizationofaDirectInjectionSparkIgnitionEnginefortheAvoidanceofKnocking
491
release of thermal energy. When the energy of the
exothermal chemical reactions exceeds the amount
of heat transferred from the reagent system to the
external environment, self-ignition takes place. As a
result, the temperature of the mixture increases,
rapidly accelerating the subsequent oxidation
reactions. The speed of the pre-flame reactions, of
chain type between highly reactive compounds, can
be reduced through the introduction in the fuels of
small quantities of additives, which hinder the
formation of radicals acting as chain propagators
(Leppard, 1991, Li et al., 1994).
The simulation of the process of self-ignition of
an air fuel mixture can be performed at different
levels of approximation. A model that has proved
being successful in predicting both spatially and
temporally the occurrence of self-ignition, and that,
at the same time, does not require excessive
computational time, is the so-called Shell model,
developed by Halstead et al. (1977). It comprehends
the start of combustion, with the break-up of the
carbon-hydrogen bond and its development through
the formation of oxygenated products.
The main advantages deriving from the use of a
reduced scheme with respect to what could be a
detailed kinetic scheme, consist precisely in the
identification of groups of radicals or radicals that
lead to the branching of the reaction chains or to
simple propagation of linear type, and in the
possibility to follow the variation in time of the
concentration of these radicals. Other kinetic
mechanisms developed subsequently to the Shell,
have a number of reactions and species involved
much higher, which makes of little interest their use
within numerical simulations on multidimensional
complex domains (Griffiths et al., 1994).
The Shell model is here used in the so-called
end-gas zone, namely in the volume of mixture not
yet reached by the flame front. The combustion
process resulting from the spark ignition is
calculated using a flamelet model, as already pointed
out in the previous paragraph.
Introducing the hydrocarbon RH, namely the fuel
of composition CxHy, the Shell model is constituted
by the following chemical reactions:
primary initialization
*2
2
RORH
pre-flame propagation
PRR **
BRR **
QRR **
BRQR **
branching
*2RB
linear and quadratic termination
NRR *
NRR *2
where the letter P indicates the reaction products
(CO
2
, H
2
O), B and Q, respectively, represent
branching agents and generic intermediate species.
With the term NR are indicated not reacting
compounds created at the end of the pre-flame
reactions.
Into detail, the model contemplates the start of
combustion, with the breaking of the chains of
carbon-hydrogen fuel and the formation of radicals
R*, and its development through the formation of
oxygenated products. As already mentioned, the
species that have a similar role in the pre-flame
kinetics are treated uniquely, as if they were a single
entity.
The numerical 3D model is first adapted to
reproduce the no knocking condition of Figure 2.a,
then the spark advance is increased twice, each of 5°
crank angle, according to Table 3.
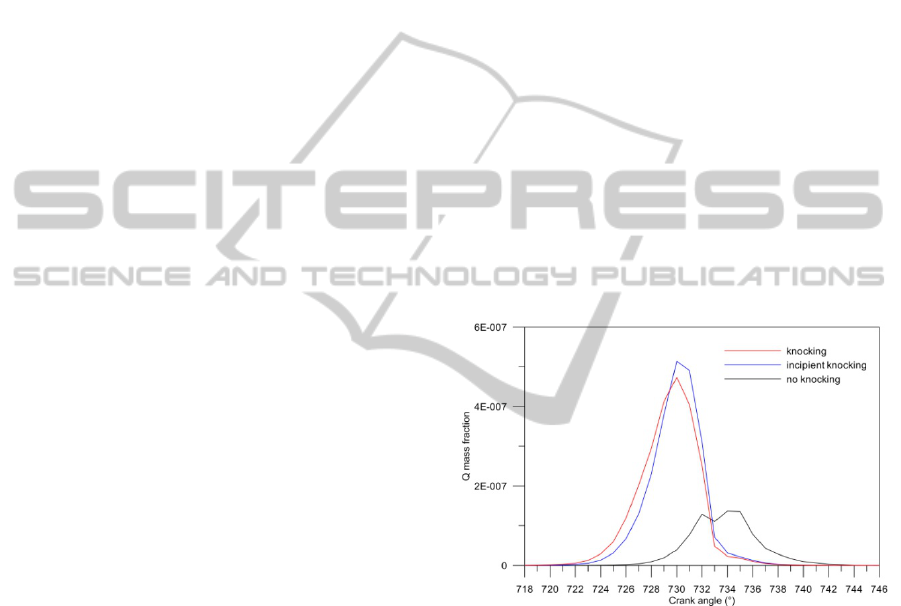
Figure 13: Q formation in the combustion chamber in the
three cases of Table 3.
Figure 13 shows the in-chamber formation of Q for
the three considered cases and well highlights that
with more advanced ignition a more rapid formation
of this group of species occurs. The location of the
maximum value of the Q concentration at the crank
angle of 729° (9° after top dead center, ATDC) is in
excellent agreement with the experimental data of
Figure 2, in particular with the start of oscillations of
the knocking case of Figure 2.c. The Shell model
also allows drawing the distribution of the
intermediate Q in the combustion chamber, that may
help in highlighting the zone where the knocking
occurrence is the most probable. Figure 14
represents, in the three situations of Table 3, the
SIMULTECH2014-4thInternationalConferenceonSimulationandModelingMethodologies,Technologiesand
Applications
492
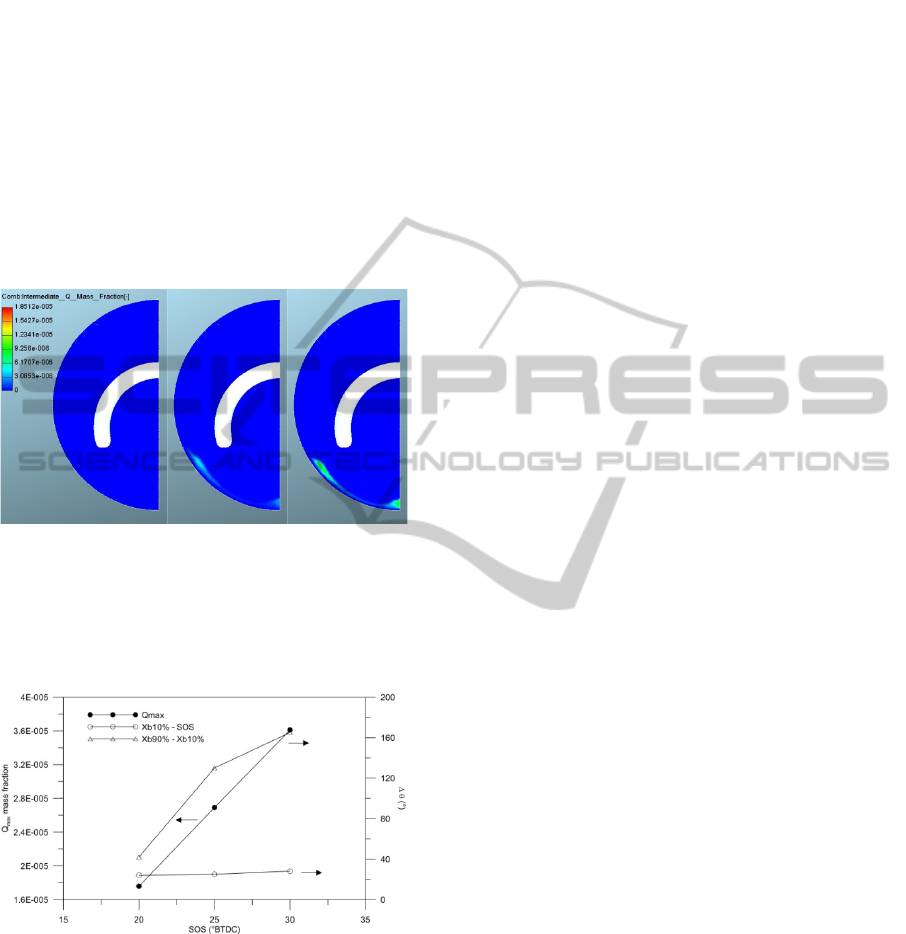
distribution of Q on a plane perpendicular to the
cylinder axis (the one at which the maximum mass
fraction of the species Q is attained) at the crank
angle of knocking occurrence, namely 729°. Due to
the symmetry assumption, only half plane is plotted.
One may note the greater chemical reactivity in the
area of the end-gas located at the bottom of the
figure, on the side where injector is mounted.
The shaped nose on the piston head, in fact,
appears clearly in the figure. The species Q,
therefore, can be used as an index of probability of
knocking occurrence. The Shell model, therefore,
allows both the spatial and temporal localization of
the phenomenon of self-ignition in the end-gas zone.
(a) (b) (c)
Figure 14: Spatial distribution of the intermediate species
of the pre-flame reactions on the plane orthogonal to the
cylinder axis of maximum concentration 9° after TDC for
the (a) no knocking, (b) incipient knocking and (c)
knocking case.
Figure 15: Maximum local value of species Q, flame
initiation angle and flame development angle a function of
SOS.
Finally, Figure 15 represents the maximum local
value of the Q mass fraction as a function of SOS,
together with the angles measuring the interval of
flame initiation and flame propagation. These may
be quantified by the interval of crank angle
comprised between SOS and
10%
and the interval
between
10%
and
90%
, respectively.
10%
is the
crank angle where the 10% of the mixture is burnt,
while
90%
is the crank angle where the 90% of the
mixture is burnt. It is clear that by increasing the
spark advance both the flame initiation and the
flame propagation get slower. The greatest intervals
needed for flame initiation and development at the
highest spark advance, hence the unfavourable
conditions of temperature and pressure at spark
timing, give the mixture enough time to self-ignite in
the end-gas zone.
Based on the afore described calculations and on
the analysis of experimental data, one may define
criteria for knocking occurrence, either based on the
evaluation of the in-cylinder amount of the Q
species, or on the more traditional evaluation of the
pressure gradient in the p- (pressure-crank angle)
plane, where a threshold value can be established
below which the engine operates regularly
(Heywood, 1988). By following this second route,
and in agreement with the experimental data, the
value of dp/d=3.5 was fixed as threshold for the
knocking occurrence.
6 ENGINE OPTIMIZATION
Although GDI engine are characterised by lower in-
cylinder temperatures with respect to port fuel
injection (PFI) engines, knocking occurrence
remains an important issue, especially in
approaching the design of a new engine prototype
and with the aim of defining the control parameters
leading to the best engine performance.
A method is here proposed to explore the DOE
space of the engine control variables, based on the
coupling between the CFD engine model and an
optimization algorithm able to point out the
condition of maximum power output (the objective
function is the maximum integral of pressure in the
pressure-volume plane in the closed valve period)
and simultaneously avoid the occurrence of the
knocking phenomenon. The start of injection (SOI)
and start of spark (SOS) are the input parameters of
the formulated optimization problem, whose flow
chart is represented in Figure 16.
A proper DOE space defines the acceptable
limits of these variables. The engine speed, air-to-
fuel ratio and valve timing are kept constant. The
optimization algorithm, here chosen as the Simplex,
runs the 3D engine model towards the optimal
solution. Computed pressure cycles that do not
satisfy the imposed constraint on the pressure
derivative, defined at the end of paragraph 5, are
discharged from the optimization results. This
ModelingandPerformanceOptimizationofaDirectInjectionSparkIgnitionEnginefortheAvoidanceofKnocking
493
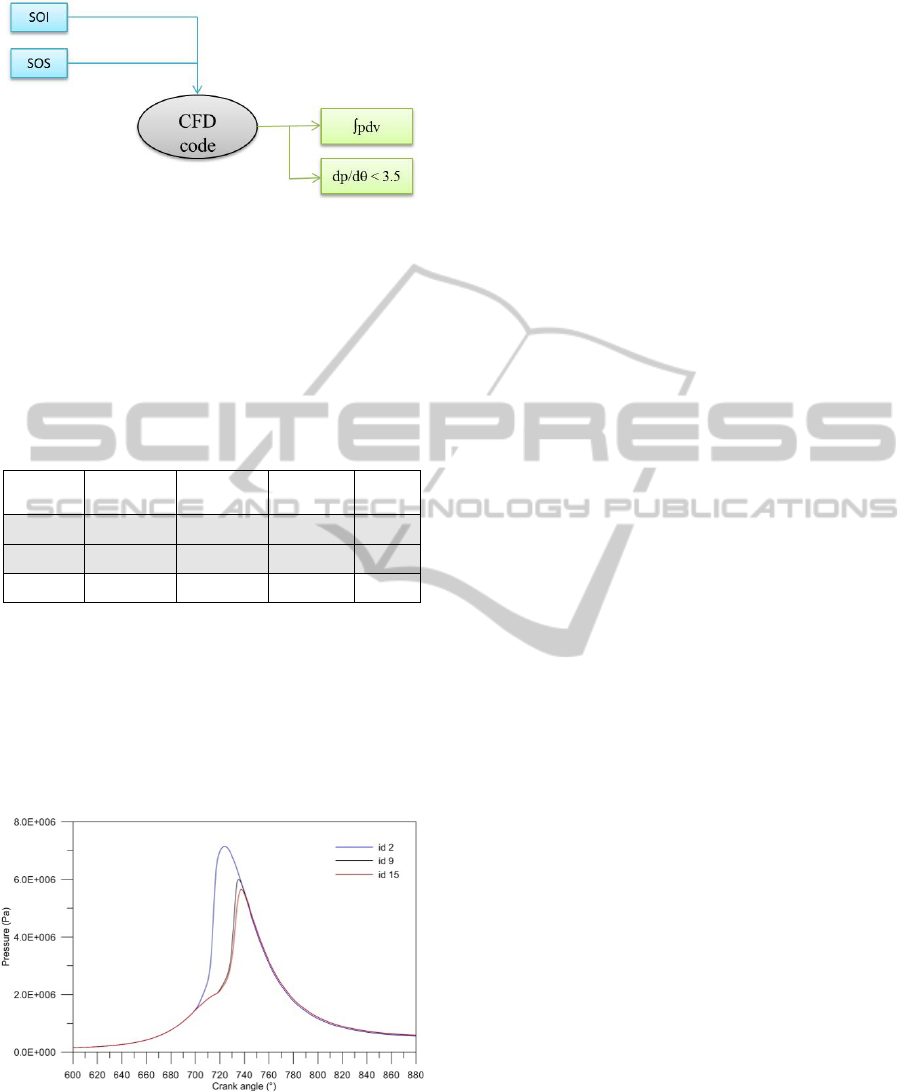
Figure 16: Flow chart of the optimization problem.
approach is preferred to the use of the previously
presented Shell model in the 3D code, in order to
avoid an excessive increase of the computational
time to limits unreasonable for an optimization
process.
Table 4: Cases computed with the optimization tool at
different SOI and SOS imposed and corresponding
dp/d
max
values.
Id
SOI
[°BTDC]
SOS
[°BTDC]
dp/d
max
∫pdv
2 126 40
8.08 272.40
9 122 12
5.38 277.59
15 130 12
3.31 274.44
The obtained results exhibiting the highest value of
the objective function are presented in Table 4 and
in Figure 17.
Table 4 summarises the value of the input
variables SOI and SOS, the objective function and
the maximum value of the pressure derivative in the
p- plane, evaluated in the interval of crank angles
ranging between SOS and 10° ATDC.
Figure 17: Computed in-cylinder pressure cycles for the
three cases of Table 4.
Figure 17 represents the in-cylinder pressure cycles
in the closed valve period, for the IDs of Table 4.
Case indicated with ID=2 is characterised by a really
high pressure gradient, as shown in Figure 17.
Therefore it must be discharged. The other cases
have comparable power output, but also ID=9 must
be not considered due to the adopted constraint on
the knocking occurrence. ID=15 is, therefore, the
optimal solution, with the SOS of ID=9 (knocking
condition), but a SOI occurring 130° BTDC. This
shows a favourable effect of advancing injection on
knocking occurrence.
7 CONCLUSIONS
Mixing control is fundamental in internal
combustion engines. It assures flame stability,
reduction of pollutants, improved combustion
efficiency, reduced size and greater lifetimes of
combustors.
Achievement of optimal charge conditions at all
the engine loads and speeds in modern gasoline GDI
spark ignition engines is undoubtedly a challenging
task, especially if the so-called mixed mode boosting
is to be realized, with homogeneous stoichiometric
or rich mixtures at the higher loads, and stratified
lean mixtures at the lower ones. This is the reason
why fully automatic procedures to be used in the
phase of definition of the engine governing
parameters are strongly demanded.
Present work aims at presenting a 3D numerical
model able to reproduce the in-cylinder processes of
a high performance GDI engine. The model includes
a sub-model for the spray dynamics tuned through
an automatic procedure on the ground of an
experimental campaign conducted in an optically
accessible vessel, as well as a proper spray-wall
impingement sub-model that accounts for the heat
transferred from the wall to the liquid deposits of
fuel.
The considered engine has the head of a
commercial 1750 cm
3
automotive power system, but
is optically accessible due to properly made
modifications to the piston and engine block. This
allows capturing images of both the in-cylinder
mixture formation and combustion processes.
The developed 3D engine model is shown to well
reproduce the in-cylinder thermo-fluidynamics
under both stoichiometric and lean charges. It allows
determining with very good accuracy the whole
pressure cycle over the 4-stroke period, as well as
the flame propagation within the combustion
chamber. This highlights any inadequacy of the
mixture formation process that may cause
incomplete or unstable combustions.
A simplified model for the pre-flame reactions is
also considered in the end-gas zone of the
SIMULTECH2014-4thInternationalConferenceonSimulationandModelingMethodologies,Technologiesand
Applications
494

combustion chamber, not yet reached by the
principal flame front, in order to detect the possible
occurrence of knocking through numerical
simulations.
Under proper operating conditions, computations
show a good agreement with experiments as regards
the knocking onset and its temporal location. The
spatial position being the most probable for
knocking is also highlighted. The chemical reactivity
in the zone not yet reached by the flame front
increases as the spark advance is increased, also as a
consequence of the greatest time needed for flame
initiation consequent the lower in-chamber value of
temperature and pressure at spark timing.
According to the performed analysis, a criterion
is established to individuate the knocking occurrence
from the pressure cycle trend.
The developed model is finally included within
an optimization problem aimed at maximizing the
engine power output by proper choice of the
injection strategy and the time of spark ignition with
the avoidance of knocking.
The described simulation approach may be
employed in the phase of engine design to reduce the
time-to-market of new technologies. If reliable
experimental data available for engines of analogous
configurations for validation are missing, the
proposed approach may even furnish qualitative
information useful for the development of control
strategies.
REFERENCES
Alkidas, A. C., 2007. Combustion advancements in
gasoline engines, Energy Conversion and
Management, Vol. 48, pp. 2751–2761.
Allocca, L., Costa, M., Montanaro, A., Sementa, P., Sorge,
U., Vaglieco, B.M., 2012. Characterization of the
Mixture Formation Process in a GDI Engine Operating
in Stratified Mode, 12th Triennial Int. Conf. on Liquid
Atomization and Spray Systems, Heidelberg.
Carling, R. W., 2010. Predictive Simulation of
Combustion Engine Performance in an Evolving Fuel
Environment, Sandia National Laboratories.
Colin, O., Benkenida, A., Angelberger, C., 2003. 3D
Modeling of Mixing, Ignition and Combustion
Phenomena in Highly Stratified Gasoline Engines, Oil
& Gas Science and Technology – Rev. IFP Energies
Nouvelles, Vol. 58, pp. 47-62.
Costa, M., Sorge, U., Allocca, L., 2012. CFD optimization
for GDI spray model tuning and enhancement of
engine performance, Advances in Engineering
Software, Vol. 49, pp. 43-53.
Costa, M., Marchitto, L., Merola, S.S., Sorge, U., 2014.
Study of mixture formation and early flame
development in a research GDI engine through
numerical simulation and UV-digital imaging, Energy,
doi: 10.1016/j.energy.2014.04.114.
Dukowicz, J.K., 1979. Quasi-steady droplet change in the
presence of convection, informal report Los Alamos
Scientific Laboratory, Los Alamos Report LA7997-
MS.
Griffiths, J.F., Hughes, K.J., Schreiber, M., Poppe, C.,
Dryer, F.L., 1994. A unified approach to the reduced
kinetic modeling of alkane combustion, Combustion
and Flame, Vol. 99 (3-4), pp. 533-540.
Halstead, M.P., Kirsch, L.J., Quinn, C.P., 1977. The auto-
ignition of hydrocarbon fuel at high temperatures and
pressures-fitting of a mathematical model, Combustion
and Flame, Vol. 30, pp. 45-60.
Heywood, J.B., 1988. Internal Combustion Engine
Fundamentals, New York: McGraw-Hill.
Huh, K.Y., Gosman, A.D., 1991. A phenomenological
model of diesel spray atomisation, International
Conference on Multiphase Flows, Tsukuba, Japan.
Kuhnke, D., 2004. “Spray Wall Interaction Modeling by
Dimensionless Data Analysis”, PhD thesis,
Technische Universität Darmstadt.
Leppard, W.R, 1991. The autoignition chemistries of
octane-enhancing ethers and cyclic ethers: A motored
engine study, SAE Paper 912313.
Li, H., Prabhu, S., Miller, D., Cernansky, N., 1994.
Autoignition Chemistry Studies on Primary Reference
Fuels in a Motored Engine, SAE Tech. Paper 942062.
Mundo, C., Sommerfeld, M., Tropea, C., 1995. Droplet-
Wall Collisions: Experimental Studies of the
Deformation and Breakup Process, International
Journal of Multiphase Flows, Vol. 21(2), pp. 151-173.
Nelder, J. A., Mead, R., 1965. A simplex method for
function minimization, Computer Journal, Vol. 7, pp.
308–313.
Nordin, W.H., 2001. Complex Modeling of Diesel Spray
Combustion, Thesis (PhD), Chalmers University of
Technology.
Oh H. C., Bae C. S., 2013. Effects of the injection timing
on spray and combustion characteristics in a spray-
guided DISI engine under lean-stratified operation,
Fuel, Vol. 107, pp. 225–235.
O’Rourke, P.J., Bracco, F.V., 1980. Modeling of Drop
Interactions in Thick Sprays and a Comparison with
Experiments, IMECHE, London.
Park, C. Kim, S., Kim, H. Moriyoshi, Y., 2012. Stratified
lean combustion characteristics of a spray-guided
combustion system in a gasoline direct injection
engine, Energy, Vol. 41, pp. 401-407.
Ramos, J. I., 1989. Internal Combustion Engine
Modelling, CRC Press.
Stan, C., 2000. Direct injection systems for spark-ignition
and compression-ignition engines, SAE Publication.
Shi, Y., Ge, H. W., Reitz, R. D., 2011. Computational
Optimization of Internal Combustion Engines,
Springer-Verlag. London.
Thévenin, D., Janiga, G. (Eds.), 2008. Optimization and
Computational Fluid Dynamics, Springer-Verlag.
Berlin Heidelberg.
ModelingandPerformanceOptimizationofaDirectInjectionSparkIgnitionEnginefortheAvoidanceofKnocking
495

Zeldovich, Y.B., Sadovnikov, P.Y., Frank-Kamenetskii,
D.A., 1947. Oxidation of Nitrogen in Combustion,
Translation by M. Shelef, Academy of Sciences of
USSR, Institute of Chemical Physics, Moscow-
Leningrad.
Zhao, H., Ladommatos, N., 2001. Engine Combustion
Instrumentation and Diagnostics, SAE Int. Inc..
SIMULTECH2014-4thInternationalConferenceonSimulationandModelingMethodologies,Technologiesand
Applications
496
