
Sensor Reduction on EMG-based Hand Gesture Classification
Giovanni Costantini
1
, Gianni Saggio
1
, Lucia Quitadamo
1
, Daniele Casali
1
,
Alberto Leggieri
1
and Emanuele Gruppioni
2
1
Departement of Electronic Engineering, University of Rome “Tor Vergata”, Rome, Italy
2
Centro protesi INAIL, Budrio, Bologna, Italy
Keywords: Neural Networks, EMG, Hand-Gesture, Classification, Feature Selection.
Abstract: This work concerns a system based on EMG sensors, signal conditioning circuitry, classification algorithm
based on Artificial Neural Network, and virtual avatar representation, useful to identify hand movements
within a set of five. This is to potentially make any trans-radial upper-limb amputee able to drive a virtual or
real limb prosthetic hand. When using six EMG sensors, the system is able to recognize with an accuracy of
88.8% the gestures performed by a subject, and replicated by an avatar. Here we focused on differences
resulting with the adoption of a different number of sensors and therefore, by means of a very simple
heuristic method, we compared different subsets of features, excluding the less significant sensors. We
found optimal subsets of one, two, three, four and five sensors, demonstrating a decrease of the performance
of only 0.8% when using five sensors, while with three sensors the accuracy can be as high as 81.7%.
1 INTRODUCTION
The electrical activity of a muscle can be detected by
sensors able to convert electro-myogram (EMG)
signals into electric ones. Surface and intramuscular
EMGs differ from invasiveness and feasibility, and
we deal with the surface one for practical reasons.
In the recent years, different systems were
proposed to use surface EMG (sEMG) signal
acquired on human forearms as input data to control
a real prosthesis (Matrone et al., 2010) or a virtual
device (Li et al., 2010), either for interactive or
clinical/rehabilitative (Scheme and Englehart, 2011)
purposes.
Most of the EMG-controlled device users are
radial upper-limb amputees, i.e. amputation occurred
below elbow. For these people, the replacement of
missing arm functionalities could be a significant
improvement to their quality of life. Moreover
research showed that the visual-sensorial feedback
provided by following the prosthetic or virtual hand
movements can be useful to alleviate the phantom
limb pain (Castellini et al., 2009, Alphonso et al.,
2012), an invalidating condition that affects between
50% and 80% of amputees (Flor H, 2002).
Standard EMG-controlled devices have usually
relied on the detection of weak/strong contractions
of just two forearm muscles to perform very simple
movements (e.g. hand opening and closing) and this
has restricted their usability by amputees (Zlotolow
and Kozin, 2012). To avoid these limitations, pattern
recognition on multiple forearm muscle signals has
been proposed to discriminate hand movements
(Chowdhury et al., 2013). Extracted patterns of
EMG activity, which are different for each hand
movement, allow to increase the amount of usable
information and to realize a more natural, and hence
satisfactory, reproduction of the gestures. A pattern
recognition-based system is tipically structured in
three main steps:
1. EMG signal acquisition and condition by means
of an array of sensors and electronic circuitry;
2. feature extraction, consisting in the calculation
of relevant characteristics from the signals, e.g.
mean, energy, waveform length, etc.
(Phinyomark et al. 2012)
3. feature translation, or classification, to assign
the extracted features to the class (gesture) they
most probably belong to.
Once the gesture attempted by the user of the
system is recognized, it can be mapped towards the
controlled device.
In order to develop a fully reliable system to
classify the intended hand gesture of the amputee, it
seems reasonable to utilize as many EMG sensors as
138
Costantini G., Saggio G., Quitadamo L., Casali D., Leggieri A. and Gruppioni E..
Sensor Reduction on EMG-based Hand Gesture Classification.
DOI: 10.5220/0005040501380143
In Proceedings of the International Conference on Neural Computation Theory and Applications (NCTA-2014), pages 138-143
ISBN: 978-989-758-054-3
Copyright
c
2014 SCITEPRESS (Science and Technology Publications, Lda.)

possible. But this is untrue for several reasons,
among which:
Limited space: the sensors must be arranged
around the stump socket of the forearm, so that
their maximum number is fixed by their physical
dimensions;
Calibration procedure: the EMG sensors need to
be manually and exactly calibrated in analog
voltage gain, which is a time-expensive
procedure, even for a skilled personnel;
Cost: efficient circuitry-integrated EMG sensors
are quite expensive, which means a reduced
number means a significative cost reduction for
the patient;
Comfort: greater pressure assures optimal
contact for signal extraction, but this implies that
a great number of sensors produces higher
discomfort for the patient;
Reliability: unlike what one can think, a greater
number of EMG sensors can produce lower
realibility. This is because it is necessary a
higher number of electric contacts, that are the
first carrier for the sweat to reach the electronic
circuitry, so potentially give raise to electrical
malfunctions.
In this work we use a low density sEMG-based
system for the recognition of hand gestures to be
further replicated via a virtual limb in 3D computer
graphics (avatar), useful in rehabilitation of
amputees. For the aforementioned reasons, here we
intend to find the best trade-off between accuracy
and the optimal number of EMG sensors.
The system was tested with 20 able-bodied
subjects, 10 males and 10 females. A comparison of
classification accuracy obtained by feeding the
classification algorithm with different feature
vectors was performed. The different feature subsets
were chosen in order to determine what sensors can
be excluded without excessive degradation of the
performance.
2 MATERIALS AND METHODS
An experiment was carried out with a dataset
acquired from 20 subjects. The system was trained
off-line. The described validation, compared with
different sets of sensors, was entirely off-line. The
whole cross-validation, including repeated training
and test of the network takes about 20 seconds per
subject on Pentium 4, while the classification of a
single window takes about 100 sec, which means
that it can be done in real-time. The system has also
been tested in real-time, but only using 6 sensors.
2.1 Subjects
Testers were twenty able-bodied subjects, ten males
and ten females, free of known muscular and/or
neurological diseases, with an average age of 32
years. Each subject gave informed consent before
performing experiments. Eighteen subjects were
right-handed and two left-handed. For every subject
we considered both a session with the right hand and
a session with the left hand.
a)
b) c) d)
Figure 1: Positioning of the EMG sensors and bracelet. a)
the six sensors equally spaced in the bracelet; final
bracelet dimensions are 51.3xLx7 mm where L depends
on subject’s forearm diameter b) sensor 1 positioning; c)
sensor 6 positioning; d) bracelet positioning on the
forearm.
2.2 Setup
Six commercial active sEMG sensors (Ottobock
13E200=50, 27x18x9.5 mm) were placed on the
subjects’ forearm using a silicone bracelet, as
depicted in Fig.1 a-d. Sensors were placed equally
spaced in the bracelet (Fig. 1a), so that the first
sensor was placed on the flexor carpi-radialis muscle
(Fig. 1b) and the sixth sensor on the brachio-radialis
muscle (Fig. 1c). The bracelet was placed around the
forearm, 5cm below the elbow (Fig. 1d). This
configuration was chosen to simulate the positioning
of the prosthesis sensors on amputees’ forearms.
Sensors operated in 0÷5V range with a bandwidth of
90-450Hz and a Common-Mode Rejection Ratio
(CMRR) >100dB. Data were collected using a
purpose-built acquisition system (12 bits A/D
converter, 1 kHz sampling frequency) and USB-
transmitted to the PC.
SensorReductiononEMG-basedHandGestureClassification
139

2.3 Experimental Procedure
The subjects were sitting in a comfortable chair in
front of a PC monitor, where the gestures to be
performed were depicted as follow (see Fig. 2):
1) Rest: hand relaxed.
2) Fist: hand with all fingers closed.
3) Pinch: hand with thumb and finger
touching as if picking a small
object.
4) Spread: hand open and stretched.
5) Pointing: hand with all fingers closed with
the index pointing.
We chose the aforementioned five gestures because
they are considered the most meaningful ones in
everyday life (Saggio et al. 2011).
Figure 2: The five hand gestures.
Every gesture was randomly repeated 10 times and
Recorded for 2s. We empirically determined
gestures duration by means of preliminary studies.
As steady-state sEMG signals are more robust than
transient signal for classification purposes
(Englehart et al., 2001, Oskoei and Hu, 2008)
transitions between gestures were not recorded.
The whole recording procedure was performed
twice, once with the dominant hand and once with
the non-dominant hand. Half the subjects, randomly
selected, started the recording session with the
dominant hand and the other half with non-
dominant hand.
2.4 Feature Extraction
After acquisition, raw EMG data were segmented
using the overlapped windowing technique (Oskoei
and Hu, 2008): the windows length was fixed to
256ms, with 64ms of overlap between two
successive windows. This timing was chosen in
order to fulfill the requirements of real-time
applications, such as the control of virtual hands or
real prosthesis. For each sensor and each window,
features were extracted; in particular, by indicating
with x
i
the i
th
time sample in a window and with N
the total length of the window (in samples), the
following time-domain features were used:
Mean (M): it is defined in Eq. 1 and represents
the mean value of the EMG amplitude:
M
1
W
x
i
i1
W
(1)
Root Mean Square (RMS): it is defined in Eq. 2
and represents the mean power of the signal.
RMS
1
W
x
i
2
i1
W
(2)
Willison Amplitude (WA): it is defined in Eq. 3
and represents the number of counts for each
change in the EMG signal amplitude that
exceeds a predefined threshold, set to avoid
background noise-induced counts. It is related
to the level of muscle contraction.
WA
1
W
f (| x
i
i1
W
1
x
i1
|)
f (x)
1, x threshold
0,otherwise
(3)
Slope Sign Change (SSC): it is defined in Eq. 4
and represents the number of times the slope of
the EMG signal changes sign.
SSC
1
W
f [(x
i
i2
W
1
x
i1
) (x
i
x
i1
)]
f (x)
1, x threshold
0,otherwise
(4)
• Simple Square Integral (SSI): it is defined in
Eq. 5 and represents, similarly to Energy in
continuous-time signal, the area under the
curve of the squared signal:
SSI x
i
2
i1
W
(5)
• Variance (V): it is defined in Eq. 6 and
represents a statistical measure of how signal
varies from its average value (Mean, as defined
in Eq. 1) during the observation:
V
1
W 1
(x
i
M)
2
i1
W
(6)
• Waveform Length (WL): it is defined in Eq. 7 and
represents cumulative length of the EMG signal
waveform. WL is a measure of EMG signal
complexity:
WL | x
i1
x
i
|
i1
W
1
(7)
NCTA2014-InternationalConferenceonNeuralComputationTheoryandApplications
140
2.5 Classification
We implemented an Artificial Neural Network
(ANN) with 10 neurons in the hidden layer and
back-propagation training method. The number of
neurons of the hidden layer was empirically
determined in previous tests.
3 SENSOR SELECTION
When using all sensors, a 5-fold cross-validation to
measure the performance of every configuration
gives a mean accuracy among all subjects of 88.8%,
anyway there was a strong difference among
subjects, being the standard deviation 7.2%.
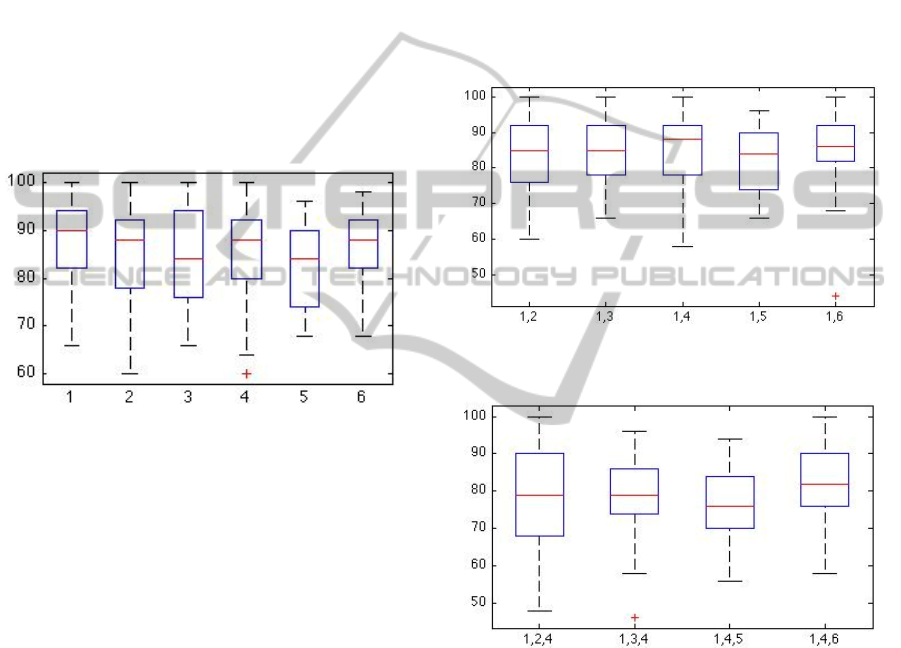
Figure 3: Accuracy (%) of the classifier when excluding
each one of the sensors.
In order to determine what sensors are more
important, we first repeated the whole test, with the
cross-validation, excluding sensor 1, i.e. considering
only the features based on sensors 2, 3, 4, 5, 6. Then
we excluded sensor 2, and cross-validated the
network using the features based on sensors 1, 3, 4,
5, 6. The same was repeated excluding, one at a
time, all the sensors.
We had to judge the configuration that gives the
best results. As we stated above, there is a big
variance among subjects, so the mean value is not
very significant: we should consider more robust
indicators, such as median (50
th
percentile), and
other percentiles. Figure 3 shows a box-plot of the
accuracy: on each box, the central mark is the
median, the edges of the box are the 25th and 75th
percentiles (1
st
and 3
rd
quartiles), the whiskers
extend to the most extreme data points not
considered outliers. Outliers are individually plotted
as crosses.
By examining the graph, it is evident that the
best performance can be achieved by excluding
sensor 1: in fact it has higher median but also higher
1
st
and 3
rd
quartiles, so we can deduce that the best
configuration if we want to use only five sensors is
when using sensors 2, 3, 4, 5, 6.
Next step is trying to use four sensors. In spite of
testing all the possible combinations of four sensors,
we made the test excluding sensor 1 and 2, then 1
and 3, until 1 and 6. This is because we are
exploiting the information acquired on previous
experiment, where we found that sensor 1 is the least
useful one. This is a heuristic method that allows us
to avoid the exploration of configurations that are
less likely to give the optimal solution. Results are in
Figure 4.
Figure 4: Accuracy (%) of the classifier when excluding
each couple of sensors reported on the column.
Figure 5: Accuracy (%) of the classifier when excluding
each triplet of sensors reported on the column.
Although it has a wider range, and for some
subjects it has an accuracy lower than 60%, the third
combination (1, 4) reached what can be considered
globally the best performance, because it has a
higher median and 3
rd
quartile. Hence we can argue
that, if we want to classify with only four sensors,
best choice is more likely 2, 3, 5, 6, even if we
didn’t test all the possible configurations.
We now followed with the same procedure:
excluding sensor 1 and 4 together with every
remaining one. Result is shown in Figure 5.
In this case, the last trial, which is the one where
we excluded sensors 1, 4, 6, gave better results.
SensorReductiononEMG-basedHandGestureClassification
141
Therefore, if we want to use only three sensors the
best choice is to consider the numbers 2, 3, 5. Going
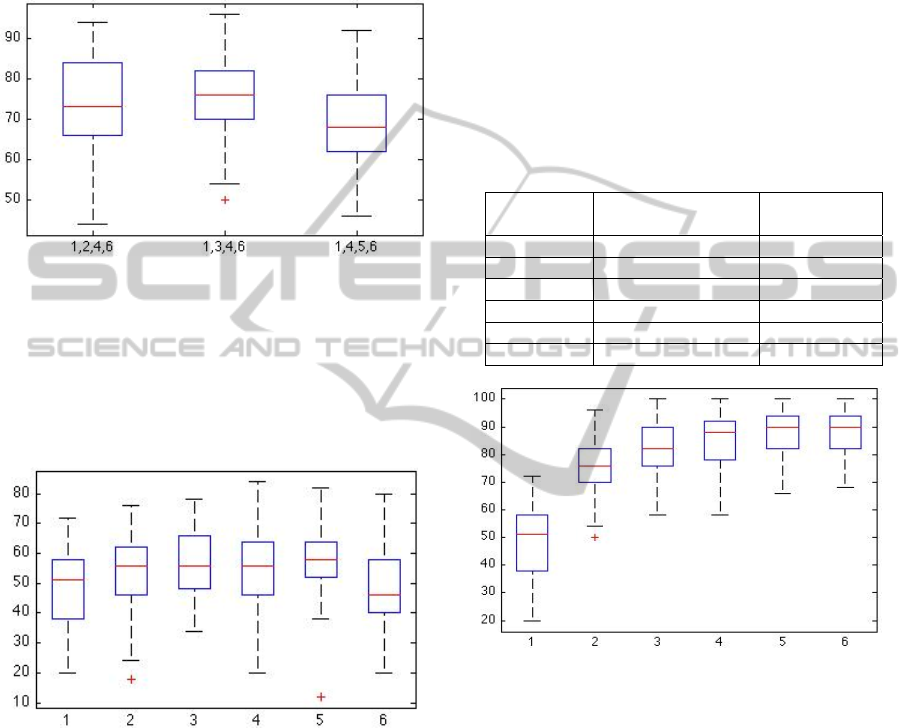
on, we excluded another sensor. Figure 6 shows the
best result achieved by excluding sensors 1, 3, 4, 6.
This means that if we want to use only two sensors
the best choice falls on sensors 2 and 5.
Figure 6: Accuracy (%) of the classifier when excluding
each 4-tuple of sensors reported on the column.
Finally, we considered the best solution when
adopting just a single sensor. In this occurrence, we
didn’t test only sensor 2 and sensor 5, but the entire
set of six, in order to give a validation of our
heuristic method as well.
Figure 7: Accuracy (%) of the classifier when using only
one sensor, reported on the column.
Results are reported in Figure 7, where we can see
that the best sensor, when used alone, is the number
5, which was one of our two candidates as the most
useful sensor. In addition, sensor 2 and 3 perform
relatively well when used alone, while sensor 1, 4,
and 6 are the worst when tested alone, and they
actually were the first ones that we excluded.
4 RESULTS
On Table 1, for every considered number of sensors
we resume the best combination of sensors and the
mean value of the accuracy. Moreover, for the
chosen combinations of sensors, on Figure 8 we
show the box-plot of the accuracy.
Results show that when the number of used
sensors grows, the accuracy increases, but with a
non-linear relationship. With only three sensors (2,
3, 5) it is possible to obtain a quite good level of
accuracy, with a mean value of 81.7%. With five
sensors (2, 3, 4, 5, 6) the accuracy is almost the same
as with all the six sensors, with a difference as little
as 0.8%.
Table 1: Mean accuracy and best combinations for every
considered number of sensors.
Number of
sensors
Sensor combination Accuracy
1 5 48.3 %
2 2, 5 70.0 %
3 2, 3, 5 81.7 %
4 2, 3, 5, 6 84.6 %
5 2, 3, 4, 5, 6 88.0 %
6 1, 2, 3, 4, 5, 6 88.8 %
Figure 8: Box-plot of the accuracy for every considered
number of sensors.
5 CONCLUSIONS
We propose a system composed of a bracelet with
six EMG sensors, a data condition circuitry, a
Neural Network classifier, adopted to recognize
hand’s gesture within a set of five. Our intent was to
investigate the possibility of reduction in the number
of sensors, to determine the optimal trade-off
between their number and the accuracy obtained in
the gesture classification. Mean accuracy resulted
from an unacceptable 48.3% in the case of only one
sensor, up to a useful 88.8% with the adoption of all
six sensors. From this value, the performance
degraded of a negligible 0.8% with five sensors,
NCTA2014-InternationalConferenceonNeuralComputationTheoryandApplications
142

while a significant 7.1% when using only three
sensors.
REFERENCES
Alphonso A.L., Monson B.T., Zeher M.J., Armiger R.S.,
Weeks S.R., Burck J.M., Moran C., Davoodie R.,
Loeb G., Pasquina P.F., Tsao J.W., (2012). Use of a
virtual integrated environment in prosthetic limb
development and phantom limb pain, Stud Health
Technol Inform vol. 181, pp. 305- 309.
Castellini C., Gruppioni E., Davalli A., Sandini G., (2009).
Fine detection of grasp force and posture by amputees
via surface electromyography, J Physiol Paris, vol.
103, no. 3-5, pp. 255-262.
Chowdhury R.H., Reaz M.B., Ali M.A., Bakar A.A.,
Chellappan K., Chang T.G., (2013). Surface
electromyography signal processing and classification
techniques, Sensors (Basel), vol. 13, no. 9, pp. 12431-
12466.
Englehart K., Hudgins B., Parker P.A., (2001). A wavelet-
based continuous classification scheme for
multifunction myoelectric control”, IEEE Trans
Biomed Eng, vol. 48, no. 3, pp. 302-311.
Flor H., (2002). Phantom-limb pain: characteristics,
causes, and treatment”, Lancet Neurol, vol. 1, no. 3,
pp. 182-189.
Li G., Schultz A.E., Kuiken T.A., (2010). Quantifying
pattern recognition- based myoelectric control of
multifunctional transradial prostheses, IEEE Trans
Neural Syst Rehabil Eng, vol. 18, no. 2, pp. 185-192.
Matrone G.C., Cipriani C., Secco E.L., Magenes G.,
Carrozza M.C., (2010) Principal components analysis
based control of a multi-DoF underactuated prosthetic
hand. J Neuroeng Rehabil, vol. 23, pp. 7-16.
Oskoei M.A., Hu H., (2008). Support vector machine-
based classification scheme for myoelectric control
applied to upper limb”, IEEE Trans Biomed Eng, vol.
55, no. 8, pp. 1956-1965.
Phinyomark A., Phukpattaranont P., Limsakul C., (2012).
Feature reduction and selection for EMG signal
classification, Expert Systems with Applications, vol.
39, no. 8, pp. 7420–7431.
Saggio G., Cavallo P., Casali D., Costantini G. (2011).
Complexity Reduction in Control of Human Hand
Prosthesis for a Limited Set of Gestures. Proceedings
of the 4th International Conference on Health
Informatics (HEALTHINF, part of BIOSTEC).
Scheme E. and Englehart K. (2011) Electromyogram
pattern recognition for control of powered upper-limb
prostheses: state of the art and challenges for clinical
use, J Rehabil Res Dev, vol. 48, no. 6, pp. 643-659.
Zlotolow D.A., Kozin S.H., (2012). Advances in upper
extremity prosthetics, Hand Clin, vol. 28, no. 4, pp.
587-593.
SensorReductiononEMG-basedHandGestureClassification
143
