
Using Evolutionary Algorithms to Plan Automatic Minehunting
Operations
Nuno Abreu
1,2
and Aníbal Matos
1,2
1
INESC TEC, Campus da FEUP, Rua Dr. Roberto Frias, 378, 4200-465 Porto, Portugal
2
FEUP - DEEC, Rua Dr. Roberto Frias, s/n, 4200-465 Porto, Portugal
Keywords:
Evolutionary Algorithms, Neural Networks, Mission Planning, AUV, 3D Coverage, Minehunting.
Abstract:
While autonomous underwater vehicles (AUVs) are increasingly being used to perform mine countermeasures
(MCM) operations, the capability of these systems is limited by the efficiency of the planning process. In this
paper we study the problem of multiobjective MCM mission planning with an AUV. In order to overcome
the inherent complexity of the problem, a multi-stage algorithm is proposed and evaluated. Our algorithm
combines an evolutionary algorithm (EA) with a local search procedure based on simulated annealing (SA),
aiming at a more flexible and effective exploration and exploitation of the search space. An artificial neural
network (ANN) model was also integrated in the evolutionary procedure to guide the search. The results show
that the proposed strategy can efficiently identify a higher quality solution set and solve the mission planning
problem.
1 INTRODUCTION
AUVs are able to perform underwater minehunting
missions with higher efficiency, reduced search time
and even with covert search capability when com-
pared to traditional methods. In order to quickly and
safely demine an area, the AUV needs to properly
navigate through that area. Hence, a path needs to be
carefully planned so all the region is sampled. There
is an abundance of path planning algorithms in liter-
ature and, for this specific application, a small subset
known as coverage path planning algorithms is usu-
ally used (Choset, 2001).
Solving a multiobjective path planning problem
is computationally very expensive. EAs have been
successfully used in the past for solving the multiob-
jective path planning problem (Fujimura, 1996; Xiao
et al., 1997). This approach is an alternative to classi-
cal optimization methods with the capability of solv-
ing problems involving a big search space quickly, al-
though not guaranteeing that an optimal solution is
found.
This article consists of four sections and is struc-
tured as follows. Section 2 presents our multiobjec-
tive mission planning problem and section 3 presents
an EA designed to solve it. Section 4 presents and dis-
cusses the obtained results. Finally, in the last section
we give some conclusions and ideas for future work.
2 MISSION PLANNING
The most popular approach used for underwater mine
hunting is performing complete coverage of the oper-
ational area with the robot’s sensors. When acquiring
data with a sonar-equipped vehicle, a lawn-mowing
search pattern (Land and Choset, 1998) with several
parallel tracks is standard if no prior information on
potential target locations is available.
In the underwater domain, coverage path planning re-
search has its most important application in the con-
text of MCM applications. (Stack and Smith, 2003)
presented a 2D coverage algorithm for MCM us-
ing cell decomposition. They investigate a planning
scheme for incomplete coverage, as it may not be fea-
sible in terms of time and energy costs to execute
complete coverage. This scheme divides the search
area into cells and surveys each cell using a conven-
tional line-sweep pattern with a row spacing that is
larger than the sensor footprint, exploring the fact that
mines are normally placed in lines. They assume that
if mines are evenly spaced, then randomly varying the
spacing between each row in the lawn-mowing pat-
tern will decrease the probability of missing an en-
tire mine line. An acceptable probability of detection
(POD) is ensured by establishing bounds on row spac-
ing. A perfect POD is assumed for any mine within
the sensor footprint.
228
Abreu N. and Matos A..
Using Evolutionary Algorithms to Plan Automatic Minehunting Operations.
DOI: 10.5220/0005043102280235
In Proceedings of the 11th International Conference on Informatics in Control, Automation and Robotics (ICINCO-2014), pages 228-235
ISBN: 978-989-758-039-0
Copyright
c
2014 SCITEPRESS (Science and Technology Publications, Lda.)

(Fang and Anstee, 2010) developed an algorithm
for 3D offline mission planning, combining Boustro-
phedon decomposition with the generalized Voronoi
diagram, to cover a well-known planar seabed using
an AUV fitted with side-looking sonar. The vehicle
can navigate over terrain at constant altitude. They
consider both even and uneven lawn-mowing cover-
age patterns but the spacing is fixed, proportional to
range setting. Since they assume a planar seabed, they
do not consider a complex topography and therefore
there was no need to implement variable spacing be-
tween the segments.
(Williams, 2010) presented an 2D offline coverage
algorithm for MCM that optimizes the spacing be-
tween parallel tracks in order to maximize POD, con-
sidering seabed type and range. Their track-spacing
algorithm consists of an exhaustive greedy search
for the best tracks. To further improve these se-
lected tracks a small geographical displacement of
each track is considered. The main disadvantage of
this greedy algorithm is that solutions are only locally
optimal.
2.1 Measures of Mission Performance
In order to assess the effectiveness of a MCM opera-
tion we need to be able to estimate the detection per-
formance that should be achieved in a specific mis-
sion.
2.1.1 Lateral Range
The concept of lateral range curve (LRC) was intro-
duced by (Koopman, 1999). Imagine a searcher fol-
lowing an infinitely long, straight path, searching on
either side of that path. Lateral range refers to the
perpendicular distance an object is to the searcher’s
path. That searcher’s LRC p(x) is the probability of
detecting a stationary object that is at its closest ex-
actly a distance x from the searcher’s path. The LRC
is derived experimentally by moving a sensor through
an area, where objects are randomly placed (the po-
sitions are known), using parallel straight-line search
transects and then testing the detection system.
2.1.2 Probability of Detection
POD is an estimate of how likely it will be for a search
performed in a given area to find an object, assuming
it is there. It is known that an overlap in area cover-
age can improve the detection performance. When it
is assumed that multiple searches are executed inde-
pendently of each other, the combined POD is given
by:
PODcum = 1 −
n
∏
i=1
(1 − POD
i
) (1)
If assuming complete correlation, the combined
POD is simply the higher of the two probabilities.
When there is an indeterminate amount of correlation
an accepted practice (Nash et al., 1982) is to aver-
age the probabilities obtained assuming complete in-
dependence. Given the risk involved in these opera-
tions, it is advisable to obtain conservative estimates
by assuming complete correlation between searches.
2.2 Covering with Different Sensors
The sidescan sonar uses one transducer on each side
to emit acoustic beams down towards the seafloor,
across a wide angle perpendicular to the path of the
sensor through the water, and receives the echos of
those beams. All sidescan sonars suffer from an in-
ability to illuminate targets within the “nadir-gap”
area (section below the transducers).
The multibeam bathymetric sonar uses two or
more perpendicular transducer arrays to transmit and
receive the beams. Each received beam allows the es-
timation of the range (calculated from the time delay)
to the seafloor. By combining data from consecutive
pings (range and angle of the received beam), a 3D
map of the seafloor can be generated.
The most relevant feature to consider in mission
planning is the existence of the nadir gap in sonar
coverage, as illustrated in figure 1. The traditional
approach to compensate for this feature is to partially
overlap pairs of swaths so their nadir gaps are
covered, also known as uneven lawn-mowing.
2.3 Problem Statement
The principal problem under study in this paper is
how to design and implement a more flexible 3D path
planning algorithm that enables an AUV to efficiently
cover the bottom of a submerged area with no missed
areas and with a specified minimum POD. The plan-
ner should identify a set of parallel transects, rep-
resenting sonar swaths, that maximize the estimated
performance of a MCM operation, using the available
knowledge and resources.
2.3.1 Decision Variables
• Mission Path
A mission path is represented by a set of consecutive
straight-line tracks, also referred as swaths (data ac-
UsingEvolutionaryAlgorithmstoPlanAutomaticMinehuntingOperations
229

(a) Coverage with a multibeam sonar. (b) Coverage with a sidescan sonar. (c) Uneven lawn-mowing technique.
Figure 1: Different methodologies used in coverage problems.
quired by the sonar):
P = {s
1
, s
2
, ..., s
n
} (2)
• Vehicle Velocity
The AUV will follow the specified path with a con-
stant forward velocity relative to water equal to v
water
.
2.3.2 Objectives
• Maximize Probability of Detection
The MCM effectiveness is maximized by maximizing
the POD of the target on the survey area:
max
∑
POD
s
(S, P) (3)
• Minimize energy consumption
The amount of energy consumed by the vehicle de-
pends on its velocity, orientation and the actual path.
min E(P, v
water
) (4)
• Minimize time to complete the mission
The time required to execute the mission depends
only on the path and the component of velocity that
is parallel to the track direction.
min T (P, v
earth
) (5)
2.3.3 Constraints
Searching for a path requires the consideration of the
terrain topography, vehicle constraints (battery capac-
ity, maximum velocity and maximum steering angle),
sensor constraints (sonar maximum range and vertical
beam angle) and mission contraints (maximum time
available for the mission and minimum global POD).
3 METHODS
3.1 Multiobjective Problems
In a multiobjective optimization problem, the goal is
to find a set of different solutions representing distinct
trade-offs among the different objectives. These so-
lutions are known as Pareto-optimal solutions (Deb,
2001). This set of solutions can be found using the
Pareto Optimality Theory (Deb, 2001).
The continuous improvement in hardware tech-
nology has allowed the use of algorithms with higher
complexity such as EAs, providing efficient means
for addressing real world problems that traditional al-
gorithms were unable to conquer. These techniques
are based on the principles of natural evolution as
presented by (Darwin, 1859). Pareto dominance-
based techniques remain the most popular selection
scheme adopted by multiobjective evolutionary algo-
rithms (MOEAs), because of the several advantages
that it provides. The SPEA 2 (Zitzler et al., 2001) is
one of the most popular MOEAs used when compar-
ing a newly designed MOEA.
3.2 Proposed EAs for Mission Planning
Our approach is a a posteriori technique, more specif-
ically a Pareto-based approach. The mission planning
algorithm is an off-line planner that should be exe-
cuted before the vehicle is deployed in the target area.
3.2.1 Individual Representation
We consider an individual as a solution represented
by a vector of real valued parameters x ∈ R
n
. Thus, an
individual is represented by:
Ind ∈ (t, θ, d, a, v) (6)
where t is the track spacing, θ is the track direction,
d is the depth of the path (when planning with con-
stant depth), a is the altitude of the path relative to the
seafloor (when planning with constant altitude) and v
is the vehicle velocity.
3.2.2 Informed EA
Our approach combines an EA with an approximation
technique, more specifically ANNs. EAs usually need
ICINCO2014-11thInternationalConferenceonInformaticsinControl,AutomationandRobotics
230

a sufficiently large number of function evaluations to
reach the optima of the problem. The approximate
model is used to reduce the number of expensive ex-
act function evaluations. The main task of the approx-
imate model is to capture the general trend of the fit-
ness landscape and guide the search towards the better
regions while reducing the number of exact function
evaluations needed to find the best solutions. This
guidance is executed by assessing the performance
of multiple candidate individuals using the approxi-
mate models, with a much smaller evaluation time,
and choosing only the best to integrate the next gen-
eration population. One of the challenges that arises is
the need to update the approximate model using new
information from exact function evaluations through-
out the execution of the algorithm, adding finer details
to the fitness landscape.
Initialisation
• Randomly generates N
p
individuals from a uni-
form distribution in decision space;
• Uses them to train the approximate model.
Neural Network Training
• Uses a classical multilayer feedforward ANN
using the standard error back-propagation algo-
rithm;
• The ANN receives in the input six parameters that
define an individual, and generates the estimated
objective function values at the output;
• Executed every n
t
generations;
• Since it is proven (Huang, 2003) that a ANN with
two hidden layers can approximate any function
with negligibly small error, we test networks with
different number of neurons in each layer and
choose the best topology (smaller mean square er-
ror in cross-validation).
Fitness Assignment
• Same procedure as in SPEA2.
Environmental Selection
• Uses variable archive and population sizes (avoids
creating clusters of individuals);
• Controls the individual’s density in the containers.
Termination
• The EA stops when a pre-specified number of
generations is achieved, when the maximum ex-
ecution time is achieved or when it converges.
Mating Selection
• Mating occurs between individuals in the archive
and between individuals in the archive and the
population;
• The pair should be close to each other in objective
space to minimize the randomization effect.
Recombination
• Evaluates candidate offspring using the approxi-
mate model (cheaper);
• Ranks them in terms of improvement over the less
fit parent (choosing one objective function);
• Evaluates the best one using the exact objective
functions and adds it to the population;
• Should significantly speed up the EA because we
can quickly test multiple candidate individuals.
Mutation
• Evaluates possible mutations using the approxi-
mate model (cheaper);
• Performs sensitivity analysis using the ANN, test-
ing different variations of the original individual
and analysing the estimated performance;
• Ranks them in terms of improvement over the
original individual;
• Evaluates the best one using the exact objective
functions and adds it to the population.
3.3 Local Optimization
Our local search stage, based on SA, has been de-
signed to optimize two distinct objectives, namely:
• Minimize the uncovered area;
• Maximize the average POD.
This is a combinatorial problem where we have to
choose the best set of inter track distances maximiz-
ing the coverage of an area characterized by a specific
topography. We use distinct strategies depending on
the type of sonar that is being used for seafloor map-
ping, more specifically if using multibeam (no nadir
gap) or sidescan sonar (with nadir gap).
Strategy for the Case Without Nadir Gap
Initialization
• Determines the original spacing between tracks
(kept constant by the EA);
• Neighbourhood size is set to the initial spacing.
UsingEvolutionaryAlgorithmstoPlanAutomaticMinehuntingOperations
231

Evaluation
• Determines the insufficiently covered area per-
centage and the average POD (per subarea and to-
tal as seen in Figure 1);
• Accept the solution if better then the last or apply
the Metropolis criterion (Metropolis et al., 1953).
Check for termination
• Terminates when the temperature reaches a mini-
mum value or when it converges.
Mutation
• Selects the subarea between a pair of tracks with
lower coverage quality;
• Places two tracks closer together, achieving
higher coverage in the subarea in between;
• The amplitude of the mutation ∆
i
is obtained from
equation 8, where r is a random number between
-1 and 1, N is the neighborhood size and T is the
temperature of the process. It must be inferior to
the previous track spacing s
i
in subarea i;
• Update spacing s
i
(equation 7);
• Calculate the contribution (weights w
j
) of each
subarea ∆
j
( j 6= i) to compensate for ∆
i
(equations
12 and 10);
• If there are no uncovered areas (ucells = 0) then
maximize the average POD (avgpod) using a sim-
ilar procedure where track spacing is decreased in
the region where the average POD is lower;
• In this case the contribution of each region ∆
j
depends directly on the average POD in each of
those regions (equation 11).
s
i
= s
i
− ∆
i
(7)
∆
i
= rNT (8)
∆
i
= −
k
∑
j=1
j6=i
∆
j
(9)
w
0
j
=
1
ucells
j
(10)
w
0
j
= avgpod
j
(11)
w
j
=
w
0
j
∑
k
j=1
j6=i
w
0
j
(12)
∆
j
= w
j
× ∆
i
(13)
Strategy for the Case With Nadir Gap
The most used technique to handle this problem is the
uneven lawn-mowing coverage pattern, where con-
secutive pairs of tracks cover each other’s nadir. Here
we make the distinction between odd and even areas
because they are analysed differently. Even areas will
have smaller spacing since the adjacent tracks need to
be closer together in order to cover their nadir gaps.
This strategy differs from the previous one on the mu-
tation phase:
Mutation
• Similar to the previous one, except that adjust-
ing odd subareas only affects other odd subareas,
while adjusting even subareas only affects adja-
cent subareas.
• The purpose of controlling track spacing in even
subareas is mainly to cover their nadir gaps, there-
fore only the adjacent subareas should compen-
sate for the variation of track spacing.
• Even subareas should remain untouched when ad-
justing odd subareas so the nadir gaps remain cov-
ered.
4 RESULTS
With the following experiments we intend to:
• demonstrate that our multi-stage multiobjective
algorithm can solve the mission planning problem
successfully;
• show that the integration of our local search strat-
egy increases the efficiency of the search process.
4.1 Standard VS Informed EA
This experiment aims at proving the advantage of in-
tegrating the ANN in the EA. Table 1 shows the ob-
tained results. We can observe that at the initial stages
the Pareto set obtained by the informed EA is domi-
nated to a larger extent by the one obtained by the
standard EA (no ANN). This can be due to the longer
initialization phase that is executed on the former, as
the ANN needs to be trained, while the latter starts
the evolutionary process sooner. The increasing dom-
inance that the Pareto set generated by the informed
EA exhibits over time demonstrates that the ANN
is guiding the search to more promising regions, in-
creasing speed of convergence.
ICINCO2014-11thInternationalConferenceonInformaticsinControl,AutomationandRobotics
232
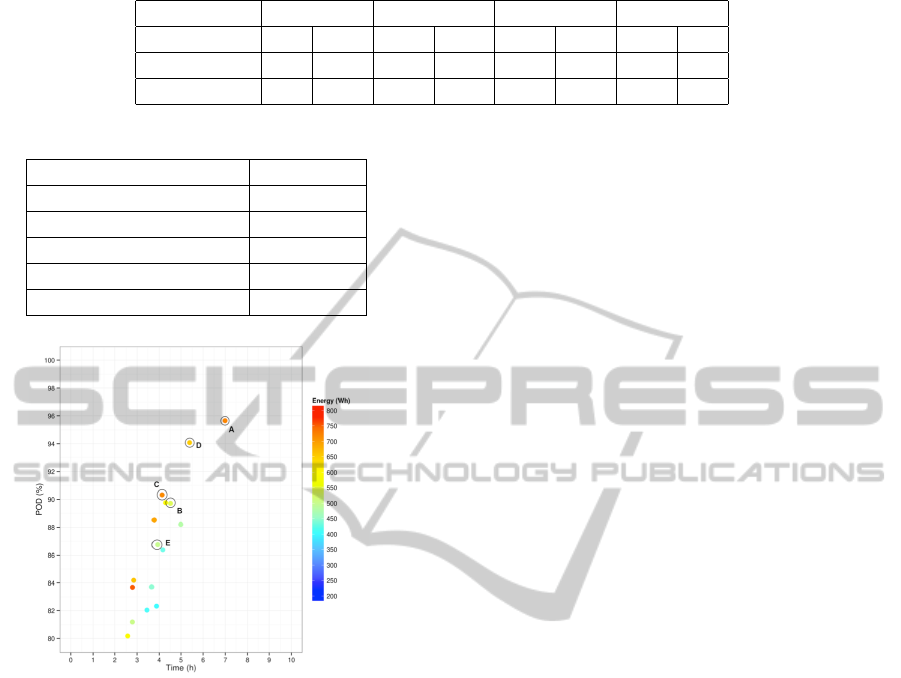
Table 1: Comparison of the obtained non-dominated sets as the EAs are executed.
Time (min) 10 20 40 60
EA Std Inf Std Inf Std Inf Std Inf
% Dominated 2.70 26.67 10.11 18.60 23.71 12.50 30.39 4.76
Generations 6 4 15 14 26 31 37 50
Table 2: Design constraints used in this test.
Parameter Bounds
Battery capacity 800 Wh
Velocity relative to water 1 ≤ v ≤ 3
Sonar maximum range 80 m
Sonar vertical beam angle 10 ≤ α ≤ 70
Maximum operating time 10 h
Figure 2: Example of a Pareto Front containing several so-
lutions for the mission planning problem.
4.2 Mission Planning with EAs
It is important to exemplify what will be the typical
output of the execution of our planning algorithm. We
decided to stop the algorithm after 1 hour so we could
analyse its behaviour in detail. Our planning prob-
lem was subject to the constraints detailed in table 2.
We selected 5 distinct solutions from the Pareto front
shown in figure 2 and these are fully described in ta-
ble 3. They were chosen because they clearly demon-
strate the trade-offs between the objective function
values. We can observe that a higher detection per-
formance implies more time to complete the mission.
As expected, we can also observe that the detection
performance is better when using smaller track spac-
ing. The velocity also has considerable impact on per-
formance as the best solutions (in terms of detection
performance) use the minimum values for this vari-
able as the energy that is saved by doing so is being
used to increase the length of the path.
4.3 Local Optimization
Non-dominated solutions previously found by our in-
formed EA were used as initial solutions here. Table
4 presents descriptive statistics for the optimized set
of solutions for covering a given area with a sidescan
sonar. It shows the variation in the amount of insuf-
ficiently covered cells ("MinRatio") and the variation
in POD. In average we obtained approximately a de-
crease of 5% in the former and a increase of 0.6% in
the latter, clearly showing the improvement made by
local search in this scenario. This demonstrates the
need for uneven lawn-mowing coverage pattern when
using a sidescan sonar. The obtained results allowed
us to take some additional conclusions related to the
usefulness of this search process. As explained ear-
lier, it is required an even number of tracks to cover
the nadir gaps caused by the use of a sidescan sonar.
If the original number of tracks is odd, then we need
to add or remove a track in order to use our algorithm.
The simulations showed that while the performance is
positively affected by an addition of a track, it is nega-
tively affected by its removal. The local optimization
algorithm could not compensate the decrease in per-
formance caused by the removal of a track. Table 5
presents the descriptive statistics for the optimized set
of solutions excluding the ones where tracks were re-
moved. It can be seen that the average POD increases
and that the amount of cells with insufficient cover-
age is reduced. In this scenario the preferred action is
to add a track, but since mission planing constraints
need to be respected, it may not be possible to do so.
Therefore we conclude that, in a time critical appli-
cation such as the one being addressed here, it may
be better to simply skip the local optimization of so-
lutions that required removal of a track since it is not
worth the extra computational time. Figure 4 shows
a graphical representation of a given solution before
and after the local optimization procedure was exe-
cuted. The improvement in this case was a decrease
of 14.0% in the amount of insufficiently covered cells
and an increase of 0.9% in the average POD. This is
visually identified by the almost inexistence of red re-
gions in the optimized solution plot. Notice that the
tracks were simply rearranged maintaining its direc-
tion and depth and that no tracks were added or re-
moved. This demonstrates the usefulness and com-
UsingEvolutionaryAlgorithmstoPlanAutomaticMinehuntingOperations
233
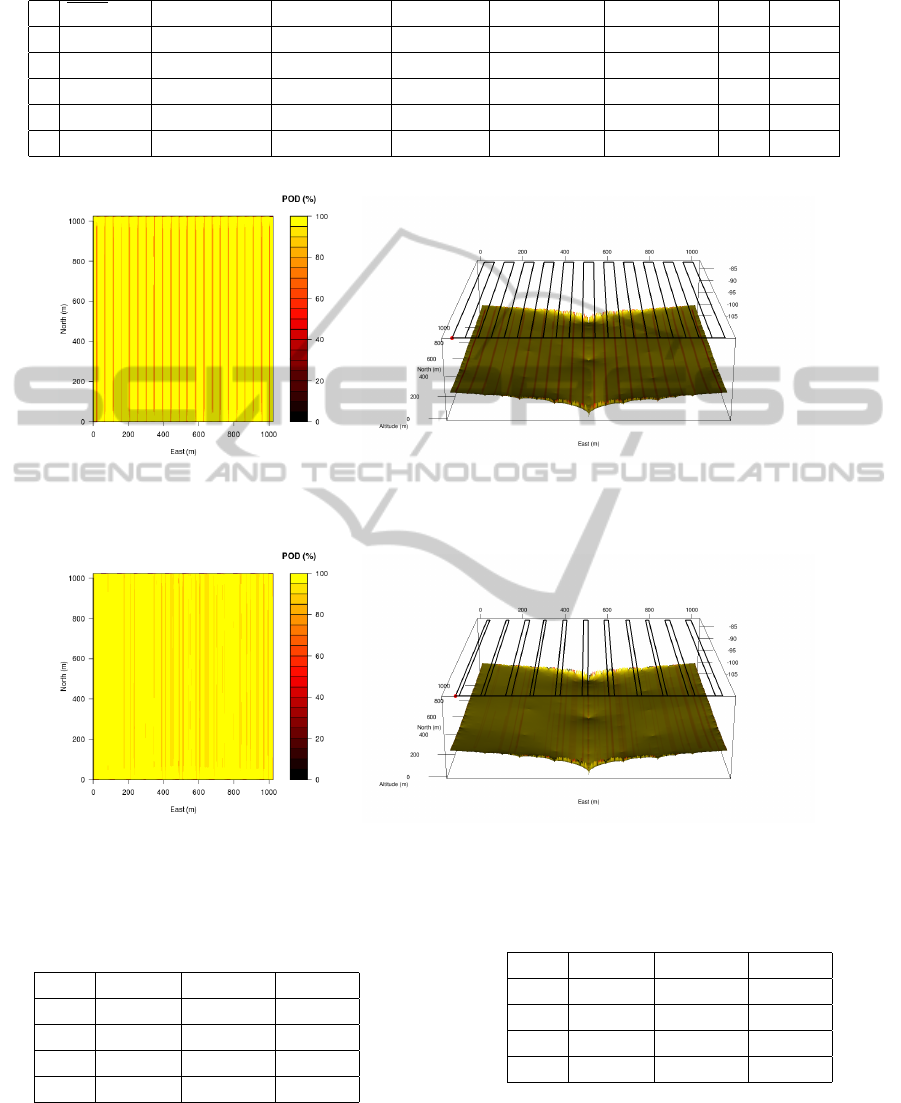
Table 3: Some distinct solutions in the Pareto Front.
s POD (%) Energy (Wh) Time (h:m:s) Depth (m) Altitude (m) Spacing (m) V Dir (◦)
A 95.65 728.80 6:59:20 - 13.24 41.13 1.07 91.44
B 89.72 537.04 4:31:11 - 11.63 63.26 1.14 32.31
C 90.33 723.73 4:07:59 82.38 - 57.46 1.34 259.87
D 94.08 656.93 5:22:51 81.24 - 50.96 1.15 16.70
E 86.75 500.53 3:55:52 - 18.00 72.31 1.18 201.79
(a) 2D coverage plot of original solution. (b) 3D coverage plot of original solution.
Figure 3: Original solution obtained by the EA using a sidescan sonar.
(a) 2D coverage plot of optimized solution. (b) 3D coverage plot of optimized solution.
Figure 4: 3D local optimization of the previous solution obtained by the EA using a sidescan sonar.
Table 4: Descriptive statistics of the complete set of solu-
tions obtained for the coverage problem using a sidescan
sonar.
∆
MR
(%) ∆
POD
(%) Time (s)
Min -19.41 -8.84 24.00
Mean -4.99 0.59 64.74
Max 11.81 5.51 380.00
SD 5.80 1.76 67.04
plementarity of both our local optimization algorithm
and our EA.
Similar experiments were performed, but using a
multibeam instead of sidescan sonar. The improve-
Table 5: Descriptive statistics of the set of solutions exclud-
ing the ones where tracks were removed.
∆
MR
(%) ∆
POD
(%) Time (s)
Min -19.41 -1.99 24.00
Mean -5.43 0.81 64.77
Max 2.09 5.51 380.00
SD 5.56 1.28 68.58
ments are considered negligible as they are smaller
by a factor of 5 then in the previous scenario, mean-
ing that the gains do not justify the extra processing
time.
ICINCO2014-11thInternationalConferenceonInformaticsinControl,AutomationandRobotics
234

5 CONCLUSIONS
This paper introduced an multiobjective multi-stage
approach combining EA with simulated annealing for
planning minehunting operations in static 3D environ-
ment with predictable terrain. Our algorithm main-
tains a diverse population of feasible solutions in or-
der to explore the search space and uses simulated an-
nealing to improve the best solutions found and pro-
duce new solutions in the neighbourhood. Our exper-
iments showed that the integration an ANN model to
guide the search is beneficial and that the proposed lo-
cal optimization phase significantly helps to improve
the quality of the solutions, however at the cost of a
higher computational time. We also exemplified what
would be the typical output of the execution of our
planning algorithm and demonstrated the role that the
decision maker may have to play when planning a
minehunting mission with an AUV.
In the near future we are going to explore mission
planning with distinct priorities for specific areas and
study mission replanning. The idea is to use these al-
gorithms to obtain a Pareto front for each area (when
replanning a mission these areas are automatically de-
fined according to mission performance) an then to
efficiently try to interconnect the coverage paths, thus
becoming a variant of the travelling salesman prob-
lem.
ACKNOWLEDGEMENTS
This work is financed by the ERDF – European Re-
gional Development Fund through the COMPETE
Programme (operational programme for competi-
tiveness) and by National Funds through the FCT
– Fundação para a Ciência e a Tecnologia (Por-
tuguese Foundation for Science and Technology)
within project FCOMP-01-0124-FEDER-037281.
REFERENCES
Choset, H. (2001). Coverage for robotics - a survey of re-
cent results. In Ann. Math. Artif. Intell. SCITEPRESS.
Darwin, C. (1859). On the Origin of Species by Means
of Natural Selection, or the Preservation of Favoured
Races in the Struggle for Life. John Murray, London,
UK.
Deb, K. (2001). Multi-objective optimization using evolu-
tionary algorithms. Wiley, UK.
Fang, C. and Anstee, S. (2010). Coverage path planning
for harbour seabed surveys using an autonomous un-
derwater vehicle. In OCEANS 2010 IEEE - Sydney,
pages 1–8. IEEE.
Fujimura, K. (1996). Path planning with multiple objec-
tives. Robot Autom. Mag., 3(1):33–38.
Huang, G. (2003). Learning capability and storage capac-
ity of two-hidden-layer feedforward networks. Neural
Networks, IEEE Transactions on, 14(2):274–281.
Koopman, B. (1999). Search and Screening: General Prin-
ciples with Historical Applications. The Military Op-
erations Research Society, Virginia, USA.
Land, S. and Choset, H. (1998). Coverage path planning for
landmine location. In 3rd International Symposium on
Technology and the Mine Problem.
Metropolis, N., Rosenbluth, A., Rosenbluth, M., Teller,
A., and Teller, E. (1953). Equation of state calcula-
tions by fast computing machines. J. Chem. Phys.,
21(6):1087–1092.
Nash, L., Hover, G., and Burns, R. (1982). Additional anal-
yses of probability of detection (pod) in search and
rescue (sar) project data. Technical report.
Stack, J. and Smith, C. (2003). Combining random and
data-driven coverage planning for underwater mine
detection. In OCEANS 2003. Proceedings, volume 5,
pages 2463–2468 Vol.5. IEEE.
Williams, D. (2010). On optimal auv track-spacing for un-
derwater mine detection. In Robotics and Automa-
tion (ICRA), 2010 IEEE International Conference on,
pages 4755–4762. IEEE.
Xiao, J., Michalewicz, Z., Zhang, L., and Trojanowski,
K. (1997). Adaptive evolutionary planner/navigator
for mobile robots. Evolutionary Computation, IEEE
Transactions on, 1(1):18–28.
Zitzler, E., Laumanns, M., and Thiele, L. (2001). Spea2:
Improving the strength pareto evolutionary algorithm.
Technical report.
UsingEvolutionaryAlgorithmstoPlanAutomaticMinehuntingOperations
235
