
3D Simulation of Industrial Large-scale Ceramics Furnace in SIMIO
Platform Environment
Georgios Tsaousoglou and Stamatis Manesis
Department of Electrical and Computer Engineering, University of Patras, Eratosthenous Str., Rio, Greece
Keywords: Industrial Production, 3D Modeling, Simulation, Production Management.
Abstract: This article presents a 3D simulation of an industrial large-scale furnace operating in the NGC (Northern
Greece Ceramics) ceramics industrial plant. The 3D modelling and simulation of the long industrial furnace
is based on the SIMIO software platform the capabilities of which are explored and tested in such a complex
production plant. After the understanding of the real system operational characteristics, its macroscopic
behaviour has been extracted and modelled; then a 3D model was created. Using the model, matters
concerning the production process optimization are explored, while also alternative production scenarios are
simulated, so that conclusions for the system’s behaviour at value variation of the functional parameters of
the real system can be extracted, without experimenting on the real process. In the four main sections of this
article, the following aspects are presented: the modeling approach of the furnace operation, the SIMIO
model of the furnace, its operation, examples of possible model applications and utility of the developed
model and further modeling of the whole production procedure preceding the furnace.
1 INTRODUCTION
Ceramic industry is considered to be among the
most ancient industries (Ameida et al., 2013). As the
production facilities and techniques are up-to-date
evolving, the production of bricks and tiles in the
modern era is supported almost entirely by industrial
large-scale production units. The major
reconstruction and the global adoption of the use of
ceramics in building architecture brought the
requirement for large-scale production as well as for
quality control, standardization, modernization of
methods, production cost reduction and innovation
(Bleininger, 1917) with one of the latest fields of
research being the production of ceramics from
waste materials (Jahangirian et al., 2010).
In a modern ceramics production unit, the entire
production process is automated. In normal
operation of the system no interference of human
hand is needed in any stage of the process, from mud
mixing, to shaping to drying (Lianyang Zhang,
2013), to baking. Human employment is oriented at
supervision, prevention and correction of errors,
planning and production organization etc. The
manual labor is replaced by integrated automated
systems formed by the cooperation of conveyors,
machinery processing, robotic arms, etc. The
production capacity of modern units totals more than
1000 tones of product per day. Industrial furnaces
are used, whose length is approximately 100 meters
while the maximum temperature of the interior, are
of the order of 1000 degrees Celsius.
1.1 The Profits of Simulation in the
Industrial Ceramics Furnace
Application
Simulation represents important elements of the real
system, thus has long been used to help designers,
engineers and investors, experience exposure to
circumstances both routine and unexpected and
explore the behavior of a system under certain
conditions. In the last decades a very large amount
of simulation techniques and applications have been
published (Terzia et al., 2004). The simulation
model can be used to investigate possible changes
and alternative choices in a low risk environment, as
opposed to the risk of experimenting with the actual
furnace plant, which could result not only in
inestimable cost but also in accidents of high danger.
Hence, ceramics production units are too expensive
or dangerous to make live tests. Simulation provides
a cheap, safe way to check the changes that may be
either a simple revision to the existing production
716
Tsaousoglou G. and Manesis S..
3D Simulation of Industrial Large-scale Ceramics Furnace in SIMIO Platform Environment.
DOI: 10.5220/0005046207160723
In Proceedings of the 11th International Conference on Informatics in Control, Automation and Robotics (ICINCO-2014), pages 716-723
ISBN: 978-989-758-040-6
Copyright
c
2014 SCITEPRESS (Science and Technology Publications, Lda.)
line, emulation of a new control system or
redesigning the entire production chain. The “best
guess” is usually a poor substitute for an objective
analysis, while now we can accurately predict
system behavior under different conditions and
reduce the risk of a bad decision.
Moreover, here the prediction of variability of
the process is important. A quick analysis cannot
capture the dynamic aspects of the system and issues
that can have a significant impact on system
performance. Through simulation we can be
provided with a better understanding of how
different parts interact and how they affect the
overall system performance.
Finally, with the modeled developed we are
given the capability of communicating ideas. We
can help partners, customers, employees or investors
to better understand the system. The modern 3D
modeling promotes communication and
understanding to a wide audience.
1.2 SIMIO Simulation Software
SIMIO is a SImulation Modeling framework based
on Intelligent Objects. It is a modeling tool that
combines the simplicity of objects with the
flexibility of procedures for the provision of a rapid
modeling without requiring programming (Oba et
al., 2014). It can be used to predict and improve the
performance of dynamic, complex systems (Pegden,
2014). The software prototypes and displays a three-
dimensional illustration of the behavior of the
system over time. Although simulation and
visualization tools have existed for many years,
SIMIO makes modeling extremely easy by
providing a new object-oriented approach. One can
select (http://www.simio.com/index.html) objects
from libraries and place graphics in the model.
Objects represent the physical components of the
system, such as tiles, conveyors, wagons etc. One
aspect that is often overlooked in the analysis of
systems performance is the role that randomness
plays in determining the behavior of the system. By
randomness we mean the idea that things that
happen in our system occur with some differences
from one another. Classic examples of randomness
are: the time between the arrival of a system entity
until the arrival of the next, the time between
failures of equipment or the time it takes to complete
an activity. If we want to understand and improve
our system we need to model accurately the
variations relevant to the randomness in the system.
In the model developed, the randomness factor was
implemented for the production line preceding the
furnace. The model of the furnace itself is
deterministic, as is the actual system due to control
techniques applied.
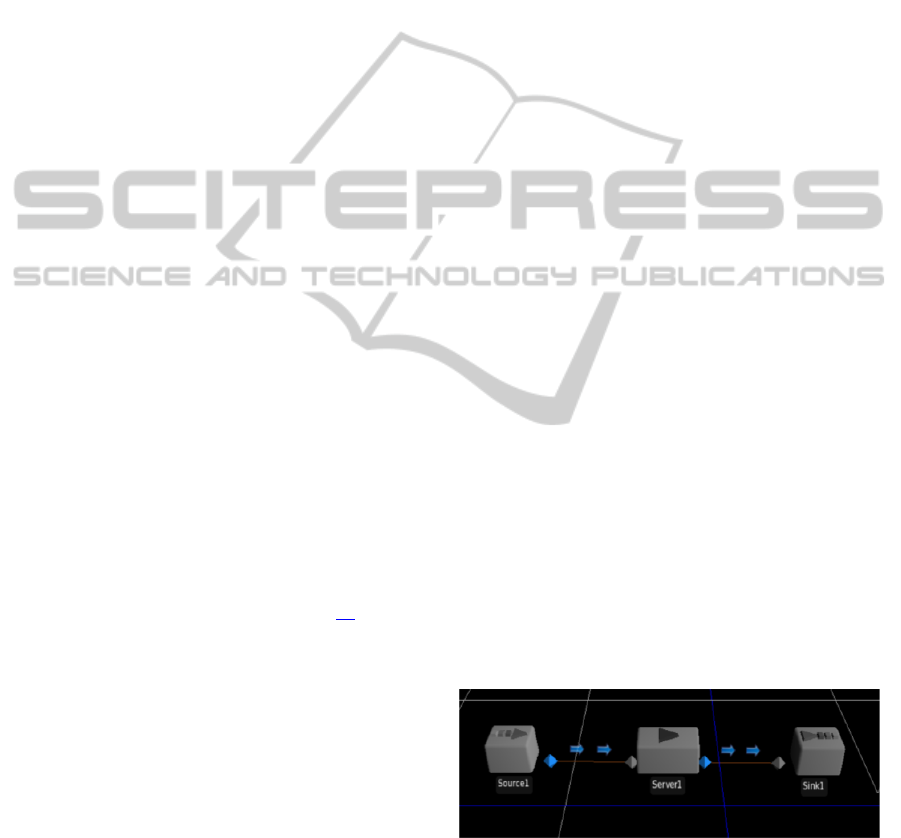
Consider a SIMIO model for a very simple
system in which entities arrive, processed by a
server, and then depart from the system. For this
simple example in which the system makes use of a
source, a server, a draw and a route from the library,
the SIMIO model is shown in Figure 1. The entities
entering the system from the source move to the
server where they are processed one by one and then
go to the draw where they leave the system.
The rate at which the source creates entities and
the processing time in the server are adjusted from
the user to the properties of the corresponding object
and the aforementioned factor of randomness can be
included (SIMIO LLC Documentation, 2011).
1.3 Overview of the Industrial, Large
Scale, Ceramics Furnace
The furnace, with which we deal, is of the
continuous, propulsion type. There are two gates,
one entrance and one exit and the tiles are baked
while moving inside the oven. In fact every time a
new wagon of tiles enters, all wagons move forward
to the next position, while the last wagon leaves the
oven. The oven has a length of 90 meters and 33
wagon positions. In normal operation, the input rate
of the heat is stable and the burners are rarely turned
off. Three distinct zones along the oven are formed.
First is the preheating zone starting from the first
wagon until the 7th. Second is the fire zone from the
8th until the 18th wagon and third is the cooling
zone from the 19th until the 33th wagon. The
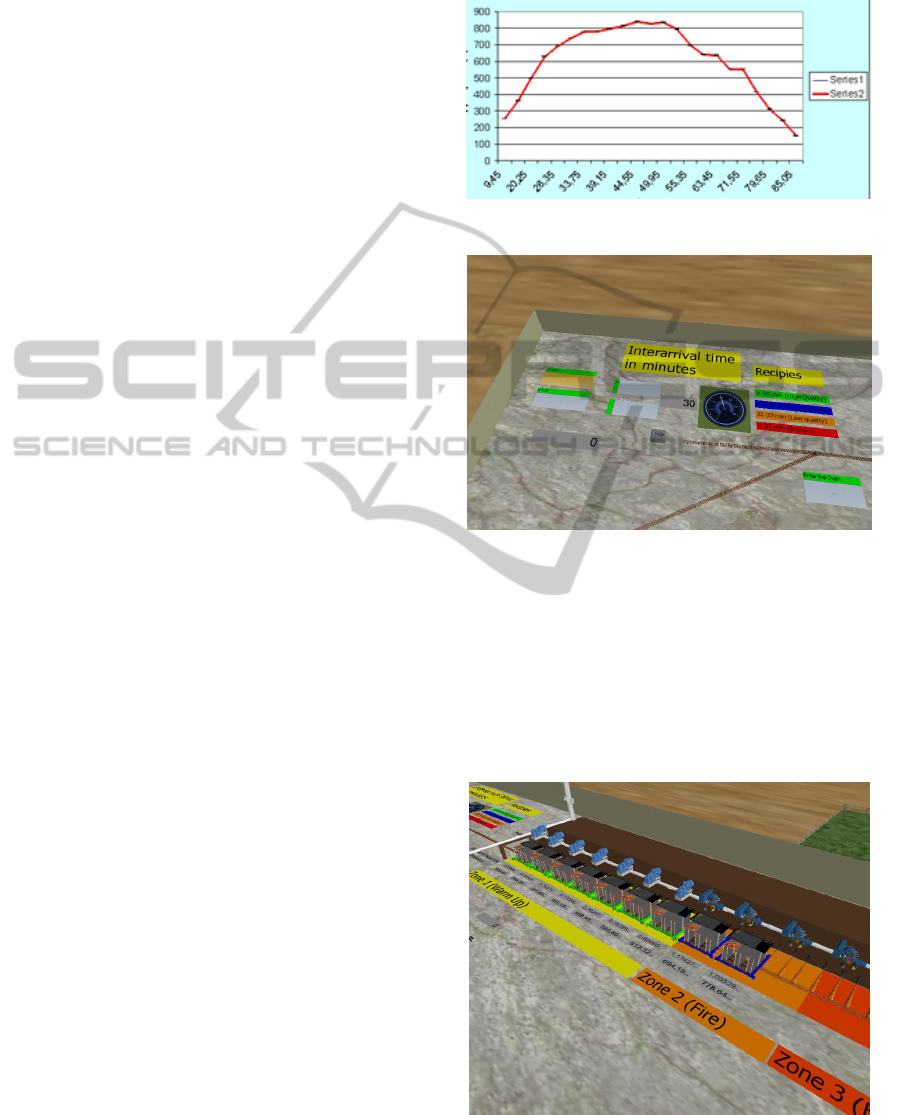
thermal energy flow inside the furnace is subject to
extensive thermal analysis (Warren et al., 2000). In
Figure 2, the temperature curve throughout the
length of the oven is presented.
Figure 1: Simple SIMIO model.
2 MODELING APPROACH OF
THE FURNACE OPERATION
Each wagon is modeled as an entity carrying the
3DSimulationofIndustrialLarge-scaleCeramicsFurnaceinSIMIOPlatformEnvironment
717
following properties which are variable with respect
to time:
• Temperature: Refers to the current temperature of
the tiles in the wagon
• Temperature Rate of change: Is the current rate at
which wagon temperature changes. Expressed in
degrees Kelvin per minute
• Ready or not: Boolean variable expressing whether
the tiles are baked (ready) or not.
• Quality: Expresses the current quality of the
wagon’s tiles based on the quality of baking
suffered. The more abruptly the temperature is
altered the worse the tiles quality turns out to be.
• Damaged or not: Boolean variable which expresses
whether the tiles are broken (due to abrupt
temperature change).
The most important of the above is the
“Temperature Rate of change”, according to which,
the rest of the properties are easily calculated. The
rate at which the tiles temperature changes at each
position depends on the temperature difference with
respect to the environment (furnace position
temperature) and a number of factors such as the
thermal conductivity of the material, the proportion
of heat absorbed by the walls of the furnace and of
the metals of the wagon etc. The industrial furnace
operation is thus described by a set of strongly non-
linear equations, making it extremely difficult to
implement them in a 3D model which needs to solve
them in a short simulation time. The shortness of the
simulation time is important here, so that the
illustrative part of the model is valid. Based on real
systems’ data and the industrial furnace model non-
linear equations, linear equations were built to
approach the macroscopic behavior of the system
and applied in order to estimate the “Temperature
Rate of change” in real time for each individual
wagon at its current position.
The user determines the rate at which wagons are
imported in the furnace (minutes before entering
new wagon). This is the same like determining how
long a wagon remains at each position. As output,
the user sees the current real time simulation values
of the above wagon’s properties, for each individual
wagon. Moreover sees the temperature at which the
wagons leave the furnace (exiting temperature) and
the total number of wagons produced.
3 THE SIMIO MODEL OF THE
FURNACE
We have now a first version of the model. At the
entrance of the furnace, wagons arrive at a rate set
by the user as shown in Figure 3.
Figure 2: Temperature throughout the length of the oven.
Figure 3: User defines the input rate.
The first wagon inserts at the first position, where it
stops and begins to alter its properties based on the
model equations and the parameters of the position
(environment temperature). When the second wagon
arrives, inserts at the first position, “pushing” the
first wagon to the second position, where its
properties continue altering, based now on the
parameters of the second furnace position.
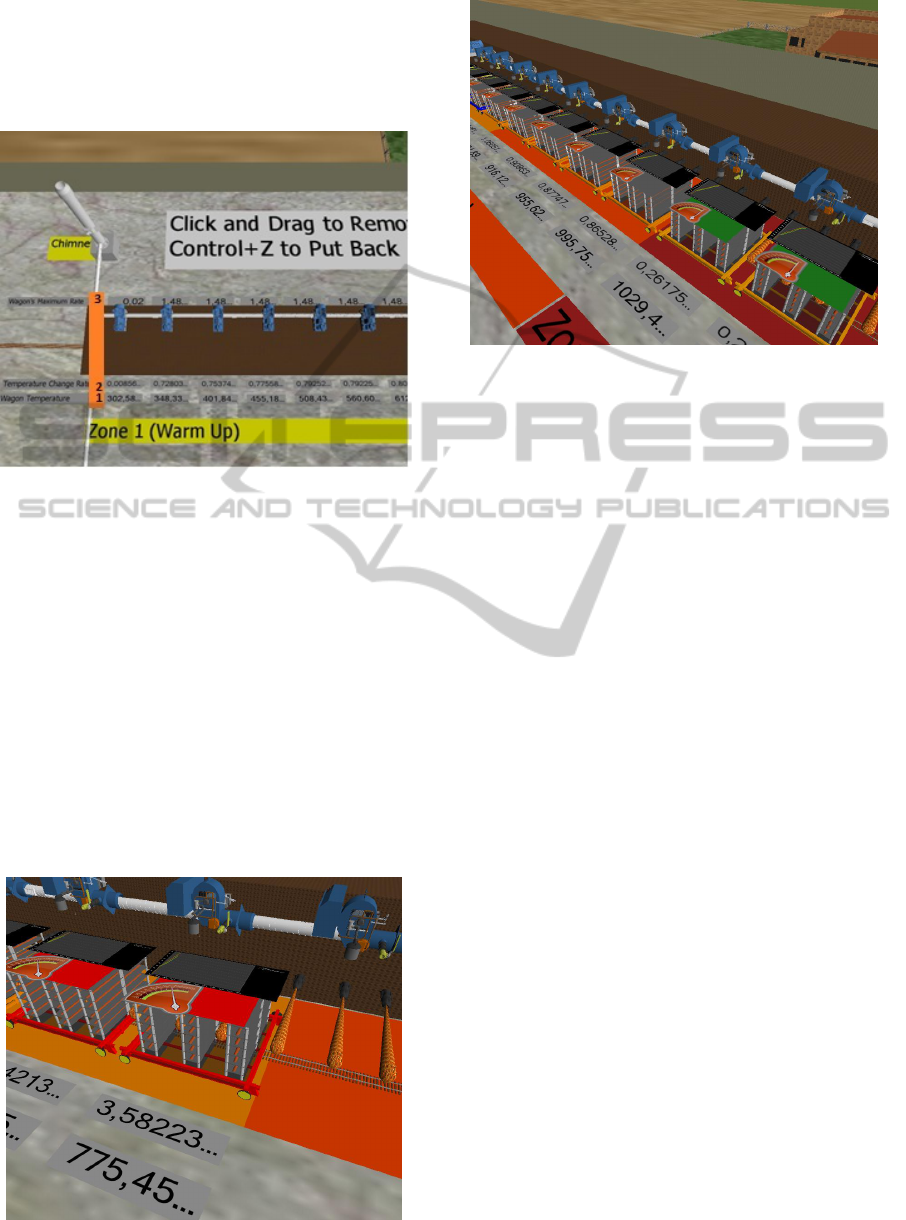
Figure 4: Wagons processing through the furnace.
The process shown in Figure 4 continues until
ICINCO2014-11thInternationalConferenceonInformaticsinControl,AutomationandRobotics
718
the user presses the Stop button. When a wagon
arrives at the last position (33h), on the next wagon
arrival, it exits the furnace, its temperature is
recorded at the “output temperature by which the
wagons leaving the oven” and leaves the system.
Figure 5: Indication of outputs.
The model illustrates all the outputs that the user
needs to see as shown in Figure 5.
1) Current temperature in each wagon
2) Current Temperature Rate of change for each
wagon
3) Maximum temperature rate suffered by each
wagon
4) For each wagon if it is ready or not
5) The current quality of tiles of each wagon. This
is depicted by the color of the base of the wagon.
Interpreted as:
Green: High quality
Blue: average quality
Orange: Poor quality
Red: broken tiles (Figure 6)
Figure 6: Wagons turn red when tiles are broken.
Figure 7: Wagons turn green when ready.
When the temperature of the tiles of a wagon
exceeds a certain value, they are considered baked
(ready) and the roof of the wagon turns green as
shown in Figure 7.
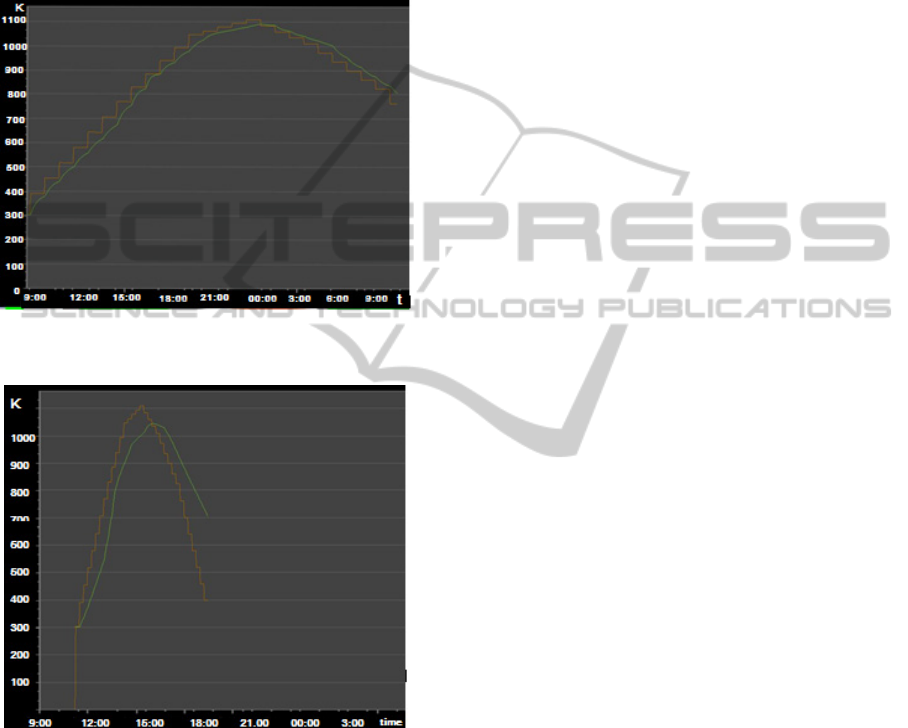
Each wagon, in addition to the above indications,
also carries two displays on the roof. A thermometer
which shows the current temperature and a diagram
showing the temperature of the particular wagon as a
function of time, from the time entered in the
furnace until the current time.
This chart gives us a very useful illustration of
temperature, from which one can understand the
response and operation of the model. The red line
shows the furnace temperature from place to place,
such as seen by the wagon. Step increased, as the
wagon moves from one position to the next. As
shown, the curve of the temperature along the
furnace, extracted by the model during the
simulation, verifies the actual oven temperature
curve (Figure 2).
The green line shows the temperature of the tiles.
This generally tends to approach the red line.
Whether it reaches it or not, depends on the time
given to it, i.e. how much time a wagon is left to stay
in each position. As we can see in Figures 8 and 9,
clearly depends on the rate at which wagons are
imported in the oven. Two examples are given.
In Figure 8 the wagon tiles’ temperature
approaches the furnace temperature quite accurately,
which is logical as they are baked for quite a long
time.
The curves in Figure 9 result steeper, which
means high rates of temperature change of the tiles,
i.e. tiles of low quality or cracked. Also, it must be
noticed that the green curve does not manage to
reach the red.
3DSimulationofIndustrialLarge-scaleCeramicsFurnaceinSIMIOPlatformEnvironment
719
Practically, this means that we spent much
energy to maintain the oven temperature high,
without this being exploited for the baking of the
tiles since they do not stay long enough in the oven
to smoothly absorb this heat. Characteristic of this
waste is the temperature at which the wagons leave
the furnace (exiting temperature), as will be made
clear in the next section.
Figure 8: Wagon temperature diagram for low import rate
(one wagon every 60 minutes).
Figure 9: Wagon temperature for high import rate (one
wagon every 15 minutes).
4 EXAMPLES OF POSSIBLE
MODEL APPLICATIONS AND
UTILITY OF THE DEVELOPED
MODEL
We want to study the behavior of the model and the
results for different values of operating parameters.
The aim is to draw conclusions about the real system
and with the experiments made on the model. Thus,
to the extent that the model corresponds to the real
system, we acquire knowledge about the behavior of
the system in different operation modes. That would
be impossible to achieve with experimentation on
the actual production line, since the cost would be
too high.
With the experience drawn by experiments, we
can now make decisions concerning the production
strategy, making strategic choices and not random.
Experimentation could be done by running the
model separately for each case. But SIMIO provides
us with a powerful simulation tool, which gives us
the ability to run experiments. The designer designs
the experiment by choosing parameters which are
subject to value variation and setting the values of
these for each "scenario". Then selects those outputs,
which’s the behavior wants to study. The different
scenarios are running really fast and the software
shows the results. An example of such an
“experiment” is following.
4.1 Experiment: Study of the Import
Frequency of Wagons in the Oven
As varying-value parameter we select the import rate
of wagons in the oven (minutes per wagon) chosen
by the operator. We want, in correspondence with it,
to study the temperature at which wagons exit the
furnace.
The outlet temperature is a very important
parameter in the operation of the oven. It is a
characteristic parameter which indicates whether we
apply proper heat management of the oven and
proper management of the fuel. A high value of this
temperature is undesirable, mainly for two reasons.
First, tiles of high outlet temperature are sensitive to
cracks during further processes and secondly show
us that there has been waste of fuel. This is partly
because the excess heat, stored in the tiles, is
released in the environment and not exploited for
use in heating the tiles currently being in the stages
of fire, preheating or drying. Also, the fuel spent to
maintain the furnace temperature at high levels is
not utilized properly, because the tiles do not have
time to absorb the heat, thus resulting being baked
forcibly and heat is released to the environment
through the cooling tower, which in normal
conditions is not used at all.
We will consider four cases for value variation of
import rate: entering wagon every 19, 24, 42 and 52
minutes respectively. The results of the experiment
are summarized in Table 1.
ICINCO2014-11thInternationalConferenceonInformaticsinControl,AutomationandRobotics
720
4.2 Use of the Results for Improvement
of the Production Strategy
From the results we can estimate which is the cost
(high temperature output) if we want to produce
quickly (increase production). Hence, if there is a
need for rapid production (e.g. short-notice order)
we can determine the cost of meeting the demand, so
that the pricing of the product can be made
accordingly.
Table 1: Tiles exiting temperature to varying values of
Import Rate.
Import Rate (min) Exiting Temperature (K)
19 659.5
24 619.5
42 538.2
52 512.8
5 FURTHER MODEL
EXTENSION AND
APPLICATION
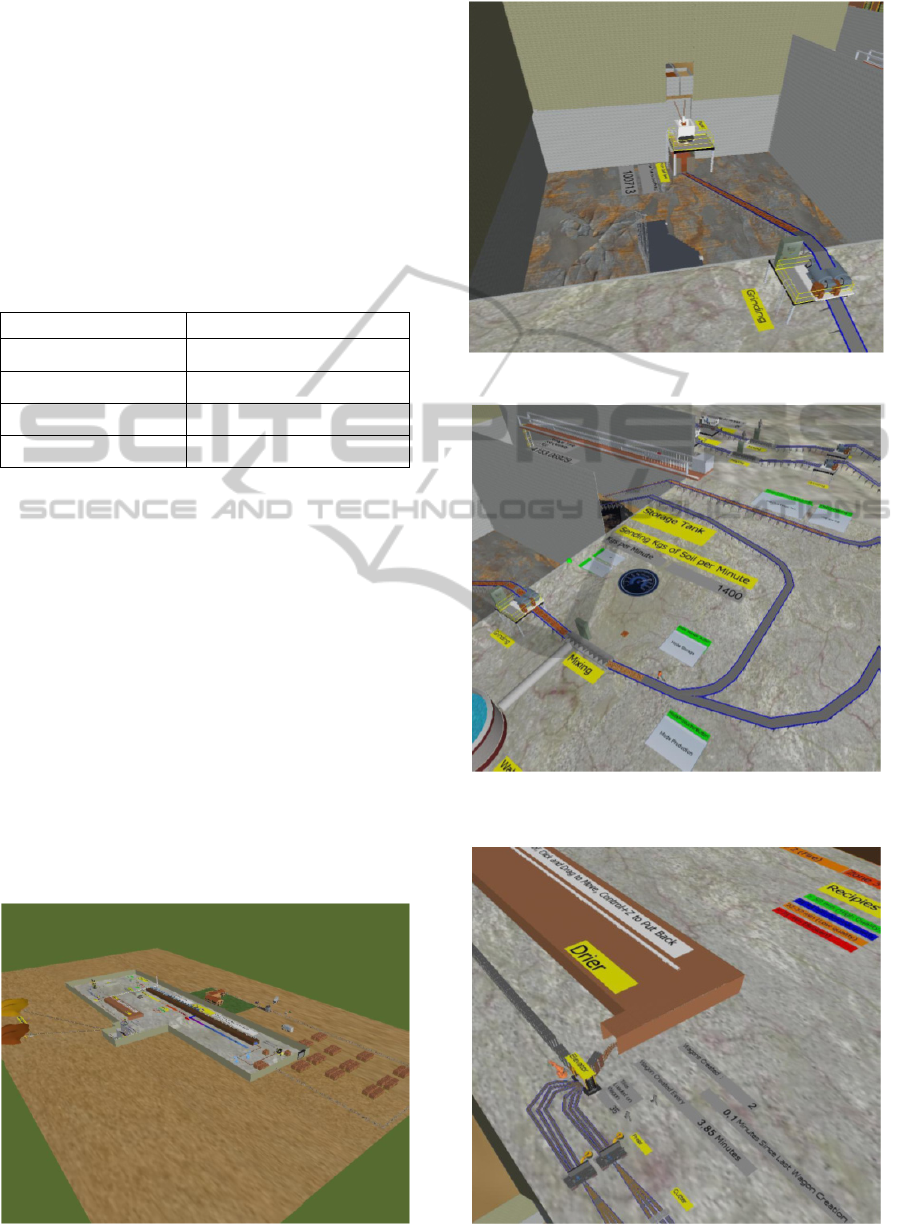
The whole production line (preceding the furnace)
was modeled. The stages in which the soil is
smoothed, mixed, stored, molded, cut, dried and
loaded on the wagons are incorporated in the model
and some samples are presented in Figures 10-13.
With the whole production line modeled, the user
can select with how many kgs per minute of soil he
wants to supply the production line. The choice of
the user is very important for the operation of the
whole model since as we will see, so is the rate at
which wagons enter the oven. That is, the user's
Figure 10: Panoramic view of the model.
Figure 11: Grinding stage.
Figure 12: User defines kgs per min of soil sent to the
production line.
Figure 13: Wagons of tiles inserted in the Drier.
3DSimulationofIndustrialLarge-scaleCeramicsFurnaceinSIMIOPlatformEnvironment
721
choice must be consistent with the production goals
to be served. An experiment this option affects the
rate at which wagons are prepared, thus designed
upon the variation of the parameter value “kgs per
minute” (of soil sent to the production line) explores
the impact of the user’s possible choices while in
this experiment the randomness factor is being
incorporated in our model, representing the
deviation in the value of the aforementioned
parameter, “kgs per minute”.
5.1 Experiment: Study of the Wagon
Production Rate
As varying parameter is set the rate at which soil is
provided to the production line (kgs per minute). We
want to study the time it takes to prepare a wagon
and the number of wagons prepared in 24 hours with
respect to this parameter.
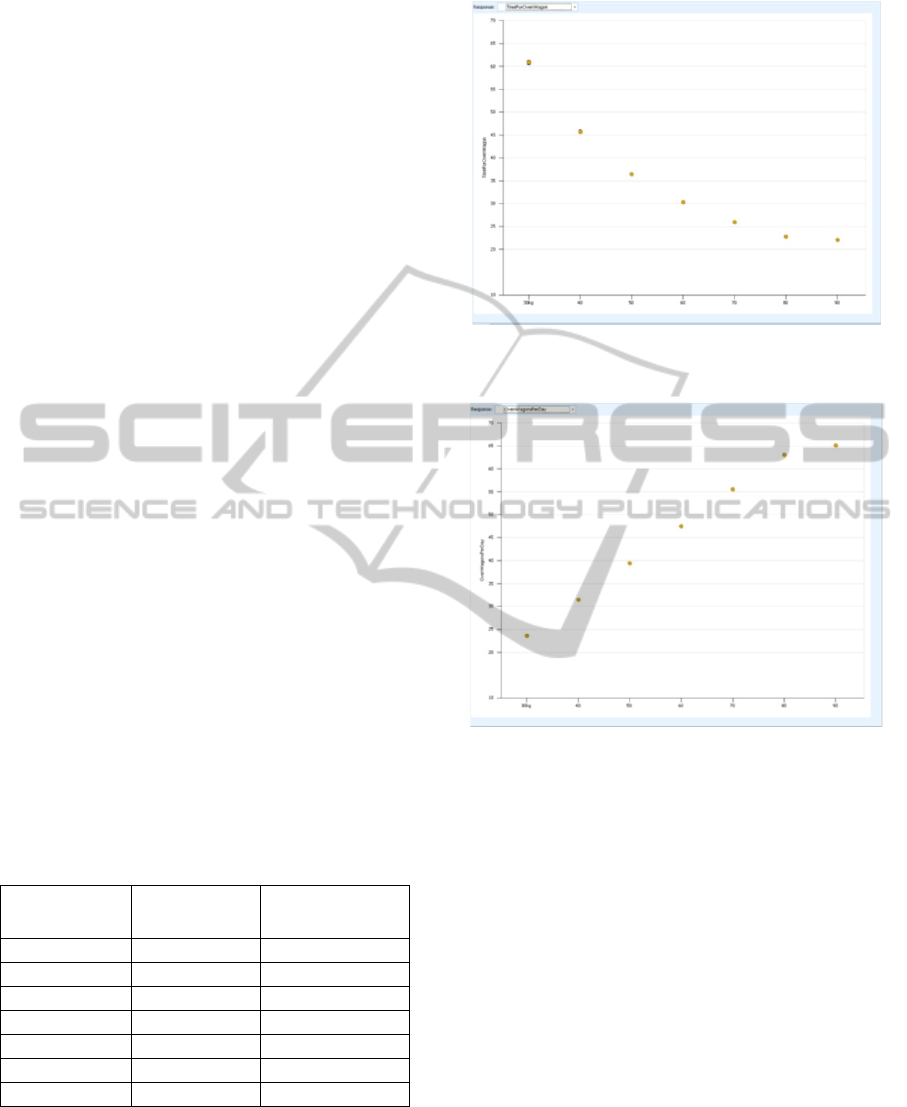
We will study seven cases for the value of the
soil supply rate from 30 to 90 (in step 10) kgs of soil
per minute. A deviation is also incorporated. More
precisely, the rates of supply are 7 different
distributions (normal) with centers of the above
values and a standard deviation of 10. The results of
the experiment are summarized in Table 2, (average
values of distributions). The two responses of the
experiment are represented graphically in Figures 14
and 15. The supply of soil is represented on the
horizontal axis in kgs per minute.
Furthermore, by combining the results of the two
experiments, we can answer the question: "If you
have to produce X wagons in Y days, how much soil
must be provided to the line?"
Table 2: Time for Wagon preparation and Wagons
produced in 24 hours, according to the soil supply of the
line (model experiment results).
Soil Supply
(kgs per min)
Time for
Wagon (min)
Produced
Wagons in 24h
30 60.89 23
40 45,76 31
50 36,47 39
60 30,33 47
70 25,95 55
80 22,82 63
90 22,10 65
That is, if we want to produce X wagons the next
day, we should put wagons at a rate A, thus we
provide Y soil supply at current day (about 13 hours
earlier because of the residence time in the drying
stage and preparation time). So depending on the
Figure 14: Time for wagon preparation (vertical axis) as a
function of soil supply.
Figure 15: Wagons produced in 24 hours (vertical axis) as
a function of soil supply.
value of X someone can find the appropriate value
for Y from tables or rerun the experiment for the
desired value of X.
6 CONCLUSIONS
A 3D model of the system and examples of
experiments using SIMIO were implemented in this
paper. The simulation experiments protect us from
wasting resources and poor choices. In addition, it
can help to investigate investment projects. For
instance, it can be studied on the model a new
machine installation to replace an old and with
respect to the new performance of the particular
stage, to study the impact to the whole production.
Thus we can estimate the feasibility, viability and
usefulness of the candidate investment. Results show
that such a model could be proven quite a useful tool
ICINCO2014-11thInternationalConferenceonInformaticsinControl,AutomationandRobotics
722

in the hands of the production organizing engineer,
the investment consultant as well as the investor.
It should be noted that such models, while
powerful are only used to support the decision
making process only offline. It is open to future
research, the implementation of simulation models
that dynamically communicate with the operating
furnace, predicting its sort term behavior to a
possible decision so as to support a real time
decision support tool.
REFERENCES
Ameida, G, Silva J. et al. (2013) Heat and mass transport
in an industrial tunnel dryer: modeling and simulation
applied to hollow bricks. Applied Thermal Eng., Vol.
55, pp 78–86.
Bleininger, A. V. (1917) “The development of the ceramic
industries in the United States” Journal of The
Franklin Institute, Vol. 183, 1917.
Jahangirian, M.et al. (2010) Simulation in manufacturing
and business: A review European Journal of
Operational Research, Vol. 203, pp 1–13.
Lianyang Zhang (2013) Production of bricks from waste
materials – A review, Construction and building
materials, Vol. 47, pp 643-655.
Matthew, P. et al. (2000) Technological innovation
antecedents in the UK ceramics industry, Int. J.
Production Economics, Vol. 65, pp 85-98.
Oba, R., et al. (2014) Thermal analysis of a tunnel kiln
used to produce roof tiles Applied Thermal
Engineering Vol. 63, pp 59-65.
Pegden, D. C. (2014) “An Introduction to Simio® for
Beginners” www.simio.com, Simio LLC 504 Beaver
St.Sewickley, PA 15143, U.S.A.
SIMIO LLC. Documentation (2011), SIMIO Reference
Guide, Version 4.
Terzia, S. & Cavalieri S. (2004) Simulation in the supply
chain context: a survey, Computers in Industry, Vol.
53, Issue 1, pp 3-16.
Warren, M. P. et al. (2000) Technological innovation
antecedents in the UK ceramics industry, Int. Journal
Production Economics, Vol. 65, pp. 85-98.
http://www.simio.com/index.html.
3DSimulationofIndustrialLarge-scaleCeramicsFurnaceinSIMIOPlatformEnvironment
723
