
An Application Supporting Gastroesophageal Multichannel
Intraluminal Impedance-pH Analysis
Piotr Mateusz Tojza, Dawid Gradolewski
and Grzegorz Redlarski
Department of Electrical and Control Engineering,
Gdansk University of Technology, G. Narutowicza 11/12, Gdansk, Poland
Keywords: MII-pH Analysis, Gastroesophageal Impedance, GERD, LPR.
Abstract: Due to a significant rise in the number of patients diagnosed with diseases of the upper gastrointestinal tract
and the high cost of treatment, there is a need to further research on one of the most popular diagnostic tests
used in this case – esophageal Multichannel Intraluminal Impedance and pH measurement. This may lead to
finding new diagnostically relevant information, used to quicken and improve the diagnostic procedure. The
paper presents an algorithm used in a new computer application dedicated for researchers and physicians
interested in research connected with Gastroesophageal impedance and pH data analysis. A possibility to
modify a wide range of the algorithms parameters as well as rich set of the programs functions allows
researchers to search for new criteria to assess the pH and impedance data when diagnosing diseases of the
upper gastrointestinal tract. This, in turn, may lead to improving the time and accuracy of the MII-pH
analysis which will substantially affect the patient’s diagnosis time and treatment. Moreover, the diagnosing
physician will be able to asses more tests, which is important, due to a significant rise in the number of
patients seeking attention when speaking about the diseases of the upper gastrointestinal tract.
1 INTRODUCTION
The mechanism of gastric content regurgitation from
the stomach to the esophagus is a physiological
phenomenon which occurs naturally in the human
circadian cycle (Yamada, 2006a; Porro, 2003). The
anti-reflux barrier and the esophagus purification
mechanism from hydrochloric acid (the so-called
acid clearance) protect against excessive exposure of
the esophagus tissues to the gastric material - mainly
hydrochloric acid and pepsin. An undesirable
situation occurs when, for various reasons, the
physiological mechanisms of esophagus protection
against acid fail. Given that the hydrochloric acid
and pepsin are the most harmful upper
gastrointestinal tract secretions and play an
important role in the pathogenesis of erosive
esophagitis (Porro, 2003), such a situation often
leads to the onset and development of reflux disease
of the upper GI (gastrointestinal) tract.
Gastroesophageal reflux disease - GERD is one
of the most commonly diagnosed diseases of the
upper gastrointestinal tract, especially among the
inhabitants of developed countries (Yamada, 2006a;
Segal et al., 2011; Tutuian et al., 2008). It is
estimated that the symptoms occur at least once a
month in 44% of adult Americans, approximately
20% of Europeans, 6.6% Japanese and Singaporeans
and 3.5% of Koreans, whereas among the
inhabitants of Africa and some Asian countries the
disease is diagnosed very rarely (Yamada, 2006a).
The impact on the occurrence and development of
the disease is largely influenced by the lifestyle of
people in the developed countries, including: type of
diet, the use of stimulants (alcohol, coffee,
smoking), or stress. In addition, the symptoms of
GERD may increase as a result of misalignment
during sleep or during increased physical activity
(e.g. during exercise at the gym) (Yamada, 2006b).
Diseases of the upper gastrointestinal tract such
as GERD or LPR - (laryngopharyngeal reflux) have
troublesome symptoms which, if untreated, can lead
to reduced quality of life, tissue lesions of the upper
gastrointestinal tract and even, in extreme cases, be
the source of neoplastic changes. The most common,
troublesome symptom of the diseases is heartburn,
often described as a burning sensation behind the
breastbone, moving from the xiphoid in the direction
of the mouth (Yamada, 2006a) or, in fever cases, the
back (Yamada, 2006b). During the early stage of
231
Tojza P., Gradolewski D. and Redlarski G..
An Application Supporting Gastroesophageal Multichannel Intraluminal Impedance-pH Analysis.
DOI: 10.5220/0005050402310238
In Proceedings of the 11th International Conference on Signal Processing and Multimedia Applications (SIGMAP-2014), pages 231-238
ISBN: 978-989-758-046-8
Copyright
c
2014 SCITEPRESS (Science and Technology Publications, Lda.)
diagnosing the cause of the pain, this symptom may
be erroneously associated with ischemic heart
disease. An additional complication in the case of
distinguishing between the diseases is that
regurgitation into the esophagus causes, among other
things, a reduction in blood flow in the coronary
arteries. In addition, patients indicate a bitter or
sweet taste in the mouth - a result of activation of the
anti-acid defense mechanism in the esophagus -
secretion by the salivary a fluid containing salts.
Another important symptom associated with the
esophagus reflux diseases is chest pain, often
described as tightness or burning occurring behind
the sternum and radiating to the back, neck, jaw or
arm, which may be incorrectly diagnosed as angina
pectoris. Often, the pain intensifies after a meal or
while under the influence of stress and often causes
awakening from sleep. Typically an episode of pain,
caused by a gastroesophageal reflux disease lasts
from a few minutes to several hours and disappears
spontaneously. Extensive research of the cause of
pain did not give clear answers. It is considered that
the cause of pain for patients with GERD is
multifactorial and related to the concentration of H
+
ions, the volume of the gastric content, the duration
of the reflux episodes and secondary spasm of the
esophagus. Moreover, GERD is the third most
common cause of chronic cough, after the symptoms
associated with sinuses and asthma - it is estimated
that reflux diseases causes approximately 20% of
chronic cough cases. A co-occurrence of GERD in
80% of patients with asthma was observed.
Research also revealed a relationship between
the reflux diseases of the upper gastrointestinal tract
and diseases of the upper respiratory tract - in
particular asthma.
Abnormalities associated with an increased
number of reflux episodes may also be the cause of
ailments and symptoms of laryngological changes,
among which the most common are the reflux
inflammation of laryngitis and also inflammation of
the ear, nose and throat. It should also be noted that
the growing number of patients who are diagnosed
with GERD has a significant economic importance.
In the U.S. alone, the annual cost of antacid
medicine is estimated at 4-5 billion dollars (Yamada,
2006b).
Over the years many different methods for
diagnosis of diseases of the upper gastrointestinal
tract were developed, including invasive and non-
destructive methods, with different values of
specificity or accuracy. By far the most frequently
used invasive method of diagnosing lesions
associated with GERD and LPR is the measurement
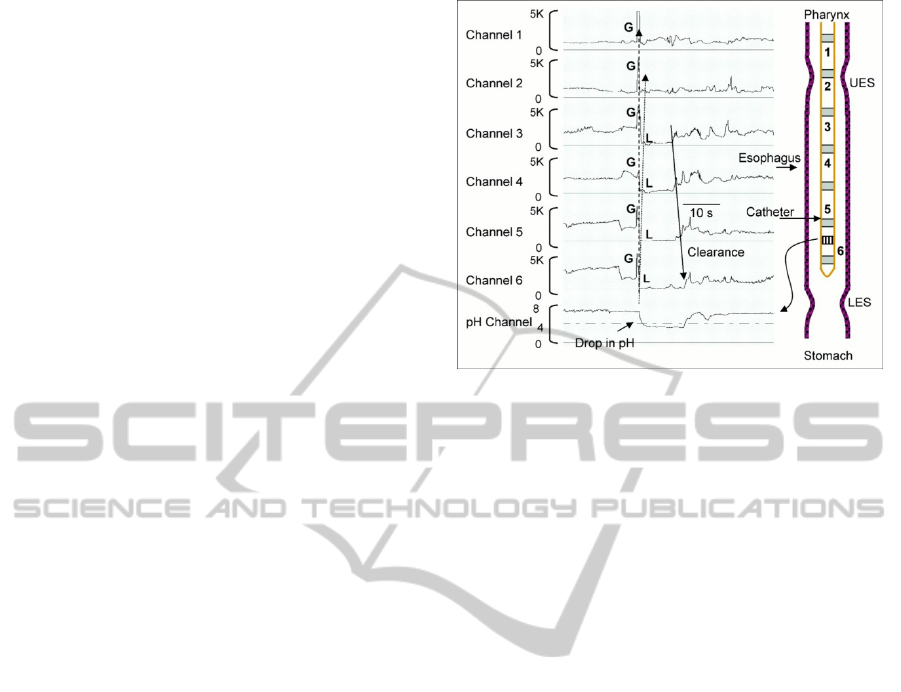
Figure 1: MII-pH exam overview (Tutuian and Castell,
2003).
of esophageal pH and, in recent years, the
measurement of the impedance of the esophagus
(Yamada, 2006a; Yamada, 2006b; Kahrilas, 2001;
Lazarescu and Sifrim, 2008; Pritchett et al., 2009;
Shay et al., 2001; Sifrim and Fornari, 2008; Sifrim et
al., 2001; Smith et al., 1993; Villa and Vela, 2013).
The two tests can be performed at the same time,
which not only does not put on the patient any
additional unpleasantness associated with the same
technique but also allows to observe the recorded pH
and impedance under the same conditions and time.
An overview of the exam is shown in Figure 1.
The few existing computer programs to assist in
diagnosing reflux disease - often being added as
software to measuring devices, allow to display the
results and perform simple analysis mainly pH and
relatively rarely, impedance (Tutuian et al., 2008;
Hila et al., 2007). Admittedly, this may affect the
reduction of the analysis time, but the data provided
by the software is not free from interpretation errors
of algorithms, which’s task is to search and
determine reflux episodes. Thus, there is a need to
develop such algorithms to support the analysis of
pH - impedance, with the help of which the
detection of reflux episodes is not only faster, but
more reliable. Moreover, the developed algorithms
can be applied in a variety of support systems
helpful in diagnostics of the upper gastrointestinal
tract, without the need to adapt them to the
specificities of the software environment, which will
highlight their use and application (e.g. after light
modifications they can be used to study diseases of
the upper digestive tract of animals).
SIGMAP2014-InternationalConferenceonSignalProcessingandMultimediaApplications
232
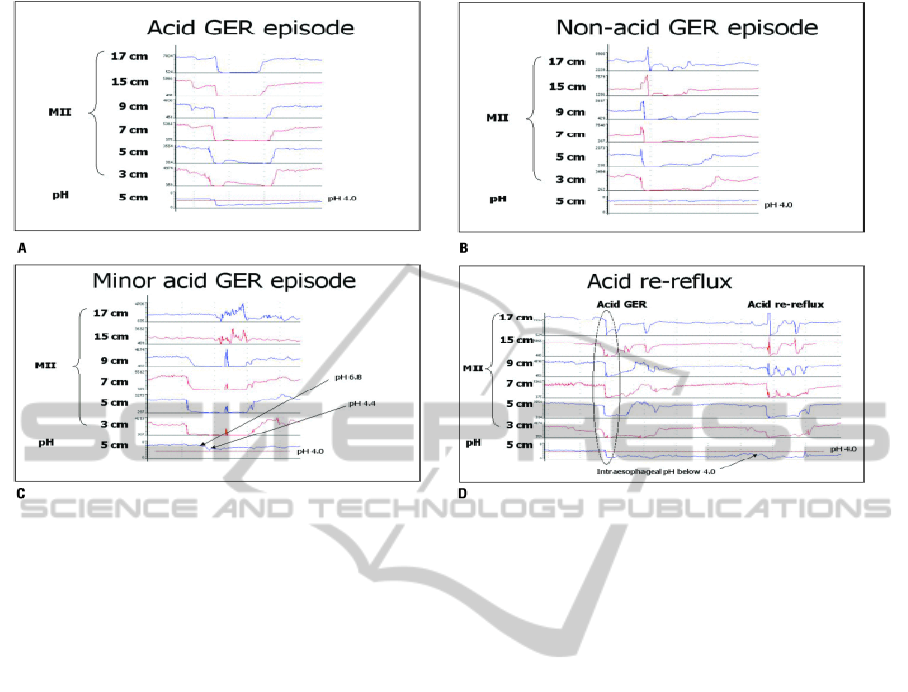
Figure 2: Types of reflux episodes (Tutuian and Castell, 2003).
2 IMPEDANCE ANALYSIS
Checking esophageal impedance changes in relation
to pH allows to specify the type of registered reflux.
Two types of reflux episodes are defined: due to the
pH of content (acid reflux, non- acid, low acid and
acid re-reflux) and due to the state of the content
aggregation (liquid, gas or mixed reflux) (Tutuian et
al., 2008; Tutuian and Castell, 2003). The
differences in the recorded impedance courses for
each type of the reflux are shown in Figure 2.
In the process of diagnosing GERD the most
important is detecting liquid and mixed reflux
episodes. The easiest to detect seem purely acidic
episodes, in which the pH drops below 4 and a
significant (over 50 %) increase in impedance values
can be observed. Similarly, in the case of non-acidic
episodes, the search includes only checking when
the impedance increases significantly, while the pH
remains above 4. It would seem that the low-acid
episodes would be more difficult to detect, in which
a significant increase of the impedance, but only a
slight drop in pH (pH of about 1) can be observed.
Due to the high degree of interference in the
measurement it can prove to be difficult to
determine the actual slight decreases in pH, which
may cause to omit them during the process of
analysis. Equally difficult to detect appears to the
reflux episode, wherein not only the registered acid
reflux episode can be observed, but also in a short
time a drop in pH accompanying an increase in the
impedance can also be seen.
The lack of clear mathematic criteria, on which it
could be possible to automate the process of
analyzing impedance results, forces the medical
diagnosticians to rely on their own experience and
subjective assessment of changes in the impedance.
However, the correct interpretation of the test results
may strongly influence the final diagnosis. It is
estimated that the specificity of the test using only
the pH results compared with the pH-impedance is
68% for pathological pH below 4, 67% for the
positive coefficient of symptoms or 58% for both
(Hila et al., 2007). Population-based studies suggest
that the same pH tests related to the assessment of
patients with gastroesophageal reflux disease
suspicion is characterized by high sensitivity but
relatively low specificity. In about 22% of cases this
can lead to a misdiagnosis, qualifying healthy
individuals as patients with GERD LPR.
3 MII-PH ANALYSIS
ALGORITHM
In light of these facts, it seems appropriate to carry
out such actions, tending not only to deepen the
knowledge in the field of signal analysis of
AnApplicationSupportingGastroesophagealMultichannelIntraluminalImpedance-pHAnalysis
233
impedance and pH but also widespread the ability to
conduct an analysis of these signals. To fulfill this
demand, a computer system supporting the
educational issues related to the analysis of pH-
impedance signals was designed and developed.
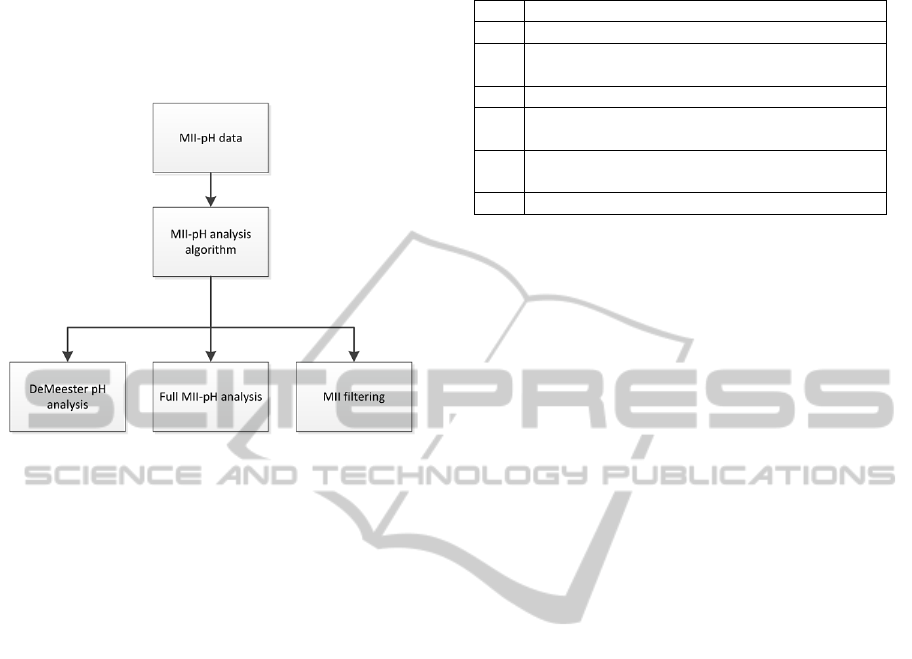
Figure 2: The developed system structure.
The system has a modular design (Figure 3),
allowing the user to use only the functions of the
program, which currently seem to be relevant for
him. The modular structure has several advantages.
The individual program modules operate in an
independent manner, based solely on data provided
by the MII-pH analysis algorithm so that it is
possible, if necessary, to add or remove modules in
the environment, in accordance with the wishes of
the user who wants to use the program for a specific
purpose. From the perspective of a programmer, the
module design allows for a transparent distribution
of the code, due to which the work on the same
program may be carried simultaneously by a number
of research teams, without the need for time-
consuming exchange of data between them.
Each uploaded course is analyzed by the MII-pH
algorithm, shown in the Figure 4. Depending on the
needs, the user has three modes to his disposal: a
simplified pH analysis, a full MII-pH analysis and
the MII filtration mode.
A simplified pH analysis is dedicated to teaching
and clinical solutions. In this situation the pH
analysis is performed by applying the most popular
scale for diagnosing GERD based on pH alone–the
DeMeester scale shown in Table 1. In this
procedure, the pH course is analyzed in reference to
a certain pH threshold, a pH value of 4. Of course
the user can set a different pH reference value, due
to his needs. In this case, the MII-pH analyzing
algorithm is used only to a limited extent.
Table 1: The DeMeester pH evaluation parameters.
no Required Parameter
1 Number of reflux episodes (pH<threshold)
2
Number of long reflux episodes, lasting more
than 5 minutes
3 Time of the longest reflux episode [min]
4
Time when pH values was under threshold in
supine position [%]
5
Time when pH value was under threshold in
upright position [%]
6 Total time when pH was under threshold [%]
As a result, the user receives complete
information about the considered pH plot, as well as
a preliminary suggestion from the analyzing
algorithm whether the plot can be classified as
normal or is it showing pathological signs.
Additionally, in a legible manner, the pH plot along
with the reference scale is shown, so that the user
can intuitively verify the automatically generated
data set based on his own experience to assess the
course. Data obtained from the program in this
module can be saved as a convenient-to-read text
file type .doc
Another application module is a full MII-pH
analysis. The user has the opportunity to explore
interesting aspects of his impedance and pH courses
having available a full range of the algorithm
parameters that set the analyzing MII-pH methods.
As a result, the algorithm identifies and selects the
type of reflux episodes: Acid, Aon-acid and Acid
Minor, according to the set analysis parameters. The
test results are displayed on relevant graphical
windows. Additionally, the user has the ability to
perform statistical analysis of the MII-pH course,
check the probabilities distribution of the
measurement results, as well as individual episodes
of reflux (eg by assigning the approximating
function the characteristic values of a single reflux
episode).
The last available module is the filtration of the
MII-pH courses. In this case the user can check the
uploaded course of the Hilbert transform,
transformation into the frequency domain or Fourier
filtering, both classical methods (filtration digital)
and wavelet filtering.
As described above, the most important part of
the program is the MII-pH analysis algorithm which
is shown in Figure 4. The initialization of the
algorithm includes initial upload: Dt - Drop
threshold, It -Increase threshold, Pht - pH threshold,
I(n) - impedance samples, pH(n) - pH samples. In
the first step, the algorithm calculates the change in
impedance between subsequent samples - I(k),
SIGMAP2014-InternationalConferenceonSignalProcessingandMultimediaApplications
234
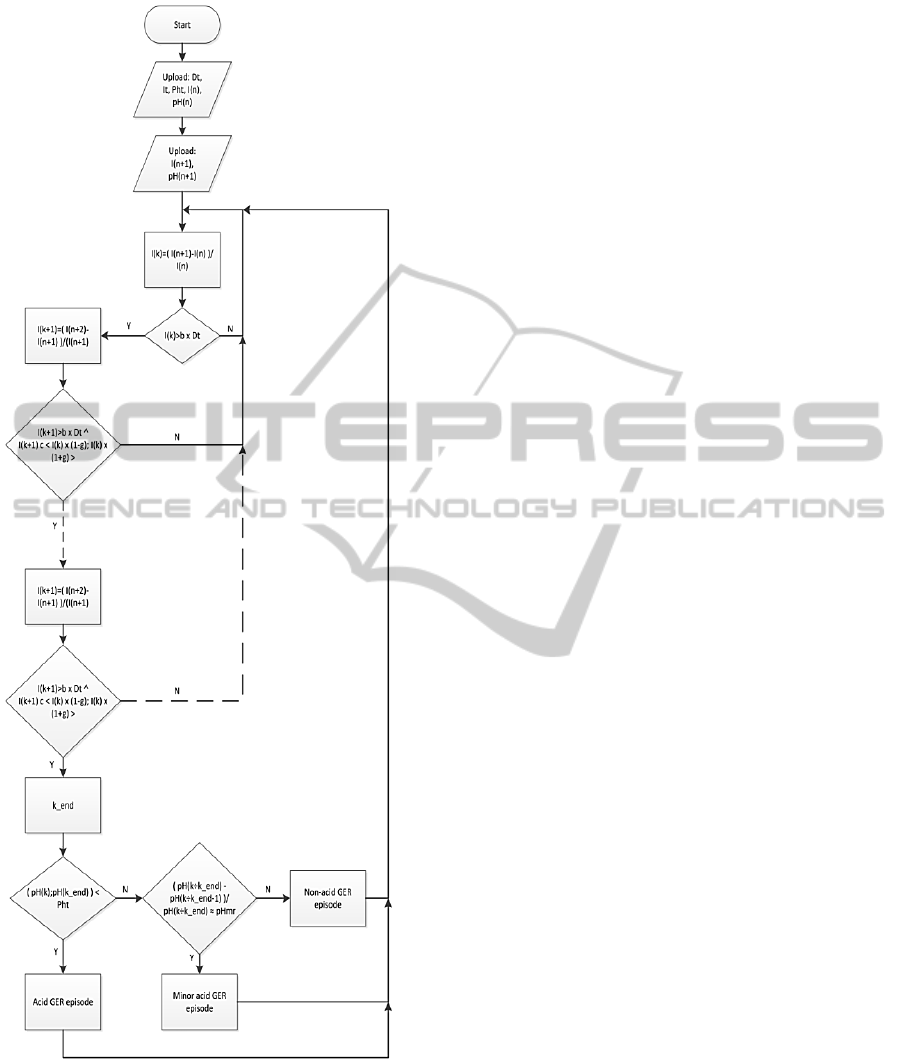
Figure 4: The algorithm simplified structure.
where k is the first sample of a series out of the
tested data. The calculated change in relation to
subsequent samples is compared with the impedance
drop threshold multiplied by a rescaling parameter b.
The b parameter specifies the percentage variation of
the set threshold. If a threshold is set, for example,
for an impedance drop at a 50% level and the b
parameter is set to a 10 % level the resulting
threshold will be counted as between 45% to 55 %.
In the case where the change parameter - I(k) is not
within the preset threshold range, the algorithm
checks another pair of impedance samples. This
situation is repeated until another pair impedances
samples meet the set condition for the threshold
impedance. In such a case, the k value is stored, the
algorithm enters the detection of the impedance drop
mode and continues the comparison. In further
comparisons the algorithm calculates not only
decreases of the impedance values pairs, but also
checks whether the calculated decrease is included
in the set between the previous I(k) value multiplied
by a scaling coefficient g. By analogy as with the b
coefficient, the user defining the g coefficient
assumes the impedance drops fluctuation rate.
The diagnosis of whether the change of
successive samples is indicative of an increase or
decrease occurs by checking the sign of the
calculated I(k). For a decrease the value is negative.
When detecting a positive change, which lasts for a
number of samples, the algorithm recognizes
increase and a recovery from a reflux episode. In
this case, the Dt parameter is replaced by the It
parameter.
The algorithm computes the time of detection,
the lack of inheritance and the end of growth.
Consecutive samples, ranging from k until the last
sample k_end which was marked as participating in
the episode of reflux, are described as a reflux
episode. In the last stage of the algorithm compares
the value of pH in the range of k to k_end.
Depending on the change in pH (below the
threshold, above the threshold, or in the range of pH
value decreased by more than 20%), the algorithm
suggests the type of reflux, forwards and forgets the
value of k to k_end the previous episode and
continues to operate after the end of the previous
episode. As a result, the algorithm generates the data
spaces are found to reflux episode. Calculated data
are forwarded in order to display the graph. The
analysis takes place in all impedance channels.
The algorithm computes till it cannot detect any
drops and when the increase period is over. The
detected samples, ranging from k until the last
sample which was marked ask_end are described as
a reflux episode. In the last stage the algorithm
compares the value of pH in the range of k to k_end
to the value selected by the user (the default value is
pH 4). Depending on the change in pH (whether it is
below the threshold, above the threshold, or in the
range when the pH value decreased by more than
AnApplicationSupportingGastroesophagealMultichannelIntraluminalImpedance-pHAnalysis
235
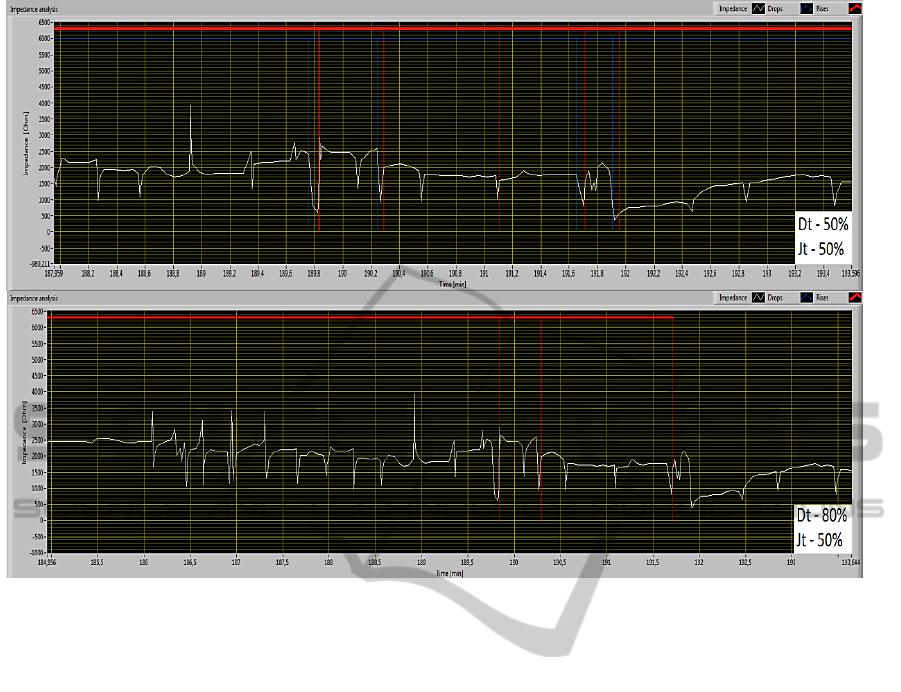
Figure 5: Marked reflux episodes drops and rises.
20%), the algorithm suggests the type of reflux,
forwards the data and forgets the value of k to
k_end. This allows the algorithm to prepare itself to
continue the search for reflux episodes, starting at
the subsequent to the k_endsampe. As a result, the
algorithm generates the data spaces in which reflux
episodes were found.The calculated data are
forwarded in order to display the graph.
4 RESULTS
Figure 5 shows an example of determination of
reflux episodes as a threshold for accepting two
different values: 50% drop and rise threshold and a
situation when the drop threshold is set to 80% and
rise threshold remained on a 50% level. The b and g
algorithm parameters were set to 90%. As can be
seen, in the case of a 50% impedance rise and drop
threshold in a predetermined time interval, the
implemented algorithm detected four short reflux
episodes. Changing the drop threshold to 80%
prevented the detection of previously observed
episodes. Instead, the implemented algorithm detects
only increases in the impedance values, which
however, are not treated as reflux episodes. In the
shown example in both cases the search algorithm
was set to search for acid reflux episodes, and thus
only when the pH value drops below 4 (e.g., in
accordance with the procedure DeMeester).
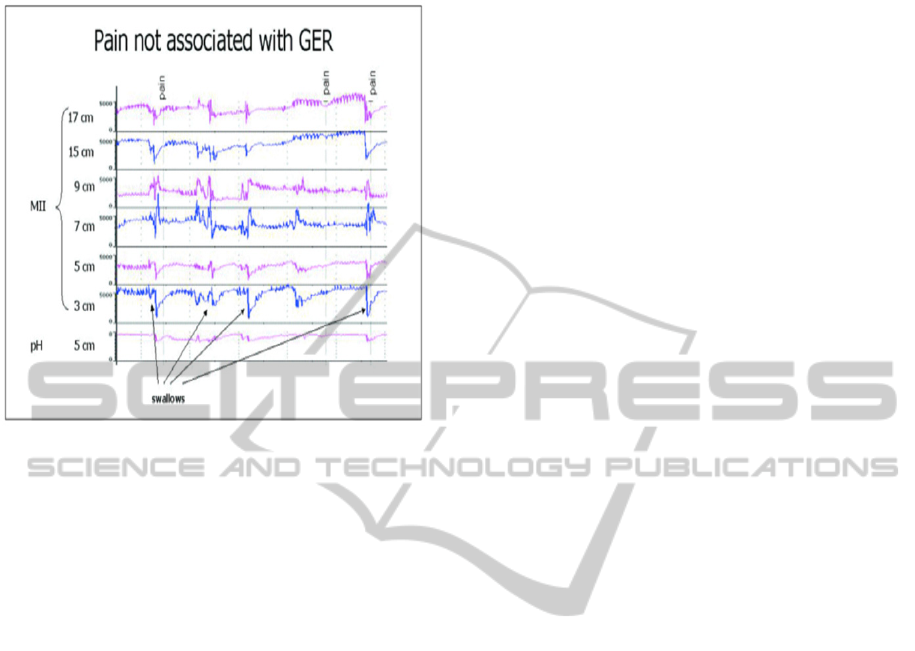
Moreover, the analysis of the pH-impedance
waveforms containing the denoted by the patient
discomfort/painmarkers may lead to the
determination of patterns of other phenomena
related to diseases of the upper gastrointestinal tract,
e.g., associated with the detection of the chest pain
cause, as one of the GERD symptoms.
In the Figure 6 a change in the impedance graph
along with a pain tag set by the patient can be seen.
In two cases, a significant decrease in esophageal
impedance, preceding the pain tag registered in all
measurement channels can be seen. Comparing this
observation with the pH reading it can be concluded
that in the short time before the patient's sensation of
pain, he experienced a minor acid reflux episode.
Using the developed environment on aappropriate
amount of data, the user is able to analyze cases of
pH and impedance decrease or increasein reference
to search for the cause of various types of pain. This
in turn can lead to successfully relate to existing or
develop new math standards and benchmarks to
assist in assessing the disease in patients and to raise
awareness of the possible causes of thoracic pain not
SIGMAP2014-InternationalConferenceonSignalProcessingandMultimediaApplications
236
related to a heart disease.
Figure 6: Pain markers in reflux episodes (Tutuian and
Castell, 2003).
Examining the other measurement channels in
the same time frame, it is also possible to evaluate to
what extent of the esophagus the reflux episode took
place. The developed system also has the ability to
mark reflux episodes. Additionally, the system
represents a selected fragment of the found episode
according to user requirement (minimal, maximum
values, beginning or end of an episode of reflux).
5 CONCLUSIONS
The available in the developed computer system
tools allow to conduct research related to finding or
modifying existing criteria for determining the types
of gastroesophageal or laryngopharyngeal reflux
episodes. Thanks to the possibility to determine a
significant amount of coefficients and thresholds
that characterize the pH and impedance analysis, the
user has a wide range of possibilities to customize
the research. Through research, experienced
physicians and researchers, may try to develop new
reference thresholds for esophageal impedance that
would prove to be helpful in a more accurate
interpretation of the medical diagnosis, relationships
between symptoms of diseases of the upper
gastrointestinal tract and the values of impedance
and pH.
Research shows that the algorithm successfully
marks acid reflux episodes, when using the standard
DeMeester evaluation parameters. It also
successfully enables the user to implement his own
algorithm parameters, which in turn leads to
establishing new conclusions regarding certain types
of parameter values. It is particularly important since
no such algorithms are available to use by research
interested in improving their functioning. The
programs that are used to evaluate MII-pH do not
allow access to their computational methods. With
the developed system researchers have the unique
opportunity not only to use a tool ready for clinical
use, but also to undergo research on their own, with
the use of the algorithm. This, in turn, can allow to
find new approaches to MII-pH data analysis in
which previously omitted details will prove
diagnostically important.
Further research aims at the extension of pH and
impedance analysis capabilities by improving
filtration of the waveforms using wavelet
transforms. This will enable the possibility to
compare the analysis results both in the original and
filtered data, which in turn may lead to new
discoveries in the regarded field.
REFERENCES
Hila, A., Agrawal, A., Castell, D. O., 2007. Combined
Multichannel Intraluminal Impedance and pH
Esophageal Testing Compared to pH Alone for
Diagnosing Both Acid and Weakly. Clinical
Gastroenterology and Hepatology, 5, 172–177.
doi:10.1016/j.cgh.2006.11.015
Kahrilas, P. J., 2001. Will impedence testing rewrite the
book on GERD? Gastroenterology, 120(7), 1862–
1864.
Lazarescu, A., Sifrim, D., 2008. Ambulatory Monitoring
of GERD: Current Technology. Gastroenterology
Clinics of North America, 37(4), 793–805.
Porro, G., 2003. Gastroenterologia i hepatologia (pp.
125–140). Lublin: Czelej.
Pritchett, J. M., Aslam, M., Slaughter, J. C., Ness, R. M.,
Garrett, C. G., Vaezi, M. F., 2009. Efficacy of
Esophageal Impedance/pH Monitoring in Patients
With Refractory Gastroesophageal Reflux Disease, on
and off Therapy. Clinical Gastroenterology and
Hepatology, 7(7), 742–748.
Segal, I., Pitchumoni, C. S., Sung, J., 2011.
Gastroenterology and hepatology manual : a
clinician’s guide to a global phenomenon (p. 27).
McGraw Hill.
Shay, S. S., Bomeli, S., Richter, J. E., 2001. Reflux event
(RE) clearing: Multichannel intraluminal impedance
(MII) compared to pH probe and manometry in fasting
severe GERD patients. Gastroenterology, 120(5),
A431.
AnApplicationSupportingGastroesophagealMultichannelIntraluminalImpedance-pHAnalysis
237

Sifrim, D., Fornari, F., 2008. Esophageal impedance-pH
monitoring. Digestive and Liver Disease, 40, 161–166.
Sifrim, D., Holloway, R., Silny, J., Xin, Z., Tack, J., Lerut,
A., Janssens, J., 2001. Acid, nonacid, and gas reflux in
patients with gastroesophageal reflux disease during
ambulatory 24-hour pH-impedance recordings.
Gastroenterology, 120(7), 1588–1598.
Smith, H. L., Hollins, G. W., Booth, I. W., 1993.
Epigastric impedance recording for measuring gastric
emptying in children: how useful is it? Journal of
Pediatric Gastroenterology and Nutrition, 17(2), 201–
206.
Tutuian, R., Castell, D. O., 2003. Use of multichannel
intraluminal impedance (MII) in evaluating patients
with esophageal diseases. Part III: Combined MII and
pH (MII-pH). Practical Gastroenterology, 27(3), 19–
28.
Tutuian, R., Vela, M. F., Hill, E., Mainie, I., Agrawal, A.,
Castell, D., 2008. Characteristics of Symptomatic
Reflux Episodes on Acid Suppressive Therapy. The
American Journal of Gastroenterology, 103(5), 1090–
1096.
Villa, N., Vela, M. F., 2013. Impedance-pH Testing.
Gastroenterology Clinics of North America, 42(1),
17–26.
Yamada, T., 2006a. Podrecznik gastroenterologii (p. 249).
Lublin: Czelej.
Yamada, T., (2006b. Postepy w gastroenterologii (p. 90).
Lublin: Czelej.
SIGMAP2014-InternationalConferenceonSignalProcessingandMultimediaApplications
238
