
Three-stage Unstructured Filter for Removing Mixed Gaussian plus
Random Impulse Noise
Fitri Utaminingrum
1,2
, Keiichi Uchimura
1
and Gou Koutaki
3
1
Computer Science and Electrical Engineering, Graduate School of Science and Technology,
Kumamoto University, 2-39-1 Kurokami, Chuo-ku, 860-8555 Kumamoto, Japan
2
Brawijaya University, Information Technology and Computer Science Programs,
Jl. Veteran No.8 Malang, 65145 East Java, Indonesia
3
Priority Organization for Innovation and Excellence, Kumamoto University,
2-39-1 Kurokami, Chuo-ku, 860-8555 Kumamoto, Japan
Keywords:
K-SVD Method, Noise Removal, Mixed Noise.
Abstract:
Digital image processing is often contaminated by more than one type of noise, such as mixed noise. In this
paper, we propose a three-stage process to develop K-SVD method not only for reducing Gaussian noise but
also for mixed Gaussian and impulse noise with optimizing input system and preserving edge structure. A
three-stage process is combining of impulse noise removal, edge reconstruction and image smoothing. Press-
ing of an impulse noise in the early stages by Decision Based Algorithm (DBA) and repairing edge structure
by an edge-map are able to optimize the performance of the K-SVD method for smoothing an image. The
performance of the filter is analysed in terms of Peak Signal to Noise Ratio (PSNR), Mean Structural Simi-
larity (MSSIM) index and Blind Image Quality Index (BIQI). The simulation result is obtained a significant
improvement over the previous research.
1 INTRODUCTION
The quality of an image may decrease due to distur-
bance or unwanted signals, which is called with noise.
The corrupted image with noise is one of the main
problems in the image processing and computer vi-
sion. Two common type of image noise are Gaussian
noise and Impulse noise. Contamination image with
noise makes a user difficult to recognize the original
image data. In such adverse conditions, it is needed an
implementation to restore the noisy image to become
an image that has a better quality. Noise removal is
necessary in image processing to acquire useful im-
portant information that we want (Fitri et al., 2012b).
Gaussian and impulse noises are caused by imper-
fection of camera sensors and communication chan-
nel, error in the data-acquisition system, interference
from the outside instrumentation and error in the
transmission channel, etc (Bogdan, 2010; Fitri et al.,
2012a). Several previous papers have been proposed
to suppress both of noises. Denoising method that
only used for reducing one type of noise is much eas-
ier than the mixed noise removal.
There are two cases of noise distributions for im-
pulse noise: fixed-valued impulse noise (salt-and-
pepper) and random-valued impulse noise (Wenbin,
2007). A large number of algorithms have been pro-
posed to reduce impulse noise from corrupted images.
One of the most popular method to reduce impulse
noise is median filter (Astola and Kuosmanen., 1997).
These algorithms remove the impulsive noise but they
were unable to preserve the sharpness of the edges.
Median filter performs well at low noise density, but it
fails at medium and high densities (Veerakumar et al.,
2013). Moreover, various modified median filters are
also proposed, e.g. the Vector Median Filter (VMF)
(Laskar et al., 2009) and the Spatial Median Filter
(SMF) (Church et al., 2008). Although these filters
obtain a better performance in lesser execution time,
VMF approaches still have the drawbacks like blur-
ring and low performances when the noise ratio is
high (Lezoray et al., 2008), while SMF cannot pre-
serve the original local features and maintain the edge
area. The other one is Gaussian noise removal. Addi-
tive Gaussian noise is characterized by adding a value
to each image pixel and the values obey a zero-mean
Gaussian distribution with noise variance σ (Yingyue
et al., 2013). Some researchers are often used total-
99
Utaminingrum F., Uchimura K. and Koutaki G..
Three-stage Unstructured Filter for Removing Mixed Gaussian plus Random Impulse Noise.
DOI: 10.5220/0005051400990106
In Proceedings of the 11th International Conference on Signal Processing and Multimedia Applications (SIGMAP-2014), pages 99-106
ISBN: 978-989-758-046-8
Copyright
c
2014 SCITEPRESS (Science and Technology Publications, Lda.)

variation methods to develop their research (Tony and
Ke, 2006; Chan et al., 2005). The main drawback
of the total variation methods is the texture informa-
tion over-smooth in the image (Buades et al., 2005).
Sparse land model and K-Singular Value Decomposi-
tion (K-SVD) algorithms (Michal and Michael, 2006)
are also used to reduce Gaussian noise (Michael and
Michal, 2006). K-SVD is an iterative method that al-
ternates between sparse coding of examples based on
the current dictionary and a process of updating the
dictionary atoms to better fit the data. This algorithm
is flexible and works in conjunction with any pursuit
algorithm.
Rarely, an image is only contaminated by one type
of noise (Gaussian or random impulse noise). Digi-
tal image processing is often contaminated by more
than one type of noise, such as mixed noise. Some
representative mixed noise removals are Two-phase
method (TP) (Jian et al., 2008) and Fast two-phase
image deblurring (FTPID) (Jian et al., 2010) which
can work well in the reducing Gaussian and impulse
of noise. The two-phase method uses variational
methods involving an L1 shaped data-fidelity term.
These methods can handle salt-and-pepper noise, but
not optimal for random impulse noise.
To overcome the problem of the previous meth-
ods, we propose a three-stage process to develop K-
SVD method not only for reducing Gaussian noise but
also for mixed Gaussian and impulse noise with opti-
mizing input system and preserving edge structure. A
three-stage process develops the connection between
an impulse noise removal, an edge reconstruction and
the smoothing image methods. Pressing of an impulse
noise in the early stages by Decision Based Algorithm
(DBA) and repairing edge structure by an edge-map
are able to optimize the input of the K-SVD method
for smoothing an image.
The rest of the paper is organized as follows: Sec-
tion II describes about the detailed explanation of the
proposed method, Section III shows the experimental
result of our simulation program, and Section IV is a
conclusion.
2 PROPOSED METHOD
We propose a three-stage process to remove mixed
Gaussian and impulse in the image F. The first stage
is impulse noise removal. The second stage is the re-
pairing edges region on the image. The third stage is
the smoothing image.
2.1 Impulse Noise Removal
Impulse noise removal is only applied to the pixels
that are detected as the impulse noise. The filtering
process just conducted on the noisy pixel known as a
Decision Based Algorithm (DBA).
We make an impulse noise detector which is
capable for detecting both types of impulse noise.
There are salt-and-pepper and random-valued im-
pulse noises. The impulse noise filtered image (
ˆ
X)
is obtained by placing the free impulse noise pixel
and new pixel from
ˆ
F at (i, j) position.
ˆ
F is the
average value of two free-noisy pixels that are lo-
cated around (i, j). Detection of salt-and-pepper and
random-valued impulse noise at each position (i, j) in
the corrupted image (F) is presented in Eq.(1).
ˆ
X
i j
=
{
ˆ
F
i j
if F
i j
= 0 or F
i j
= 255 or F
i j
≤ τ
L
or F
i j
≥ τ
H
F
i j
other
(1)
τ
L
and τ
H
are the minimum and maximum limits of
threshold value respectively, which is calculated by
Eqs.(2) and (3).
τ
L
= MIN(W) +
MED(W) − MIN(W)
2
(2)
τ
H
= MED(W) +
MAX(W) − MED(W)
2
(3)
where MIN, MED and MAX are operators to obtain
minimum, median and maximum value respectively.
W is the 3 × 3 sample pixel window.
Observations of two pixels are performed in the
horizontal, vertical, left and right-diagonal directions.
If the observations are not found free-noisy pixels, we
average values of two pixels
ˆ
X
i, j−1
and
ˆ
X
i−1, j
2.2 Edge Reconstruction
The edge reconstruction process is guided by an edge-
map that is obtained from the threshold results of the
edge image detection. We use two Sobel kernels to
detect the edge area from an image there are horizon-
tal (H
h
) and vertical (H
v
) derivative kernel.
The horizontal and vertical gradients of the image
intensity function can be written in Eq.(4).
G =
1
2
(
ˆ
X ∗ H
h
+
ˆ
X ∗ H
v
)
(4)
ˆ
X is an image that contains no impulse noise. ∗
denotes the 2-dimensional convolution operation.
Meanwhile, the edge-map is resulted from the
threshold that has two intensity conditions there are
bright (1) and dark (0). The threshold image result is
a binary image (
ˆ
G). The bright intensity (1) is given,
when the pixel values of G
i j
is greater than the thresh-
old (τ) and vice versa. We only repair the area that are
SIGMAP2014-InternationalConferenceonSignalProcessingandMultimediaApplications
100

detected as edges and ignores the non-edge regions.
We scan
ˆ
G by using 5 × 5 window (W
ˆ
G
). If in the
scanning process, elements of the window contain an
edge, then check the direction of an edge in the win-
dow as follows:
1 If an edge position in the W
ˆ
G
window is at the
horizontal direction, then the
ˆ
X image at the three
coordinates in the horizontal direction
ˆ
X(i, j+k) is
updated with an average of three pixels from these
direction as illustrated in Eq.(5). k=[-1,0,1].
ˆ
X(i, j +k) =
1
3
1
∑
k=−1
ˆ
X(i, j +k) (5)
2 If an edge position in the W
ˆ
G
window is at the
vertical direction, then we use Eq.(6) to repair the
edge image.
ˆ
X(i + k, j) =
1
3
1
∑
k=−1
ˆ
X(i + k, j) (6)
3 If an edge position in the W
ˆ
G
window is at
the left-diagonal direction, then the
ˆ
X(i − 1, j +
1),
ˆ
X(i, j) and
ˆ
X(i +1, j −1) are updated by using
Eq.(7).
ˆ
X(i + k, j −k) =
1
3
1
∑
k=−1
ˆ
X(i + k, j −k) (7)
4 If an edge position in the W
ˆ
G
window is at
the right-diagonal direction, then the
ˆ
X(i − 1, j −
2),
ˆ
X(i, j) end
ˆ
X(i +1, j +1) are updated by using
Eq.(8).
ˆ
X(i − k, j +k) =
1
3
1
∑
k=−1
ˆ
X(i − k, j +k) (8)
Finally, the
ˆ
X image that has been reconstructed based
on four rules symbolized by X.
2.3 Image Smoothing Based on K-SVD
K-SVD method is a combination of K-mean clus-
tering process and Singular Value Decomposition
(SVD). K-SVD is denoising method based on a sparse
representation with learning dictionary which con-
tains a prototype signal-atom (Michal and Michael,
2006). It is limited in handling small patches. In or-
der to maximize performance for K-SVD method, we
minimize an impulse noise and reconstruct the edge
area on the input part, firstly. The X is an image that
has undergone reconstruction in the early stage with
eliminating impulse noise and improving edge area.
Denoising procedure using Eq.(9) is based on dic-
tionary learned patches from the corrupted image, that
are described as follows. Input image is symbolized
by X
i j
and output image is reconstruction image (Y
i j
).
min
Y,D,α
{
λ ∥ X
i j
−Y
i j
∥ +
∑
i j
µ
i j
∥ α
i j
∥
0
+
∑
i j
∥ Dα
i j
− R
i j
Y
i j
∥
2
2
}
(9)
λ is regulation parameter, µ
i j
is a patch-specific
weight that are determined by the optimization pro-
cedure, α
i j
is a size k column vector, D is the learn
dictionary with matrix size n × k and R
i j
is a size n
column vector.
There are several parameters that are used in K-
SVD methods. These parameters are n (the block size
of image patches), k (size of dictionary), J (number
of iterations), λ (weight of the noisy image), σ (stan-
dard deviation of Gaussian noise) and C (multiplier
coefficient). We use the default parameters for de-
noising procedure that will be a good starting point
by using the original K-SVD are as follows: n=8, J=4,
k = J × n
2
, λ=
30
σ
and C=1.15.
Description of K-SVD method uses the setting pa-
rameters which are defined in Eq.(9). The detail infor-
mation about denoising procedure of K-SVD is ex-
plained in the several steps.
1. Initialization: set Y
i j
= X
i j
and D are some initial
dictionary.
2. Repeat J times
(a) Sparse Coding Stage: Use any pursuit algo-
rithm to compute the representation vectors
α
i j
for each patch R
i j
ˆ
Y
i j
. The mathematical
aproach can be formulated as follows:
∀
i j
min
α
i j
||α
i j
||
0
subject to
||Dα
i j
− R
i j
ˆ
Y ||
2
2
≤ n(Cσ)
2
(b) Dictionary Update Stage: for each column
l=1,2,...,k in D.
- Find the patches ω
l
that use in this atom
d
l
, ω
l
= {(i j)|α
i j
(l) ̸= 0}
- For each patch (i, j) ∈ ω
l
compute its repre-
sentation error
e
l
i j
= R
i j
Y
i j
−
∑
m̸=l
d
m
α
i j
(m)
- Set E
l
= (e
l
i j
)
i j∈ω
l
- Apply SVD decomposition and update d
l
and
α
i j
(l)
(i, j)∈ω
1
(c) Compute the image reconstructed: T is trans-
pose matrix and I is an identity square matrix.
Y
i j
=
λX
i j
+
∑
i j
R
T
i j
Dα
i j
λI +
∑
i j
R
T
i j
R
i j
Three-stageUnstructuredFilterforRemovingMixedGaussianplusRandomImpulseNoise
101
(a) (b)
(c) (d)
(e) (f)
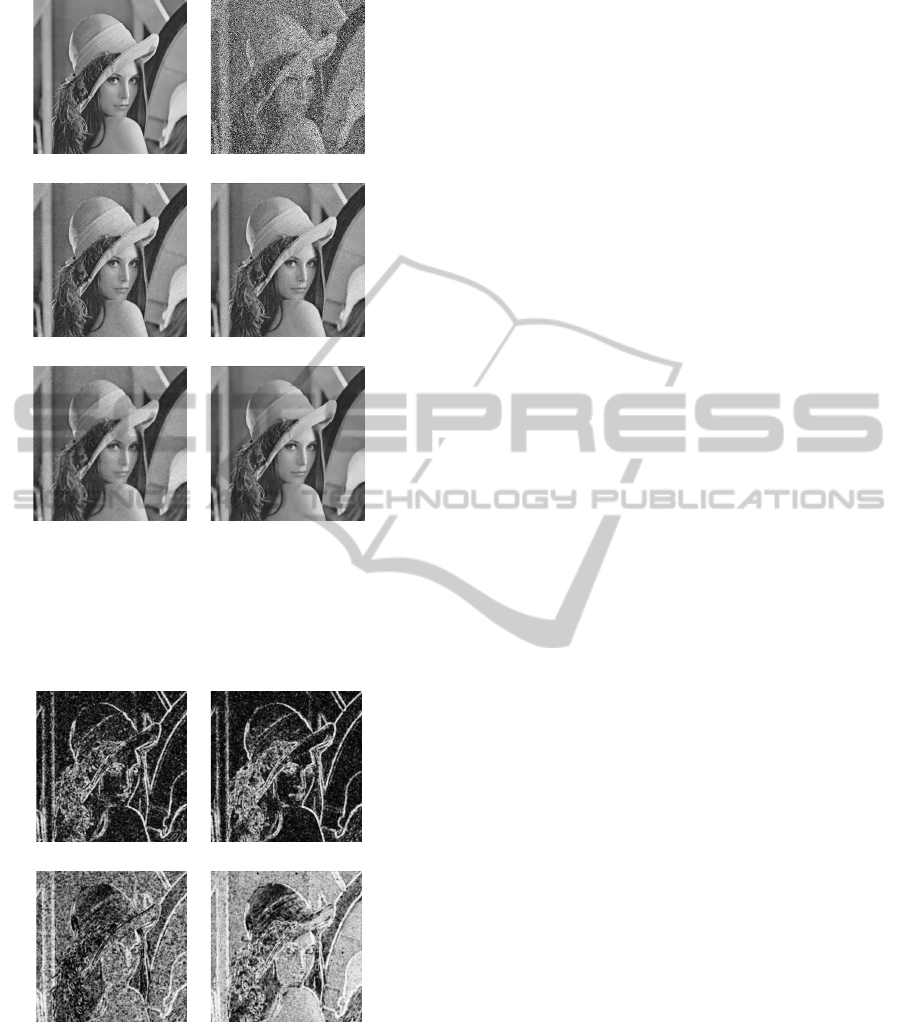
Figure 1: Denoising results of different algorithms on Lena
image corrupted by noise variance (σ=15) and impulse
noise density (p = 50%). (a) Original image, (b) Corrupted
image, (c) TP (Jian et al., 2008), (d) FTPID (Jian et al.,
2010), (e) AF, (f) Proposed Method.
(a) (b)
(c) (d)
Figure 2: SSIM-map of Fig.1. (a) TP (Jian et al., 2008), (b)
FTPID (Jian et al., 2010),(c) AF, (d) Proposed Method.
3 EXPERIMENTAL RESULT
We have tested the performance of our proposed
method on a different image sample, some of which
are Cameraman, Lena, Man and Pepper. Different
density of Gaussian noise plus random-valued im-
pulse noise has been tested in our research. We de-
note the random-valued impulse noise by p as density
level (30%, 50% and 70%) and Gaussian noise by σ
as standard deviation (5, 10 and 15). It means that
p + σ is the corrupted image by the mixed Gaussian
and impulse noise.
Simulation result is obtained from MATLAB 7.5.0
release 2007b. We use a Personal Computer (PC) that
has specification of CPU 3.3 GHz and 4GB RAM.
The performance of our proposed method is evaluated
by Qualitative and Quantitative parameters. Both pa-
rameters were used since they complement each other
for more complete analysis.
3.1 Qualitative Parameter
Qualitative parameter by visual observation is more
subjective than the quantitative parameter, where it
can be observed but not measured. We compare our
proposed method with many other well-known algo-
rithms published in the (Jian et al., 2008; Jian et al.,
2010) literatures and Adaptive Fuzzy (AF).
3.1.1 Visual Observation
The test image used for this comparison is Lena orig-
inal image (512×512) as shown in Fig.1(a), which
is corrupted by mixed Gaussian and impulse noise
(p=50% plus σ=15) as shown in Fig.1(b). Further-
more, Fig.1(c) and (d) are the filtering results of TP
and FTPID methods, respectively. The filtering result
of TP is almost similar to FTPID method. However,
FTPID method is a little smoother than TP method.
Meanwhile, the filtering result of AF method is pre-
sented in Fig.1(e). In this paper, the visual quality
filters of AF method is better than both methods. The
filtering result of the proposed method is visualized
in Fig.1(f). The proposed method is highly effective
for removing impulse noise plus Gaussian noise from
the corrupted image. By comparing TP and FTPID,
we can see clearly that the proposed method success-
fully suppresses the noise and preserves the edge de-
tails and texture very accurately.
3.1.2 The Structural Similarity-map
(SSIM-map)
In addition, we also use SSIM-map in the qualitative
evaluation. SSIM-map is a local perceptual quality in-
dicator that is used to measure the similarity between
original image and the filtering image result. If the
pixels have the similarities, it will produce high in-
SIGMAP2014-InternationalConferenceonSignalProcessingandMultimediaApplications
102

tensity and vice versa. SSIM-map results from Lena
image are presented in Fig.2.
Figures.2(a), (b), (c) and (d) are the SSIM-map
of TP, FTPID, AF and our proposed method respec-
tively. Regarding to Fig.2, the level contrasts of
SSIM-map image results from lowest to highest are
TP, FTPID, AF and our proposed method respec-
tively.
Generally, our method has more contrast than all
comparison methods that has been used in this pa-
per (TP, FTPID and AF). In this case, our proposed
method produces the highest intensity, that is related
to the condition of pixel between proposed method,
and original image that has the similarity value in ev-
ery coordinates.
3.2 Quantitative Parameter
Quantitative measurement is an important because
qualitative measurement by visual assessment of the
image is subjective. Quantitative assessment in the
numerical variable is used for measurement, compar-
ison or to track performance. They represent a mea-
surable quantity that make it easy to analysis.
Qualitative measurement involves gathering data
that is absolute, such as numerical data. In order to
provide quantitative measures on the performance of
the filtering result, we used Peak Signal-to-Noise Ra-
tio (PSNR), Mean Structural Similarity (MSSIM) in-
dex and Blind Image Quality Index (BIQI).
3.2.1 Peak Signal-to-Noise Ratio (PSNR)
The quality of the restored images is measured by
Peak Signal-to-Noise Ratio (PSNR). It uses a stan-
dard mathematical model to measure the quality im-
age. The higher PSNR value, the better quality image
and vice versa.
PSNR is usually expressed in terms of a logarith-
mic decibel (dB) scale as illustrated in Eq.(10). M is
represented as row of an image; N is a column of an
image; x
i j
is an original image and y
i j
is the filtering
result.
PSNR = 20 log
255.M.N
∑
M
j=1
∑
N
i=1
(x
i j
− y
i j
)
2
(10)
Table 1 presents the PSNR results of the three
comparative denoising algorithms on all test images.
PSNR values of the proposed method demonstrate
much better performance than TP, FTPID and AF,
when the level noise (30% ≤ p ≤ 70%) and (5 ≤ σ ≤
15)
3.2.2 Mean Structural Similarity (MSSIM)
Index
The structural similarity (SSIM) index is a method for
measuring the similarity between two images (origi-
nal image as reference image and the filtering image
results as the reconstructed image) (Zhou et al., 2004).
An image quality MSSIM index is calculated by
computing the average of SSIM value over all win-
dows as defined in Eq.(11)
MSSIM(I, F) =
1
M
M
∑
j=1
SSIM(i
j
, f
j
) (11)
I and F are reference and the filtered images, re-
spectively. The i
j
and f
j
are the image contents at the
jth local window. M is the number of local windows
of the image. We use Eq.(12) to obtain SSIM value.
SSIM(i, f ) =
(2µ
i
µ
f
+C
1
)(2σ
i f
+C
2
)
(µ
2
i
+ µ
2
f
+C
1
)(σ
2
i
+ σ
2
f
+C
2
)
(12)
µ
i
and µ
f
are the mean intensity of image i and f re-
spectively. σ
i
and σ
f
are standard deviation of image
i and f respectively. σ
i f
is covariance.
The response of MSSIM value is similar with
PSNR. MSSIM value is ranging between 0 and 1. The
higher MSSIM index value, the better quality of the
filtering image result. In this case, if the results of
MSSIM index value close to 1 indicates that the filter-
ing image result almost similar with original image.
The MSSIM index result in the several methods
are presented in Table 2. Referring to Table 2, the
proposed method has a highest value than TP, FTPID
and AF methods. The MSSIM index value of the pro-
posed method is close to one. It means, the quality
filter of the proposed method is better than all com-
parison methods.
3.2.3 Blind Image Quality Index (BIQI)
In another hand, we also use BIQI (Blind Image Qual-
ity Index) to evaluate on the quality image assessment
by using distortion-specific image quality measure as
well as a distortion-type classifier. It is obvious that
BIQI performs well in terms of correlation with hu-
man perception, and it is competitive with that of full-
reference PSNR across distortion types and the data-
base. (Anush and Alan, 2010).
Blind image quality index is calculated by using
Eq.(13)
(BIQI) = Σ
m
i=n
p
i
q
i
(13)
p
i
is the probability of each distortions in the image
and q
i
the quality score corresponding to the distor-
tions (Anna et al., ).
Three-stageUnstructuredFilterforRemovingMixedGaussianplusRandomImpulseNoise
103

Table 1: Comparison result of PSNR value.
Images
σ = 5 σ = 10 σ = 15
p (%)
Methods Methods Methods
TP FTPID AF Proposed TP FTPID AF Proposed TP FTPID AF Proposed
Cameraman
30
29.31 29.90 29.93 31.49 26.70 27.71 29.49 30.58 25.65 26.10 28.88 29.58
Lena 33.08 34.15 31.09 34.19 30.66 31.33 30.55 32.49 29.12 29.67 29.88 31.39
Man 31.98 33.06 34.24 34.82 29.80 30.35 32.55 32.73 28.57 28.29 30.66 31.28
Pepper 32.68 33.87 35.28 37.15 30.64 31.66 33.44 35.19 29.63 30.25 31.19 33.42
Cameraman
50
26.92 27.40 29.04 30.10 25.45 25.99 28.61 29.37 24.10 24.69 27.99 28.69
Lena 31.40 32.30 30.46 32.54 29.23 29.88 29.91 31.29 27.93 28.42 29.19 30.32
Man 30.91 31.08 32.78 33.15 28.74 29.21 31.32 31.49 27.64 28.01 29.58 30.16
Pepper 30.96 31.83 33.72 35.48 29.37 30.24 32.15 34.09 28.22 28.85 30.12 32.49
Cameraman
70
24.69 24.67 27.37 27.57 23.35 23.45 26.98 27.24 22.41 22.67 26.39 26.79
Lena 29.56 29.73 29.09 30.07 27.75 28.11 28.59 29.46 25.87 26.48 27.89 28.87
Man 29.56 29.73 30.32 30.50 27.38 27.64 29.29 29.50 26.27 26.57 27.95 28.58
Pepper 29.35 29.58 31.18 32.67 27.83 28.43 30.03 31.70 26.82 27.07 28.45 30.53
Table 2: Comparison result of MSSIM index value.
Images
σ = 5 σ = 10 σ = 15
p (%)
Methods Methods Methods
TP FTPID AF Proposed TP FTPID AF Proposed TP FTPID AF Proposed
Cameraman
30
0.81 0.83 0.95 0.97 0.58 0.60 0.87 0.93 0.42 0.44 0.87 0.90
Lena 0.82 0.85 0.87 0.92 0.62 0.65 0.84 0.88 0.46 0.49 0.81 0.85
Man 0.84 0.86 0.94 0.96 0.63 0.66 0.88 0.92 0.47 0.50 0.80 0.88
Pepper 0.81 0.83 0.95 0.97 0.56 0.58 0.87 0.95 0.38 0.41 0.78 0.94
Cameraman
50
0.79 0.85 0.94 0.96 0.56 0.64 0.85 0.92 0.42 0.49 0.84 0.88
Lena 0.78 0.84 0.85 0.90 0.59 0.67 0.83 0.86 0.44 0.53 0.79 0.83
Man 0.80 0.87 0.92 0.94 0.61 0.69 0.86 0.90 0.46 0.54 0.77 0.86
Pepper 0.80 0.86 0.94 0.96 0.55 0.64 0.86 0.95 0.38 0.47 0.75 0.93
Cameraman
70
0.74 0.87 0.91 0.93 0.52 0.69 0.83 0.90 0.38 0.55 0.81 0.86
Lena 0.70 0.83 0.83 0.86 0.53 0.70 0.80 0.83 0.40 0.58 0.75 0.80
Man 0.73 0.86 0.89 0.90 0.55 0.73 0.82 0.86 0.41 0.60 0.73 0.83
Pepper 0.76 0.89 0.93 0.95 0.53 0.72 0.84 0.93 0.37 0.56 0.73 0.91
SIGMAP2014-InternationalConferenceonSignalProcessingandMultimediaApplications
104

Table 3: The quality score of the filtering image result.
Images
σ = 5 σ = 10 σ = 15
p (%)
Methods Methods Methods
TP FTPID AF Proposed TP FTPID AF Proposed TP FTPID AF Proposed
Cameraman
30
38.92 41.65 36.64 35.79 53.60 55.94 52.52 40.38 56.22 56.74 53.08 42.67
Lena 34.56 35.95 38.86 31.05 49.02 49.44 47.91 35.33 54.13 54.53 54.43 34.89
Man 41.05 37.40 40.72 40.45 52.22 54.65 53.14 38.72 55.16 56.40 54.47 39.83
Pepper 57.86 59.13 55.78 40.41 64.49 67.66 65.43 44.79 65.32 66.91 66.40 45.67
Cameraman
50
34.57 35.89 43.43 35.36 47.30 53.64 47.21 41.87 52.92 56.34 51.43 44.47
Lena 30.20 31.96 31.23 31.92 45.32 46.77 45.38 36.53 51.58 52.82 52.75 35.53
Man 40.07 47.17 44.07 39.75 52.46 61.36 57.04 39.01 54.01 60.75 60.69 40.98
Pepper 64.27 66.18 59.36 40.56 65.27 67.24 66.61 44.82 67.90 67.79 66.92 45.90
Cameraman
70
27.34 40.25 42.83 34.49 46.79 50.71 46.67 42.87 44.74 55.60 52.92 44.74
Lena 31.50 37.33 40.44 35.56 40.41 45.53 47.72 38.82 46.65 55.59 55.91 37.34
Man 34.82 43.63 44.81 40.36 46.63 54.69 55.53 40.20 56.15 58.21 57.21 43.09
Pepper 44.39 50.94 46.44 38.82 66.68 68.33 65.72 44.72 67.94 69.28 67.07 46.70
A quality score of the filtering image result is pre-
sented in Table 3. The score typically has a value be-
tween 0 and 100. In this case, 0 represents the best
quality and, 100 as the worst.
Referring to Table 3, the quality of the proposed
method in some experiments data has a lowest value
than TP, FTPID and AF as the comparison methods.
However, in the small variance noise, the proposed
method is not always obtained the lowest BIQI value.
In this case, the smallest BIQI value was obtained
in the FTPID or TP methods in condition (σ=5 and
p=30%, 50% and 70%).
The lowest value indicates the better quality of the
filtering result. Even though the final BIQI value of
the proposed method was not close to zero, that result
is enough to consider that noise was reduced.
4 CONCLUSION
A three-stage process method that develops the con-
nection between an impulse noise removal, an edge
reconstruction and the smoothing image methods for
reducing the mixed Gaussian plus random impulse
noise in the corrupted image is proposed. Pressing
of an impulse noise in the early stages by Decision
Based Algorithms (DBA) and repairing edge structure
by an edge-map are able to optimize the performance
of the K-SVD method for smoothing an image.
The qualitative parameters show that our proposed
method cannot only remove most of the mixed noise,
but also preserve the edge details, smooth quality and
maintain textures of an image. Our simulation result
is obtained a significant improvement over the pre-
vious research. The proposed method is capable of
overcoming the drawback of previous studies and pro-
vides a satisfactory result.
For future work, we will give an attention on the
computing time process. Hence, the next method not
only optimal to reduce the mixed Gaussian plus im-
pulse noise in many variation density, but also pro-
duces a faster computational time process in several
noise densities.
ACKNOWLEDGEMENTS
The work of the first author is supported by Direc-
torate of Higher Education (DGHE) of Indonesia and
Brawijaya University, Indonesia.
Three-stageUnstructuredFilterforRemovingMixedGaussianplusRandomImpulseNoise
105

REFERENCES
Anna, G., George, and Kethsy, P., T. .
Anush, K. and Alan, C. (2010). A two-step framework for
constructing blind image quality indices. Int.J IEEE
Signal Processing Letters, 17(5):513–516.
Astola, J. and Kuosmanen., P. (1997). Fundamental of non-
linear digital filtering. CRC Press, Boca Raton, FL.
United States of America.
Bogdan, S. (2010). Peer group switching filter for impulse
noise reduction in color images. Int. J. Pattern Recog-
nition Letters, 133:484–495.
Buades, A., Coll, B., and Morel, J. (2005). A review of
image denoising algorithms with a new one. Multi-
scale Modelling Simulation, 4:490–530.
Chan, T., Esedoglu, S., Park, F., and Yip, M. (2005). Re-
cent developments in total variation image restoration.
Mathematical Models of Computer Vision.
Church, J., Yixin, C., and Rice, S. (2008). A spatial me-
dian filter for noise removal in digital images. IEEE
Southeastcon, pages 618–623.
Fitri, U., Keichi, U., and Gou, K. (2012a). High density
impulse noise removal by fuzzy mean linear alias-
ing window kernel. IEEE International Conference
Signal Processing Communication and Computing,
pages 711–716.
Fitri, U., Keichi, U., and Gou, K. (2012b). Optimization
gaussian noise removal using hybrid filter based on
mean impulse fuzzy and fuzzy aliasing filter meth-
ods. IEEJ Transactions on Electronics, Information
and Systems, 133(1):150–158.
Jian, F., Raymond, H., and Mila, N. (2008). Two-phase
methods for deblurring images corrupted by impulse
plus gaussian noise. Inverse Problem Imaging, pages
187–204.
Jian, F., Raymond, H., and Mila, N. (2010). Fast two-
phase image deblurring under impulse noise. Journal
of Mathematical Imaging and Vision, 36:46–53.
Laskar, R., Bhowmicks.B., Biswas.R., and Kar, S. (2009).
Removal of impulse noise from color image. IEEE
Region 10 TENCON, pages 1–5.
Lezoray, O., Ta, V., and Elmoataz, A. (2008). Impulse noise
spectral clustering and regulation on graph. IEEE In-
ternational Conference on Pattern Recognition, pages
1–4.
Michael, E. and Michal, A. (2006). Image denois-
ing via sparse and redundant representations over
learned dictionaries. IEEE Transactions on Image
ProcessingIEEE Transactions on Image Processing,
15(12):3736–3745.
Michal, A. and Michael, E. (2006). Alfred,b.:k-svd an al-
gorithm for denoising overcomplete dictionaries for
sparse representation. IEEE Transactions on Image
Processing, 54(11):4311–4322.
Tony, F. and Ke, C. (2006). An optimization-based mul-
tilevel algorithm for total variation image denoising.
SIAM Journal of Multi scale Modelling and Simula-
tion, 5:615–645.
Veerakumar, T., Esakkirajan, S., and Ila., V. (2013). Edge
preserving adaptive anisotropic diffusion filter ap-
proach for the suppression of impulse noise in images.
In Press Int. J. Electron. Commun. (AEU).
Wenbin, L. (2007). An efficient algorithm for the removal of
impulse noise from corrupted images. Int. J. Electron.
Commun. (AEU), 61:551–555.
Yingyue, Z., Zhongfu, Y., and Yao, X. (2013). A restoration
algorithm for images contaminated by mixed gaussian
plus random-valued impulse noise. Int.J. Vis Com-
mun. Image Representation, 24:283–294.
Zhou, W., Bovik, A.C Sheikh, H., and Simoncelli, E.
(2004). Image quality assessment: From error mea-
surement to structural similarity. Int.J IEEE Image
Processing, 13:600–612.
SIGMAP2014-InternationalConferenceonSignalProcessingandMultimediaApplications
106
