
A Noise Resilient and Non-parametric Graph-based Classifier
Mahdi Mohammadi
1
, Saeed Adel Mehraban
2
, Elnaz Bigdeli
1
, Bijan Raahemi
1
and Ahmad Akbari
2
1
University of Ottawa, 55 Laurier Ave, E., Ottawa, ON, K1N 6N5, Canada
2
Iran University of science and technology, Computer Engineering Department, Tehran, Iran
Keywords: Graph-based Classifier, Noisy Samples, Relational Data.
Abstract: In this paper, we propose a non-parametric and noise resilient graph-based classification algorithm. In
designing the proposed method, we represent each class of dataset as a set of sub-graphs. The main part of
the training phase is how to build the classification graph based on the non-parametric k-associated optimal
graph algorithm which is an extension of the parametric k-associated graph algorithm. In this paper, we
propose a new extension and modification of the training phase of the k-associated optimal graph algorithm.
We compare the modified version of the k-associated optimal graph (MKAOG) algorithm with the original
k-associated optimal graph algorithm (KAOG). The experimental results demonstrate superior performance
of our proposed method in the presence of different levels of noise on various datasets from the UCI
repository.
1 INTRODUCTION
Graph structure has been used in machine learning
to deal with different tasks such as clustering,
classification and feature reduction (Belkin 2003,
Vathy 2009, Dhanjala 2014). Graph representation
has some specific characteristics. It can present the
topological structure of the data. It can also propose
a hierarchical structure by presenting a graph as a set
of sub-graphs and it presents an arbitrary shape for a
class or a cluster. This is why the graph structure has
attracted a lot of attention in machine learning.
Perhaps, graph clustering is the most important
application of graph structure as it is able to extract
the arbitrary and unknown shape of clusters
(Dhanjala 2014, Jun 2014). Semi supervised
learning is another application of graph structure
(Zhu 2008, Chen 2009) in which only a small
portion of the data is labeled. Based on the labeled
data, a graph-based classifier is trained and then it
predicts the label of unlabeled part of the data. The
newly labeled data now can be added to the former
labeled data to retrain the classifier and improve the
model accuracy. Classification is another application
of graph structure which has not been receiving
much attention in comparison with graph clustering
and semi supervised learning. The graph
classification problem can be discussed in two
different ways. The first one is about learning to
classify separate, individual graphs in a graph
database into two or more categories (Ketkar 2009).
The other application is how to represent a vector
dataset as a set of sub-graphs, each of which
illustrates a class of training dataset. In other words,
a graph-based classifier consists of some sub-graphs
representing the training dataset.
A number of algorithms have been introduced
for building the set of sub-graphs for an input
training dataset (Bertini Jr. et al 2011, Chatterjee
2012, Marios 2011). In this paper, we focus on the
later application of graph classification for machine
learning.
In (Bertini Jr. et al 2011), the authors propose a
classifier based on K-associated graph which
presents each class of data as a set of sub-graphs
(components). Their proposed method is a non-
parametric algorithm contrasting to K-nearest
neighbor classifier, no need for model selection,
does not consider relational data and neither makes
use of graph kernel nor Laplacian. They also
introduced a new concept, called purity, which
measures the connectivity level of samples in each
component. The output of the proposed method is K-
Associated Optimal Graph (KAOG), based on K-
associated graph algorithm (KAG). The detail of the
K-Associated Optimal Graph and K-associated
graph algorithms is presented in sections 2.1 and 2.2.
In this research, we modify the training phase of the
170
Mohammadi M., Adel Mehraban S., Bigdeli E., Raahemi B. and Akbari A..
A Noise Resilient and Non-parametric Graph-based Classifier.
DOI: 10.5220/0005051801700175
In Proceedings of the International Conference on Knowledge Discovery and Information Retrieval (KDIR-2014), pages 170-175
ISBN: 978-989-758-048-2
Copyright
c
2014 SCITEPRESS (Science and Technology Publications, Lda.)

KAOG algorithm, and propose a modified graph-
based classifier which is more noise resilient than
the KAOG.
The rest of the paper is organized as follows: in
the next section, we present an overview on graph-
based classifiers and relational data followed by
explaining the KAOG algorithm. In section 3, we
introduce the proposed algorithm. Section 4, is the
experimental results and finally the last section is the
conclusion.
2 GRAPH CLASSIFICATION AND
RELATIONAL DATA
The problem of graph classification was first studied
by (
Gonzalez 2002) as a greedy method for finding a
sub-graph. In (Deshpande 2005), the authors resented
a graph classification algorithm that uses frequent
sub-graph discovery algorithms to find all
topological substructures in the dataset. By using
highly efficient frequent sub-graph discovery
algorithms, they reduced the computational
complexity of the proposed algorithm based on
which they were able to select the most
discriminative sub-graph candidate to improve the
accuracy of the classifier. Chatterjee and Raghavan
in (
Chatterjee 2012) proposed a data transformation
algorithm to improve the accuracy of two classifiers
(LD and SVM). First, they employed a similarity
graph neighbourhoods (SGN) in the training feature
subspace and mapped the input dataset by
determining displacements for each entity and then
trained a classifier on the transferred data. On the
other hand, there are some applications which use
the graph structure directly as a classifier (Bertini Jr.
et al 2011
).
In this paper, we combine the idea of relational
data and graph classification to improve the
accuracy of the KAOG classifier in the presence of
noise. Since we compare the proposed method with
KAOG algorithm, in the next sub-section, we
explain the main concept and functionality of the
KAOG algorithm. The main core of the KOAG
algorithm is K-associated graph (KAG) which builds
a graph for an input parameter K. KAG is explained
in the following section.
2.1 Constructing the K-associated
Graph (KAG)
The following (Algorithm 1) illustrates the K-
associated graph construction phase in which a
graph is built based on a fix value of K.
Algorithm 1. Constructing the K-associated graph
from a data set (Bertini Jr. et al 2011)
Input: A constant K and a data set X = {(x1, c1), . . .
, (xi, ci), . . . , (xN,cN)}
Symbols: D
vi ;K
is the label-dependent K-
neighborhood set of vertex v
i
findComponents( ) is a function that returns the
components of a giving graph;
purity( ) is a function that calculates the purity
measure;
1: ←∅
2:
←∅
3: for all
do
4: ∆
,
←
|
Λ
,
5: ← ∪
Δ
,
6: end for
7: ← ,
8: for all
do
9:
←
10:
←
∪
`,`
;∅
11: end for
12: Output: The K-associated graph
,…,
,…,
where component
`
`,`
;
and
represents the purity of
The input of the KAG training phase is a
constant value K and the training dataset X, in which
x
i
shows the i
th
sample of the training set and c
i
shows the corresponding label.
Basically, the KAOG algorithm consists of three
main parts. In the first part, for each vertex v
i
, based
on the input K, the k nearest neighbours of v
i
is
calculated (Λ
,
). In the next step, from Λ
,
, the
samples which have the same label as v
i
are selected
as Δ
,
Based on the∆
,
, some edges are built, starting
at v
i
and ending at ∆
,
members.
In the next step, the findcomponent(V,E)
function is responsible for finding the components
(sub-graphs) which are built in previous step. Each
component consists of some samples from the same
class which form a component. Each class may have
some components which are not connected to each
other. In this function, V is the vertices of the graph
and E is the edges that are generated in previous
step.
In last step, based on Equations (1) and (2) the
purity measure for each component is calculated.
The purity measure illustrates how members of a
component are well connected to each other.
1
(1)
ANoiseResilientandNon-parametricGraph-basedClassifier
171

In this equation C
α
shows a component, v
i
is a
vertex which belongs to C
α
, d
i
in
shows the number of
edges in C
α
which start from v
i
(in degree), d
i
out
is the
number of edges in C
α
which end to v
i
(out degree)
and N
α
is the number of vertices in C
α
. D
α
shows the
average degree for C
α
and more value shows the
more number of connections and edges in the
component. Based on D
α
, the purity measure is
calculated. Equation (2) illustrates the calculation of
the purity measure for the current component.
2
(2)
The maximum value for
is one and the minimum
value is zero. The value one shows that the
component is fully connected and all the vertices are
connected to each other. On the other side, the value
zero shows a distinct vertex which is not connected
to any other vertices. The more value of
, the
better and more well-connected component.
As K is the input parameter of KAG algorithm,
the KAG is a parametric algorithm. In the next
section, the K-associated optimal graph (KAOG)
algorithm is described. KAOG is a non-parametric
algorithm.
2.2 Constructing the K-associated
Optimal Graph -KAOG
KAG algorithm constructs a K-associated graph,
based on a given input K consisting of some sub-
graphs called components. The components
constructed using a specific value of K can be
different from the ones built by another value of K.
As the components play a key role in classification
task, the accuracy and the performance of the
classification task may different.
KAOG starts building the components based on
the value of K=1 and increase the value of K for the
components as long as the increment causes a better
value for purity. Algorithm (2) shows the process in
details.
Algorithm 2. Constructing the K-associated
optimal graph from a data set (
Bertini Jr. et al 2011)
Input: Data set X = {(x1, c1), . . . , (xi, ci), . . . ,
(x
N
,c
N
)}
Symbols: Kac( ) function that creates the K-
associated graph (Algorithm 1)
1: ←1
2:
←,
3: repeat
4:
lastAvgDegre ←
5: ← 1
6:
←,
7: for all
⊂
do
8: if(Φ
β
(K)
≥ Φ
α
(opt)
) for all C
α
(opt)
⊆ Φ
α
(opt)
then
9:
←
∪
⊆
10:
←
∪
11: end if
12: end for
11: until
/
12: Output: The K-associated optimal graph
,…,
,…,
where
component
`
`,`
;
,
The only input for KAOG is the dataset and the
output is the optimal graph consisting of a number of
components (C
α
(opt)
). Each component is a sub-graph
built based on a value of K. This means that
different components may have different values of
K. The KAOG algorithm is described in (Bertini Jr.
et al
2011) with more details. In our work, we
modified the training phase and proposed Modified
K-Association Optimal Graph (MKAOG). The next
section presents the modified training phase in
details.
3 THE PROPOSED
GRAPH-BASED CLASSIFIER
The basis of the proposed method lies on
representing the training set as a graph which
consists of a number of components (sub-graphs).
Each component is formed based on a subset of
samples which are in the same class. In this section,
we describe the modification applied on the original
KAOG method to propose a new version of KAOG
algorithm in the training phase, followed by a
description of how the proposed classifier copes
with the labelling process. Like any graph
classification methods, MKAOG has two phases,
building the graph based on the training samples
(lies on KAOG) and assigning a label to each test
sample.
3.1 The Modified Training Phase
of KAOG (MKAOG)
Algorithm 2 starts with K=1 for all components. By
increasing the value of K, some components are
merged together generating a new component with a
higher value of K. There is a condition based on
which the new component is built by combining the
old ones. The condition is explained in Algorithm 2,
line 8, indicating that by adding the value of K,
KDIR2014-InternationalConferenceonKnowledgeDiscoveryandInformationRetrieval
172
some components from the same class tent to merge
into a larger component. The newly built component
has a new purity measure. If the purity of the new
component is greater or equal to the purity of each
component combined (which are now subset of the
new component), then the old components can
merge together. Otherwise the merging does not
proceed. This condition cannot be satisfied in many
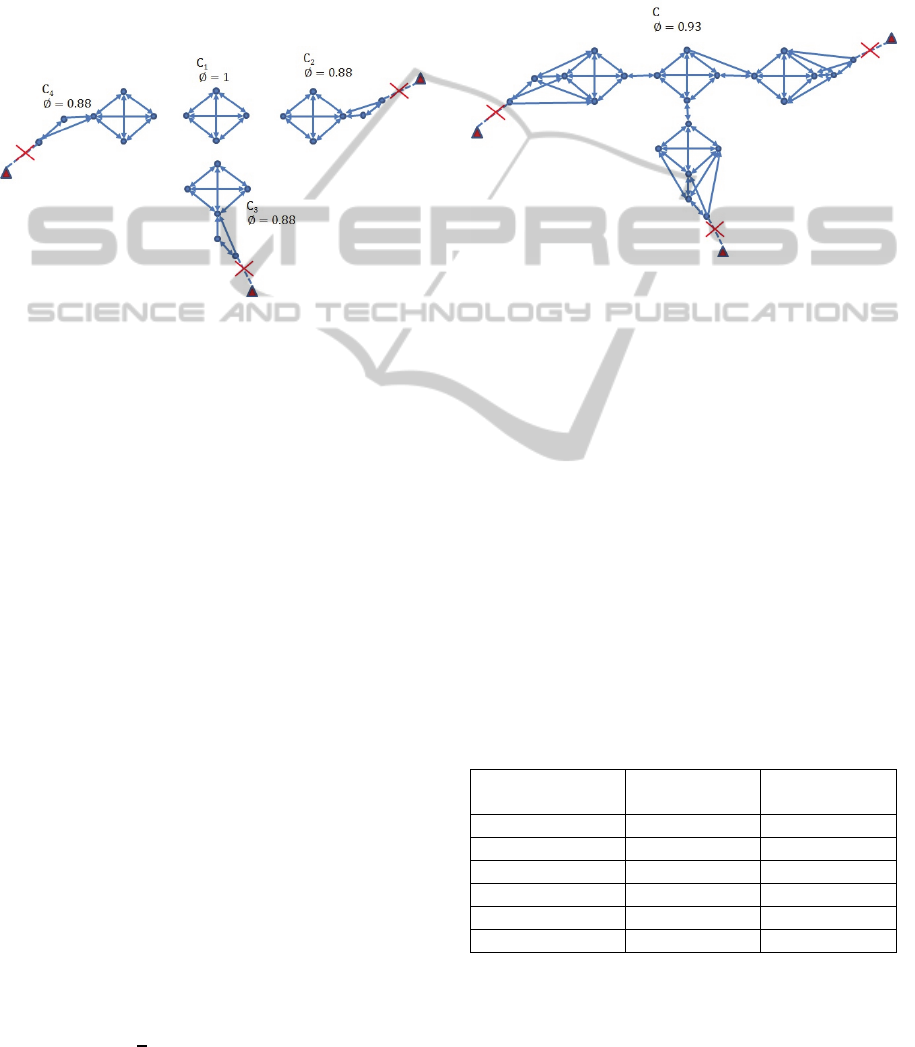
situations. Figure (1) shows a syntactic but very
close to a real situation in many datasets.
Figure 1: The components which are not allowed to be
merged with each other in KAOG.
As shown in Figure (1), the samples indicated by
“circle” come from the same class, based on which
four components are built (C
1
, C
2
, C
3
, C
4
). The value
of K for this figure is 3. The purity measure for C
1
is
1 as all the samples in this component are connected
to each other with in and out degree of 3. The other
components have the purity value of 0.88 because
some samples connect to the samples from the other
class. A purity value of 0.88 indicates that the
majority of samples in the components are well-
connected to each other. These components are
potentially good candidates to connect to each other
and create a larger component. But based on
Algorithm 2 and its merging condition (line 8), it is
impossible to merge these components because C
1,
with purity measure of 1, cannot be merged with any
other components which have the purity measure
lower than one (such as the one with purity measure
of 0.88). This is why the algorithm does not permit
the components to be merged.
Based on our experiments with real datasets,
there are too many small components which are not
allowed to be merged with each other. Even for
small datasets like Iris, there are 16 components
most of which are small and consist of only two or
three samples. In our proposed modification, we
change the merging condition and replace line 8 in
algorithm 2 with the following condition:
If (∅
∑
∅
) for all
⊆
This means that if the purity measure of the newly
merged component is higher than the average of the
purity measure for all the components participating
in the current merging process, then the component
is allowed to be merged.
By applying the proposed new condition, the four
components in figure (1) have the chance to be
merged with each other as shown in Figure (2).
Figure 2: The components merged based on the modified
(MKAOG) algorithm.
The purity of the final component is 0.93 which is a
high level of purity. Also, all the samples are
presented as one component. By merging the small
components, the proposed method is less sensitive to
the input noise. In the section on experimental
results, we demonstrate that the proposed method is
less sensitive to noise in comparison with the
original KAOG algorithm.
4 EXPERIMENTAL RESULTS
In this section, we evaluate the proposed MKAOG
method on various datasets including some well-
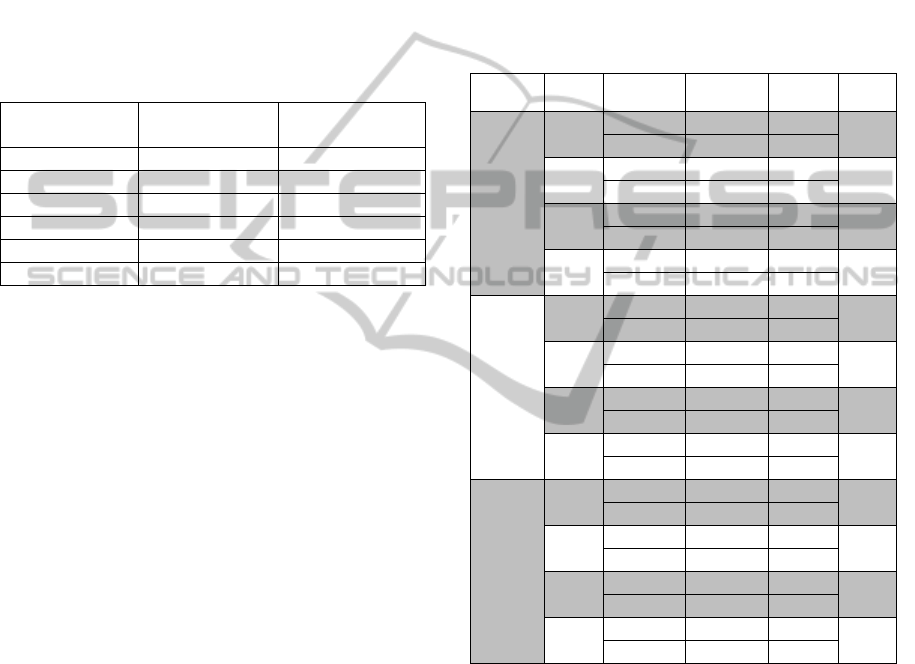
known datasets from the UCI repository. Table (1)
shows the details of the datasets.
Table 1: Summary of the datasets.
Dataset
Number of
features
Number of
Samples
Iris 4 150
Wine 13 178
Glass 9 223
Ecoli 7 327
Ionosphere 34 351
Diabet 8 768
For evaluating the proposed method, we consider the
number of components, correct detection rate,
standard deviation (SD) and t-Test criteria to
examine whether the improvements are significant
ANoiseResilientandNon-parametricGraph-basedClassifier
173
or not. Also, to demonstrate that our proposed
method is less sensitive to noise compared to the
original KAOG algorithm, we evaluate the algorithm
efficiency in the presence of different levels of
noise.
4.1 The Number of Components
In this section we compare the proposed MKAOG
method with the KAOG in terms of the number of
components. Table (2) shows the result of this
experiment.
Table 2: Number of components for KAOG and MKAOG.
Dataset name
No. Component –
KAOG
No. Components –
MKAOG
Iris 16 7
Wine 29 25
Glass 38 29
Ecoli 50 15
Ionosphere 34 17
Diabet 126 65
As shown in Table (2), the number of components
for MKAOG is always less than that of KAOG. In
the case of Ecoli and Diabet datasets, the difference
is much more significant than the other cases. In the
case of Wine, they are almost the same. For the Iris
dataset, the number of components for MKAOG is
less than half of the number of components for
KAOG. The values reported in this table are the
average of 30 different independent runs which are
rounded up to the nearest integer value. The lower
number of components indicates existence of larger
components, which means less sensitivity to noise.
Next, we evaluate the proposed method based on the
correct detection rate and standard deviation (SD).
4.2 The Correct Detection Rate and
t-Test
In this section, we evaluate the correct recognition
rate of the MKAOG algorithm, and compare the
results with the ones for the KAOG. Table (3) shows
the results of the experiment on different datasets.
Each number in the tables is the average of 30
different independent runs. We also used t-Test to
illustrate whether the improvement is significant or
not. Table (3) shows the results on Iris, Wine and
Glass datasets. For each level of noise, there is an
associated t-Test result. A t-Test value of “one”
indicates a significant difference between the
accuracy and SD of KAOG and MKAOG. In such
cases, the method with higher accuracy outperforms
the other one. A t-Test value of “zero” indicates that
the difference between the two methods is not
significant, and they are almost the same.
In addition to the original datasets, we also
generated three modified datasets with adding three
different levels of noise, 5%, 10% and 20%. The
modified (i.e. noisy) datasets were generated by
randomly changing the class of samples in the
training dataset.
Table 3: The Accuracy and associated t-Test for the
KAOG and MKAOG methods in presence of different
levels of noise in Iris, Wine and Glass datasets.
Dataset
Noise
level
Accuracy SD
t-
Test
Iris
0%
KAOG 94.8444 3.0111
0
MKAOG 94.8224 3.007
5%
KAOG 89.4 4.8917
0
MKAOG 92.5176 3.927
10%
KAOG 83.9778 5.775
1
MKAOG 90.3474 4.5117
20%
KAOG 74.3111 7.6219
1
MKAOG 83.5119 6.974
Wine
0%
KAOG 85.5472 4.0341
0
MKAOG 86.5471 3.7573
5%
KAOG 83.717 5.6052
1
MKAOG 85.3047 4.0434
10%
KAOG 72.0189 5.9485
1
MKAOG 77.7547 5.8232
20%
KAOG 68.0566 7.2052
1
MKAOG 71.7547 6.8851
Glass
0%
KAOG 69.4478 4.3607
0
MKAOG 69.434 4.3587
5%
KAOG 66.8955 5.7762
0
MKAOG 68.0215 5.2685
10%
KAOG 63.2463 6.1238
1
MKAOG 64.4925 5.1054
20%
KAOG 58.6269 6.5044
1
MKAOG 61.5794 6.0127
The accuracy of the MKAOG is higher than that of
KAOG most of the time, and the standard deviation
for 30 different runs is always lower than that of
KAOG. Moreover, when the level of noise is
increased, the difference between the two methods is
more significant. Additionally, t-Test measurement
shows that, while on the original iris dataset (without
any noise) the difference is not significant, but by
adding noise to the training set, the t-Test indicates a
significant difference between the KAOG and
MKAOG results. This confirms the proposed
method is less sensitive to the input noise than the
KAOG. For the original Glass dataset and the one
with 5% noise, the improvement is not significant.
However, with increasing the level of noise, the
KDIR2014-InternationalConferenceonKnowledgeDiscoveryandInformationRetrieval
174

difference between the correct detection rates is
obvious, and the t-Test confirms this improvement.
This illustrates that even if the performance of
KAOG and MKAOG on the original dataset is the
same, however, by adding noise to the dataset, the
difference between the two methods becomes more
significant, as the MKAOG is much more resilient to
noise
5 CONCLUSIONS
In this paper, we proposed a non-parametric and
noise resilient classification algorithm based on the
graph structure. Our proposed algorithm consists of
a modification of the training phase of the KAOG
algorithm. The MKAOG method produces less
number of components, which makes it a robust
algorithm in the presence of different level of noise.
We evaluated the proposed method on various
datasets from the UCI repository. The experimental
results demonstrate that the proposed algorithm has
high correct detection rate (accuracy), while
exhibiting robustness in the presence of of noise.
MKAOG outperforms KAOG in terms of accuracy.
The t-Test evaluation confirms that the difference
between accuracies of MAKOG and KAOG is
significant.
REFERENCES
Belkin, P. Niyogi, Laplacian eigenmaps for dimensionality
reduction and data representation, Neural Computation
15 (2003) 1373–1396.
Bertini Jr, Liang Zhao, Robson Motta, Alneu de Andrade
Lopes, ‘A nonparametric classification method based
on K-associated graphs’, Information Sciences 181
(2011) 5435–5456.
Chatterjee A, Raghava P, ‘Similarity Graph
Neighborhoods for Enhanced Supervised
Classification’, Procedia Computer Science, Volume
9, 2012, Pages 577–586.
Chen, L. Li, J. Peng, Error bounds of multi-graph
regularized semi-supervised classification, Information
Sciences 179 (2009) 1960–1969.
Deshpande, M. Kuramochi, and G. Karypis, “Frequent
Sub-Structure-Based Approaches for Classifying
Chemical Compounds,” IEEE Transactionson
Knowledge and Data Engineering, vol. 17, no. 8, pp.
1036– 1050, 2005.
Dhanjala C, Gaudelb R, Clémençonc S, ‘Efficient eigen-
updating for spectral graph clustering’,
Neurocomputing, Volume 131, 5 May 2014, Pages
440–452.
Gonzalez, L. Holder, and D. Cook, “Graph-based
relational concept learning,” Proceedings of the
Nineteenth International Conference on Machine
Learning, 2002.
Jun Ye, Zhong Jin, “Dual-graph regularized Concept
Factorization for Clustering”, Neurocomputing, In
Press, Accepted Manuscript, Available online 13 April
2014.
Ketkar, N.S. ; Holder, L.B. ; Cook, D.J.,’ Empirical
comparison of graph classification algorithms’,
Computational Intelligence and Data Mining, 2009.
CIDM '09. 259 – 266.
Marios Iliofotou, Hyun-chul Kim, Michalis Faloutsos,
Michael Mitzenmacher, Prashanth Pappu, George
Varghese, ‘Graption: A graph-based P2P traffic
classification framework for the internet backbone’,
Computer Networks 55 (2011) 1909–1920.
Vathy-Fogarassy, J. Abonyi, Local and global mappings
of topology representing networks, Information
Sciences 179 (2009) 3791–3803.
Zhu X, Semi-Supervised Learning Literature Survey,
Technical Report 1530, Computer-Science, University
of Wisconsin-Madison, 2008.
ANoiseResilientandNon-parametricGraph-basedClassifier
175
